Material Science_ Vol 1 of 2 - US DOE (1993) Episode 7 doc
Bạn đang xem bản rút gọn của tài liệu. Xem và tải ngay bản đầy đủ của tài liệu tại đây (185.24 KB, 10 trang )
Properties of Metals DOE-HDBK-1017/1-93 STRAIN
When metal experiences strain, its volume remains constant. Therefore, if volume remains
constant as the dimension changes on one axis, then the dimensions of at least one other axis
must change also. If one dimension increases, another must decrease. There are a few
exceptions. For example, strain hardening involves the absorption of strain energy in the
material structure, which results in an increase in one dimension without an offsetting decrease
in other dimensions. This causes the density of the material to decrease and the volume to
increase.
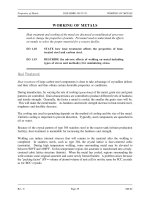
If a tensile load is applied to a material, the material will elongate on the axis of the load
(perpendicular to the tensile stress plane), as illustrated in Figure 2(a). Conversely, if the load
is compressive, the axial dimension will decrease, as illustrated in Figure 2(b). If volume is
constant, a corresponding lateral contraction or expansion must occur. This lateral change will
bear a fixed relationship to the axial strain. The relationship, or ratio, of lateral to axial strain
is called Poisson's ratio after the name of its discoverer. It is usually symbolized by ν.
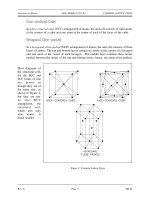
Whether or not a material can deform
Figure 2 Change of Shape of Cylinder Under Stress
plastically at low applied stresses depends
on its lattice structure. It is easier for
planes of atoms to slide by each other if
those planes are closely packed.
Therefore lattice structures with closely
packed planes allow more plastic
deformation than those that are not closely
packed. Also, cubic lattice structures
allow slippage to occur more easily than
non-cubic lattices. This is because of
their symmetry which provides closely
packed planes in several directions. Most
metals are made of the body-centered
cubic (BCC), face-centered cubic (FCC),
or hexagonal close-packed (HCP) crystals,
discussed in more detail in the Module 1,
Structure of Metals. A face-centered
cubic crystal structure will deform more
readily under load before breaking than a
body-centered cubic structure.
The BCC lattice, although cubic, is not
closely packed and forms strong metals. α-iron and tungsten have the BCC form. The FCC
lattice is both cubic and closely packed and forms more ductile materials. γ-iron, silver, gold, and
lead are FCC structured. Finally, HCP lattices are closely packed, but not cubic. HCP metals
like cobalt and zinc are not as ductile as the FCC metals.
Rev. 0 Page 9 MS-02
STRAIN DOE-HDBK-1017/1-93 Properties of Metals
The important information in this chapter is summarized below.
Strain is the proportional dimensional change, or the intensity or degree of
distortion, in a material under stress.
Plastic deformation is the dimensional change that does not disappear when the
initiating stress is removed.
Proportional limit is the amount of stress just before the point (threshold) at which
plastic strain begins to appear or the stress level and the corresponding value of
elastic strain.
Two types of strain:
Elastic strain is a transitory dimensional change that exists only while the
initiating stress is applied and disappears immediately upon removal of the
stress.
Plastic strain (plastic deformation) is a dimensional change that does not
disappear when the initiating stress is removed.
γ-iron face-centered cubic crystal structures deform more readily under load before
breaking than α-iron body-centered cubic structures.
MS-02 Page 10 Rev. 0
Properties of Metals DOE-HDBK-1017/1-93 YOUNG'S MODULUS
YOUNG'S MODULUS
This chapter discusses the mathematical method used to calculate the elongation
of a material under tensile force and elasticity of a material.
EO 1.7 STATE Hooke's Law.
EO 1.8 DEFINE Young's Modulus (Elastic Modulus) as it relates to
stress.
EO 1.9 Given the values of the associated material properties,
CALCULATE the elongation of a material using Hooke's Law.
If a metal is lightly stressed, a temporary deformation, presumably permitted by an elastic
displacement of the atoms in the space lattice, takes place. Removal of the stress results in a
gradual return of the metal to its original shape and dimensions. In 1678 an English scientist
named Robert Hooke ran experiments that provided data that showed that in the elastic range of
a material, strain is proportional to stress. The elongation of the bar is directly proportional to
the tensile force and the length of the bar and inversely proportional to the cross-sectional area
and the modulus of elasticity.
Hooke's experimental law may be given by Equation (2-3).
(2-3)δ
P
AE
This simple linear relationship between the force (stress) and the elongation (strain) was
formulated using the following notation.
P = force producing extension of bar (lbf)
= length of bar (in.)
A = cross-sectional area of bar (in.
2
)
δ = total elongation of bar (in.)
E = elastic constant of the material, called the Modulus of Elasticity, or
Young's Modulus (lbf/in.
2
)
The quantity E, the ratio of the unit stress to the unit strain, is the modulus of elasticity of the
material in tension or compression and is often called Young's Modulus.
Rev. 0 Page 11 MS-02
YOUNG'S MODULUS DOE-HDBK-1017/1-93 Properties of Metals
Previously, we learned that tensile stress, or simply stress, was equated to the load per unit area
or force applied per cross-sectional area perpendicular to the force measured in pounds force per
square inch.
(2-4)σ
P
A
We also learned that tensile strain, or the elongation of a bar per unit length, is determined by:
(2-5)ε
δ
Thus, the conditions of the experiment described above are adequately expressed by Hooke's Law
for elastic materials. For materials under tension, strain (ε) is proportional to applied stress σ.
(2-6)ε
σ
E
where
E = Young's Modulus (lbf/in.
2
)
σ = stress (psi)
ε = strain (in./in.)
Young's Modulus (sometimes referred to as Modulus of Elasticity, meaning "measure" of
elasticity) is an extremely important characteristic of a material. It is the numerical evaluation
of Hooke's Law, namely the ratio of stress to strain (the measure of resistance to elastic
deformation). To calculate Young's Modulus, stress (at any point) below the proportional limit
is divided by corresponding strain. It can also be calculated as the slope of the straight-line
portion of the stress-strain curve. (The positioning on a stress-strain curve will be discussed
later.)
E = Elastic Modulus =
stress
strain
psi
in./in.
psi
or
(2-7)E
σ
ε
MS-02 Page 12 Rev. 0
Properties of Metals DOE-HDBK-1017/1-93 YOUNG'S MODULUS
We can now see that Young's Modulus may be easily calculated, provided that the stress and
corresponding unit elongation or strain have been determined by a tensile test as described
previously. Strain (ε) is a number representing a ratio of two lengths; therefore, we can
conclude that the Young's Modulus is measured in the same units as stress (σ), that is, in pounds
per square inch. Table 1 gives average values of the Modulus E for several metals used in DOE
facilities construction. Yield strength and ultimate strength will be discussed in more detail in
the next chapter.
E (psi) Yield Strength (psi) Ultimate Strength (psi)
Aluminum 1.0 x 10
7
3.5 x 10
4
to 4.5 x 10
4
5.4 x 10
4
to 6.5 x 10
4
Stainless Steel 2.9 x 10
7
4.0 x 10
4
to 5.0 x 10
4
7.8 x 10
4
to 10 x 10
4
Carbon Steel 3.0 x 10
7
3.0 x 10
4
to 4.0 x 10
4
5.5 x 10
4
to 6.5 x 10
4
Example:
What is the elongation of 200 in. of aluminum wire with a 0.01 square in. area if it
supports a weight of 100 lb?
Solution:
δ = (2-8)
P
AE
=
(100 lb) (200 in.)
(0.01 in.
2
)(1.0x10
7
lb/in.
2
)
δ = 0.2 in.
Rev. 0 Page 13 MS-02
YOUNG'S MODULUS DOE-HDBK-1017/1-93 Properties of Metals
The important information in this chapter is summarized below.
Hooke's Law states that in the elastic range of a material strain is
proportional to stress. It is measured by using the following equation:
δ
P
AE
Young's Modulus (Elastic Modulus) is the ratio of stress to strain, or
the gradient of the stress-strain graph. It is measured using the
following equation:
E
σ
ε
MS-02 Page 14 Rev. 0
Properties of Metals DOE-HDBK-1017/1-93 STRESS-STRAIN RELATIONSHIP
STRESS-STRAIN RELATIONSHIP
Most polycrystalline materials have within their elastic range an almost constant
relationship between stress and strain. Experiments by an English scientist named
Robert Hooke led to the formation of Hooke's Law, which states that in the elastic
range of a material strain is proportional to stress. The ratio of stress to strain,
or the gradient of the stress-strain graph, is called the Young's Modulus.
EO 1.10 DEFINE the following terms:
a. Bulk Modulus
b. Fracture point
EO 1.11 Given stress-strain curves for ductile and brittle material,
IDENTIFY the following specific points on a stress-strain curve.
a. Proportional limit
b. Yield point
c. Ultimate strength
d. Fracture point
EO 1.12 Given a stress-strain curve, IDENTIFY whether the type of
material is ductile or brittle.
EO 1.13 Given a stress-strain curve, INTERPRET a stress-strain curve
for the following:
a. Application of Hooke's Law
b. Elastic region
c. Plastic region
The elastic moduli relevant to polycrystalline material are Young's Modulus of Elasticity, the
Shear Modulus of Elasticity, and the Bulk Modulus of Elasticity.
Young's Modulus of Elasticity is the elastic modulus for tensile and compressive stress and
is usually assessed by tensile tests. Young's Modulus of Elasticity is discussed in detail
in the preceding chapter.
Rev. 0 Page 15 MS-02
STRESS-STRAIN RELATIONSHIP DOE-HDBK-1017/1-93 Properties of Metals
The Shear Modulus of Elasticity is derived from the torsion of a cylindrical test piece.
Its symbol is G.
The Bulk Modulus of Elasticity is the elastic response to hydrostatic pressure and
equilateral tension or the volumetric response to hydrostatic pressure and equilateral
tension. It is also the property of a material that determines the elastic response to the
application of stress.
To determine the load-carrying ability and the amount of deformation before fracture, a sample
of material is commonly tested by a Tensile Test. This test consists of applying a gradually
increasing force of tension at one end of a sample length of the material. The other end is
anchored in a rigid support so that the sample is slowly pulled apart. The testing machine is
equipped with a device to indicate, and possibly record, the magnitude of the force throughout
the test. Simultaneous measurements are made of the increasing length of a selected portion at
the middle of the specimen, called the gage length. The measurements of both load and
elongation are ordinarily discontinued shortly after plastic deformation begins; however, the
maximum load reached is always recorded. Fracture point is the point where the material
fractures due to plastic deformation. After the specimen has been pulled apart and removed from
the machine, the fractured ends are fitted together and measurements are made of the now-
extended gage length and of the average diameter of the minimum cross section. The average
diameter of the minimum cross section is measured only if the specimen used is cylindrical.
The tabulated results at the end of the test consist of the following.
a. designation of the material under test
b. original cross section dimensions of the specimen within the gage length
c. original gage length
d. a series of frequent readings identifying the load and the corresponding gage
length dimension
e. final average diameter of the minimum cross section
f. final gage length
g. description of the appearance of the fracture surfaces (for example, cup-cone,
wolf's ear, diagonal, start)
MS-02 Page 16 Rev. 0
Properties of Metals DOE-HDBK-1017/1-93 STRESS-STRAIN RELATIONSHIP
A graph of the results is made from the tabulated data. Some testing machines are equipped with
an autographic attachment that draws the graph during the test. (The operator need not record
any load or elongation readings except the maximum for each.) The coordinate axes of the graph
are strain for the x-axis or scale of abscissae, and stress for the y-axis or scale of ordinates. The
ordinate for each point plotted on the graph is found by dividing each of the tabulated loads by
the original cross-sectional area of the sample; the corresponding abscissa of each point is found
by dividing the increase in gage length by the original gage length. These two calculations are
made as follows.
Stress = = psi or lb/in.
2
(2-9)
load
area of original cross section
P
A
o
Strain = (2-10)
instantaneous gage length original
original gage length
elongation
original gage length
= = inches per inch x 100 = percent elongation (2-11)
L L
o
L
o
Stress and strain, as computed here, are sometimes called "engineering stress and strain." They
are not true stress and strain, which can be computed on the basis of the area and the gage length
that exist for each increment of load and deformation. For example, true strain is the natural log
of the elongation (ln (L/L
o)
), and true stress is P/A, where A is area. The latter values are usually
used for scientific investigations, but the engineering values are useful for determining the load-
carrying values of a material. Below the elastic limit, engineering stress and true stress are
almost identical.
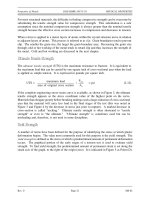
Figure 3 Typical Ductile Material
Stress-Strain Curve
The graphic results, or stress-strain diagram, of
a typical tension test for structural steel is
shown in Figure 3. The ratio of stress to strain,
or the gradient of the stress-strain graph, is
called the Modulus of Elasticity or Elastic
Modulus. The slope of the portion of the curve
where stress is proportional to strain (between
Points 1 and 2) is referred to as Young's
Modulus and Hooke's Law applies.
The following observations are illustrated in
Figure 3:
Hooke's Law applies between
Points 1 and 2.
Hooke's Law becomes questionable between Points 2 and 3 and strain increases
more rapidly.
Rev. 0 Page 17 MS-02
STRESS-STRAIN RELATIONSHIP DOE-HDBK-1017/1-93 Properties of Metals
The area between Points 1 and 2 is called the elastic region. If stress is removed,
the material will return to its original length.
Point 2 is the proportional limit (PL) or elastic limit, and Point 3 is the yield
strength (YS) or yield point.
The area between Points 2 and 5 is known as the plastic region because the
material will not return to its original length.
Point 4 is the point of ultimate strength and Point 5 is the fracture point at which
failure of the material occurs.
Figure 3 is a stress-strain curve typical of a
Figure 4 Typical Brittle Material Stress-Strain Curve
ductile material where the strength is small,
and the plastic region is great. The material
will bear more strain (deformation) before
fracture.
Figure 4 is a stress-strain curve typical of a
brittle material where the plastic region is
small and the strength of the material is high.
The tensile test supplies three descriptive facts
about a material. These are the stress at
which observable plastic deformation or
"yielding" begins; the ultimate tensile strength
or maximum intensity of load that can be
carried in tension; and the percent elongation
or strain (the amount the material will stretch)
and the accompanying percent reduction of
the cross-sectional area caused by stretching.
The rupture or fracture point can also be
determined.
MS-02 Page 18 Rev. 0