Báo cáo y học: "Pvt1-encoded microRNAs in oncogenesis" pps
Bạn đang xem bản rút gọn của tài liệu. Xem và tải ngay bản đầy đủ của tài liệu tại đây (836.71 KB, 14 trang )
BioMed Central
Page 1 of 14
(page number not for citation purposes)
Retrovirology
Open Access
Research
Pvt1-encoded microRNAs in oncogenesis
Gabriele B Beck-Engeser
†1
, AmyMLum
†2
, Konrad Huppi
3
,
Natasha J Caplen
3
, Bruce B Wang
2
and Matthias Wabl*
1
Address:
1
Department of Microbiology and Immunology, University of California, San Francisco, CA 94143-0414, USA,
2
Picobella, L.L.C., 863
Mitten Road, Suite 101, Burlingame, CA 94010, USA and
3
Gene Silencing Section, Genetics Branch, Center Cancer Research, National Cancer
Institute, Bethesda, MD 20892, USA
Email: Gabriele B Beck-Engeser - ; Amy M Lum - ; Konrad Huppi - ;
Natasha J Caplen - ; Bruce B Wang - ; Matthias Wabl* -
* Corresponding author †Equal contributors
Abstract
Background: The functional significance of the Pvt1 locus in the oncogenesis of Burkitt's
lymphoma and plasmacytomas has remained a puzzle. In these tumors, Pvt1 is the site of reciprocal
translocations to immunoglobulin loci. Although the locus encodes a number of alternative
transcripts, no protein or regulatory RNA products were found. The recent identification of non-
coding microRNAs encoded within the PVT1 region has suggested a regulatory role for this locus.
Results: The mouse Pvt1 locus encodes several microRNAs. In mouse T cell lymphomas induced
by retroviral insertions into the locus, the Pvt1 transcripts, and at least one of their microRNA
products, mmu-miR-1204 are overexpressed. Whereas up to seven co-mutations can be found in
a single tumor, in over 2,000 tumors none had insertions into both the Myc and Pvt1 loci.
Conclusion: Judging from the large number of integrations into the Pvt1 locus – more than in the
nearby Myc locus – Pvt1 and the microRNAs encoded by it are as important as Myc in T
lymphomagenesis, and, presumably, in T cell activation. An analysis of the co-mutations in the
lymphomas likely place Pvt1 and Myc into the same pathway.
Background
Ever since its discovery in 1984 [1], the Pvt1 locus (in
humans PVT1, for plasmacytoma variant translocation)
has remained enigmatic. Although human and mouse
PVT1 directs the synthesis of a large transcript, which gives
rise to a variety of RNAs in normal cells [2-4], no protein
product or regulatory RNA were identified. Nevertheless,
the importance of the PVT1 locus is gleaned from the
observations that it is the site of both tumorigenic translo-
cations and retroviral insertions. In Burkitt's lymphoma,
the so-called 'variant' translocations, T(2:8) or T(8:22),
found in about 20% of such tumors, juxtapose immu-
noglobulin kappa or lambda light chain genes to the PVT1
locus. This results in chimeric transcripts of 0.9 to 1.2 kilo-
base (kb), containing the first exon of PVT1 on chromo-
some 8 and the constant region of kappa or lambda [4,5].
Although the chimeric transcripts might contribute to
tumor formation, an oncogenic effect could also be medi-
ated by the MYC protooncogene, just 40 to 60 kb
upstream. Indeed, 80% of the translocations in Burkitt's
lymphoma juxtapose MYC to the immunoglobulin heavy
chain locus, with MYC being overexpressed as a conse-
quence. Since MYC is also overexpressed in cells with var-
iant translocations, it has been thought that activation of
Published: 14 January 2008
Retrovirology 2008, 5:4 doi:10.1186/1742-4690-5-4
Received: 29 October 2007
Accepted: 14 January 2008
This article is available from: />© 2008 Beck-Engeser et al; licensee BioMed Central Ltd.
This is an Open Access article distributed under the terms of the Creative Commons Attribution License ( />),
which permits unrestricted use, distribution, and reproduction in any medium, provided the original work is properly cited.
Retrovirology 2008, 5:4 />Page 2 of 14
(page number not for citation purposes)
MYC may occur either directly [4], at a remarkable dis-
tance along the chromosome, or indirectly, via the PVT1
gene product [3,6].
In multiple myeloma, 16% of patients have the PVT1
region rearranged, but independent of the immunoglobu-
lin loci [7]. In most murine plasmacytomas, t(15:12)
translocations, analogous to the T(8:14) translocations in
Burkitt's lymphoma, fuse the 5' end of the c-Myc gene to
an immunoglobulin heavy-chain gene; there are also the
t(6:15) translocations, where the chromosome 6 break-
point is near the constant region of kappa and the chro-
mosome 15 sequences are from the Pvt1 locus [1,6]. In
these plasmacytomas, the expression of the (truncated)
Pvt1 transcripts is increased [3].
Pvt1 is also a common retroviral integration site in murine
leukemia virus (MLV) induced T lymphomas in mice [8]
and rats [9,10]. Common integration sites identify pro-
tooncogenes and tumor suppressor genes, because the
provirus not only acts as a mutagen, but it also "tags" the
integration site with its own sequences [11]. The so-called
proviral tagging method has been used to identify many
new protooncogenes as well as to confirm already known
protooncogenes discovered by virtue of their homology to
viral oncogenes, and entire genomes have been searched
for genes involved in cancer development [12-21]. These
genes include non-coding RNA [22], such as oncogenic
microRNAs (miRNAs) [23-25], for which models in viral
oncogenesis have been described [26]. In the proviral tag-
ging method, mice are infected with a oncogenesis have
been described [26]. In the proviral tagging method, mice
are infected with a retrovirus that does not contain any
oncogene (for example, MLV). The virus integrates into
the cellular genome and inserts its DNA near or within
genes, which leads to various outcomes: (i) The insertion
site is too far away from a protooncogene and thus does
not activate it. In this case, there will be no selection for
that cell. (ii) The provirus inserts near a protooncogene,
but not within the gene (type 1). In this case, either the
viral promoter, or the viral enhancer increases the expres-
sion level of the protooncogene. (iii) The provirus inserts
within a gene, destroying or altering its function (type 2).
In both type 1 and type 2 insertion events, if the gene is
not a protooncogene or tumor suppressor gene, there will
be no selection for that cell. If integration results in forma-
tion of a tumor, genomic DNA adjacent to the integration
site can be recovered, sequenced and mapped to the
genome. Genes neighboring the proviral integration can
then be identified and classified as either protooncogenes
or tumor suppressor genes.
In a large-scale retroviral insertion mutagenesis screen, we
used MLV strain SL3-3, which causes T lymphomas [27].
We previously demonstrated that a group of these retrovi-
ral insertions induces overexpression of the oncogenic
mmu-mir-17 miRNA cistron [23] and mmu-mir-106a
[24], among other miRNAs. The Pvt1 locus is among the
top targets of retroviral insertions in T lymphomas, but it
encodes transcripts with no known protein product.
Recently, PVT1 based miRNA candidates have been iden-
tified and confirmed experimentally [28], and here we
studied the effect of MLV integration on the expression of
Pvt1 and the miRNAs. By virtue of being tagged by the ret-
rovirus that mediated tumor formation, these miRNAs
could then be defined as oncogenic.
Results and Discussion
Retroviral integrations into the Myc and Pvt1 loci
We identified 6234 integration sites, or tags, in 2199 T-cell
tumors. In these tumors, 243 tags were located at or near
the Pvt1 locus, distributed over a region of 679,620 bp;
additionally 134 tags were located at the Myc locus, dis-
tributed over 105,445 bp (Fig. 1). The proviral inserts
were in both sense and anti-sense orientations with
respect to each transcript encoded by the Myc and Pvt1
loci, respectively. The Mouse Retroviral Tagged Cancer
Gene Database [29], which compiles retroviral insertions
into the genomic DNA from various non-T cell derived
mouse tumors, also lists 37 integrations when searched by
the Myc locus, some of which are in fact in the Pvt1 locus.
Insertions at the Pvt1 locus were originally reported in
myelogenous mouse leukemia [29], and, as mentioned
above, in the work defining the Pvt1 locus in T lympho-
mas induced by MLV in both mice and rats [8-10].
Remarkably, in a separate screen (data not shown) where
we recovered 1798 tags from B lymphomas induced by
the MLV strain Akv [15,30], only one tag was found at the
Myc locus, and none at the Pvt1 locus.
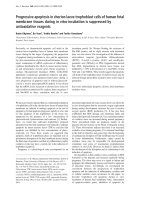
Fig. 1 shows a customized screen print of the UCSC
genome web site browser, looking at the Myc and Pvt1
loci. The bars in green represent the retroviral insertions in
T lymphomas studied here; below them are the exon-
intron structures of Myc and Pvt1, respectively. At the Myc
locus, there are two main integration sites clusters flank-
ing the gene upstream and downstream of it. Whereas the
Myc transcript is clearly defined, there are several alterna-
tive transcripts depicted for Pvt1, a variety that was noted
before [2-4]. Notably, there are two reference sequences,
AK090048 and Z11981, which do not share any
sequences, but are denoted as Pvt1 nevertheless. Further-
more, among the mRNAs from GenBank, there are other
fragments of apparently intronic transcripts, and there is
AK030859, which represents an extended exon 1. At any
rate, there are three main integration site clusters at the
Pvt1 locus, as represented by transcript AK090048 – one
upstream of the transcript, and two within the locus.
Retrovirology 2008, 5:4 />Page 3 of 14
(page number not for citation purposes)
Transcriptional orientation of provirus and target gene
When a genomic region is gene-rich, it is not always
straightforward to identify the target gene of insertional
mutagenesis. In the past, it has been assumed that the ret-
roviral enhancer can act over a distance of 200 kb in either
direction, but without "leapfrogging" a gene promoter.
With this assumption, because one of the proximal pro-
moters will always be the retroviral promoter, the orienta-
tion of the provirus in regard to the direction of
transcription of the gene will be important. Indeed, the
The Pvt1 and the Myc loci have separate and distinct common integration sitesFigure 1
The Pvt1 and the Myc loci have separate and distinct common integration sites. Screen print of a customized ver-
sion of the UCSC genome website browser (mouse February 2006 (mm8) genome assembly) depicting the Myc and the Pvt1
locus in the mouse. Numbers at the top, nucleotide position at chromosome 15. Green squares indicate insertion sites. Below
them are the exon-intron structures of Myc and Pvt1, respectively. Pvt1 is represented by two reference sequences, AK090048
and Z11981, which do not share any sequence homology, but there are other transcripts as well: Below the reference
sequences, there are various mouse mRNAs from GenBank. In this representation, the myc exons (thin vertical bars) are com-
pressed. Introns are represented by horizontal lines, with the arrows denoting direction of transcription. Myc transcription is
from left to right, and most Pvt1 transcripts are also from left to right.
Retrovirology 2008, 5:4 />Page 4 of 14
(page number not for citation purposes)
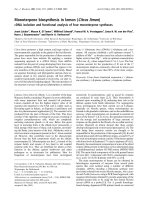
two integration clusters into the Myc locus are an example
of this prediction: the direction of transcription of the pro-
virus upstream of the Myc gene always points away from
the gene (Fig. 2A; with the exception of the three inser-
tions, boxed in red, which presumably are "promoter
insertions," i.e., the transcript is driven by the viral pro-
moter rather than the endogenous promoter). In contrast,
the cluster downstream of the Myc locus contains provi-
ruses in the same orientation as Myc (Fig. 2B). In both
cases, this arrangement allows the retroviral 5' enhancer
to interact with the Myc promoter, although other inter-
pretations are viable (see below). Because of the rule that
the retroviral enhancer does not "leapfrog" promoters,
but synergizes with the two promoters next to it, the two
clusters targeting Myc are not expected to directly influ-
ence Pvt1 transcription, 50 kb downstream.
The criterion of orientation does not hold in an immedi-
ately obvious way if a virus integrates into a transcription
unit, as it does at the Pvt1 locus. In this case, especially as
many alternative transcripts have been identified, the
exact location of the retrovirus – 5'UTR, 3'UTR, intron, or
exon is important. Apart from the retroviral enhancer
cooperating with the gene promoter in a conventional
manner, the retroviral promoter may override the endog-
enous promoter, or it may initiate a (truncated) transcript,
in addition to truncating or destroying one. If the provirus
is located with the UTR, it may also affect mRNA stability,
although in that case no preference in proviral orientation
would be obvious. If the Pvt1 nuclear (primary) transcript
encodes miRNAs, we cannot predict the likely conse-
quence of a particular integration – whether the steady-
state levels of all or only a few miRNAs change. A low level
of Pvt1 transcript does not necessarily mean little miRNA
product. For example, NIH-3T3 mouse fibroblasts express
very little primary RNA of the mir-17-20 cistron, but as
much mature mir-17-3p as T cell tumors with retroviral
integrations into the primary transcript [23]. This points
to the possibility that retroviral insertions do not always
have to increase the levels of primary transcripts in order
to produce more mature product; instead they might
make the processing of miRNA from the primary tran-
script more efficient.
Overexpression of Pvt1 transcript
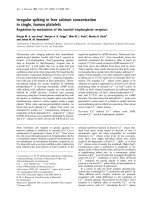
Fig. 3 shows a higher magnification of the area around
exon 1 of Pvt1, where a main cluster of 78 integrations is
located. Because a plurality of the Pvt1 integrations clus-
tered around exon 1, we determined the expression levels
of that exon (exon 1a) in various tumors by quantitative
PCR, using a primer set that covered the 5' end of this
exon (see boxed area in transcript AK030859 depicted in
Fig. 3; the 5' end of the exon representing AK030859 is
shared with exon 1 of the reference sequence AK090048).
Of the tumors with integrations shown in Fig. 3, the des-
ignations of tumors we selected are shown in bold face
type, and are numbered (1) through (28) (only tumors 1
through 24 are shown in Fig. 3; the integration sites of
these tumors, and all other tumors studied here, along
with the relative transcription orientation of the provi-
ruses, are given in Table 1). As compared to control
tumors, which have no integration into the Pvt1 locus,
most tumors with the integrations selected in Fig. 3 over-
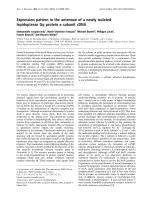
expressed the Pvt1 transcript, up to 40-fold (Fig. 4A).
Tumors 10 through 28, with insertions starting right at the
3' boundary of the first exon, mostly overexpress Pvt1 with
a few exceptions (tumors 13, 17, and 19). We have
noticed that the direction of transcription of the provi-
ruses in tumors 13 and 19 is opposite of all the others in
that group (see above for discussion of provirus transcrip-
tional orientation). Tumors 1 through 9, with insertions
located 5' to exon 1a, express Pvt1 at levels similar to the
control tumors (the control tumors are not listed in Table
1). They possibly overexpress transcripts starting with
exon 1b (Fig. 5), although we have not tested this assump-
tion.
Because transcript AK030859 seems to represent a (less
frequent) alternative splice product of the putative nuclear
transcript, we also performed qPCR analyses with a
primer set covering the 3' end of AK030859 (see right
boxed area in Fig. 3). In these analyses, tumors with inser-
tions at the Pvt1 locus on average expressed more
AK030859 sequences than the control tumors, (Fig. 4B)
(the control tumors are not listed in Table 1).
Most T lymphomas express Myc, regardless of the location
of retroviral integration sites
It is possible that the common integration site at the Pvt1
locus is not actually due to selection for tumorigenesis via
Pvt1, but to preferred (yet unknown) integration
sequences at this locus. In this view, the increased Pvt1
expression would be of no biological consequence, but
the insertions actually would increase Myc expression
directly. We thus investigated Myc expression in tumors
with insertions at the Myc and Pvt1 locus, respectively, and
compared them to tumors without insertions at either of
these loci; and to normal spleen cells or thymocytes from
mock infected (i. e., no virus) mice. Clearly, the normal
cell controls expressed less Myc than the tumors (Fig. 4C).
But by and large, there was not much difference in Myc
expression among the tumors, whether they had an inser-
tion into the Myc locus, the Pvt1 locus, or no such inser-
tion (Fig. 4C). Thus the SL3-3 induced T lymphomas
generally have elevated Myc expression, no matter by
which insertion that is accomplished, and there is no
obvious correlation between location of insert into the
Pvt1 locus and Myc expression.
Retrovirology 2008, 5:4 />Page 5 of 14
(page number not for citation purposes)
Higher magnification of the (A) 5' flanking (upstream of exon 1), and (B) 3' flanking region of MycFigure 2
Higher magnification of the (A) 5' flanking (upstream of exon 1), and (B) 3' flanking region of Myc. The handle bars in green
represent the retroviral insertions; arrows in the line within the bars denote direction of provirus transcription. Proviruses
boxed in red are in the same orientation as the Myc gene (from left to right), opposite from the rest. Proviruses are in the
same orientation as the Myc gene.
A
B
Retrovirology 2008, 5:4 />Page 6 of 14
(page number not for citation purposes)
Higher magnification of the area around exon 1 of Pvt1, with a main cluster of 78 integrationsFigure 3
Higher magnification of the area around exon 1 of Pvt1, with a main cluster of 78 integrations. Tumors assayed by quantitative
PCR (as shown in Figs. 4A to C) are numbered and noted in black text. The locations of the Taqman probes for measuring Pvt1
transcript levels are indicated by the red boxes on mRNA AK030859.
Retrovirology 2008, 5:4 />Page 7 of 14
(page number not for citation purposes)
It is surprising that although only 6% of the T lymphomas
have insertions directly into the Myc locus, almost all T
lymphomas overexpress Myc as compared to normal
splenocytes and thymocytes, whether there are insertions
into the Myc locus, Pvt1 locus, or into an unknown site.
This fact could be taken as an indication that retroviral
integrations are capricious and not always the driving
force of tumorigenesis. However, we interpret these data
to mean that there may be a requirement for MLV induced
T lymphomas in BALB/c mice to overexpress Myc, regard-
less of how this is achieved.
Identity and expression of miRNAs encoded within the
Pvt1 region
Although at the time of manuscript preparation no miR-
NAs were listed in the miRNA registry of the The Well-
come Trust Sanger Institute [31,32] that map to the Pvt1
locus, the expressed sequence tag pattern indicated the
possibility that Pvt1 does encode miRNAs. Indeed, using
previously described algorithms that use sequence conser-
vation of putative seed sequences and secondary struc-
tural properties of the putative miRNA hairpin structures,
Pvt1-based miRNA candidates in human, chimpanzee,
canine, mouse and rat have been identified [28], and con-
firmed experimentally in human and mouse [28]. The
human miRs have recently been given designations by the
Sanger miRBase, and we have adopted the analogous
nomenclature for the mouse miRs. Fig. 5 shows the
genomic sequences of mouse Pvt1 associated miRNAs and
their flanking sequences in mouse; the miRNAs are called
mmu-mir-1204, mmu-mir-1205 mmu-mir-1206, mmu-mir-
1207-5p, mmu-mir-1207-3p, and mmu-mir-1208. Because
in the following, we are only dealing with mouse
sequences, we will omit the pre-fix "mmu." The mature
miRNA sequences are shown in red. Above the sequences,
their relative genomic locations, on chromosome 15, are
Expression of the Pvt1 and Myc transcriptsFigure 4
Expression of the Pvt1 and Myc transcripts. (A) Relative expression of exon 1 of Pvt1, as measured by quantitative PCR
with the 5' primer set depicted in Fig. 3. Tumors numbered 1 through 28 as selected in Fig. 3; control tumors contain integra-
tion sites at locations in the genome other than the Pvt1 region. (B) Relative expression of AK030859 of Pvt1, as measured
with the 3' primer set depicted in Fig. 3. (C) Relative expression of exon 2/3 junction of Myc, as measured by quantitative PCR.
Tumor controls, tumors with insertions at sites other than the Myc or Pvt1 locus; normal controls, spleen and thymus cells
from mockinjected (no virus) animals.
A B
C
Retrovirology 2008, 5:4 />Page 8 of 14
(page number not for citation purposes)
shown. With mir-1204 closest to the Myc locus, at a dis-
tance of approximately 50 kb, and miR-1208 furthest away
(305 kb), the pvt-1 primary RNA, if a single transcript,
spans at least 255 kb. The exact genomic locations of the
Pvt1-encoded miRNA sequences are given in Table 2.
To determine if the retroviral integrations altered expres-
sion of these Pvt1 associated miRNAs, we measured the
expression of the mature species of the five miRNAs by
qRT-PCR using a stem-loop RT primer specific for each
miRNA [24,33], in tumors with and without Pvt1 inser-
tions (Table 3). For standardization, we compared them
to known concentrations of synthesized miRNAs of the
relevant sequence. While we could detect a signal for miR-
1206 only in one tumor, we did find expression of miR-
1204, miR-1205, miR-1207-5p, miR-1207-3p and miR-
1208, albeit at quite different levels. On average, mir-1204
was most pronounced as it was expressed nearly four
times more in tumors with Pvt1 inserts than in the control
tumors (Table 3; Δμ 0.05) – irrespective of the site of ret-
roviral integration within the Pvt1 locus. Because thymo-
cytes and spleen cells represent a mixture of many cells,
one cannot directly compare these cells with the tumor
cells. Nevertheless, we note that the expression level in the
tumors with Pvt1 integrations was not significantly differ-
ent from thymocytes and non-stimulated spleen cells. It
therefore seems as if this miRNA is required for cell sur-
vival. The relatively modest overexpression in tumors with
insertions into the Pvt1 locus may be a consequence of the
retroviral enhancer, but the tumorigenicity of the provirus
may be mediated by the persistence of miRNA expression
rather than by its overexpression.
Although miR-1205 and miR-1208 gave clear signals, the
threshold was only reached after 40 cycles, making the sig-
nificance of these miRNAs in tumorigenesis less clear.
However, in three tumors (#31, #32, #34) with integra-
tions close to its genomic position, miR-1205 is expressed
more than in other tumors; and the expression level of
miR-1205 in thymus (34 cycles to reach threshold; Table
3) makes it likely that miR-1205 plays a role in normal cell
differentiation. In most of the tumors, we did not find
Schematic representation of the genomic locations of the mouse miRNAs encoded by the Pvt1 locusFigure 5
Schematic representation of the genomic locations of the mouse miRNAs encoded by the Pvt1 locus. Numbers
above the red triangles, insertion sites of the tumors tested for miRNA expression; hairpins, location of miRNAs; bars in red
below the scale, retroviral integration clusters reported in this study. Below the schematic, genomic sequence of miRNAs and
their flanking sequences. The mature miRNA sequences are shown in red.
miR-1204
UCGUGGUGGCCUGCUCUCAGUGCUUGGAUGUGUGCUAGUUACAUCUC GGAGGUGAGGAU GUGCCUUACGGU
miR-1205
GAG GGCCUCUGCAGGACUGGCUUUGAGGUACUUCCUUCCUGUCAG CCCACUUCUGGAGUCUU U
miR-1206
AGUAUUCACUUGGGUGUUUAAGUUCUCCCAGUAGUUGUUUGCAAAGUGGCAAAC
miR-1207
CCUGGGCUGGCACGGUGGGUGGUGGGAAGGGCUUGAUGCCUAGGAGTGGACAGCUGAUGCU-
GTTGCAGGCAUCAGCUGGCCUUCAUCUCUUAUGACAACCAGGCCUGC
miR-1208
CAUGAACAAAUCACUGUUCAGACAGGCUGGGUCAGAUCCUUCUGGCCA UCUGAUC AUC U AAUG
Retrovirology 2008, 5:4 />Page 9 of 14
(page number not for citation purposes)
miR-1206 expression; although precursor RNA was
increased in the mouse myeloma MOPC104E [28], we did
not find the mature miRNA expressed (not shown). In
fact, there was also no expression in thymocytes and
spleen cells, but tumor 16 gave a clear and reproducible
signal. Since this tumor does not differ in its integration
site or proviral transcriptional orientation from other
tumors with insertions in this region, we think that the
miR-1206 expression is not mediated by the provirus.
Rather it may be the effect of another mutational event,
which in myelomas is more frequent. The level of mmu-
miR-1207-5p was relatively low in thymus; but the levels
of miR-1207-5p and miR-1207-3p in tumors with and
without integrations into the Pvt1 locus did not differ
much, and thus we cannot correlate expression of these
miRs with an oncogenic event. In all the tumors, it is pos-
sible that the other allele (with no proviral integration)
contributes to the miRNA levels, which may mask differ-
ences.
Overall we can conclude that except perhaps for miR-
1206, the other Pvt1 encoded miRNAs are expressed in T-
lymphocytes. However, we have not yet performed a
detailed analysis of the consequences of the various provi-
ral integrations sites. We can assume that the exon 1 over-
expressing tumors end their transcripts with the retroviral
termination site and poly A tail, which would exclude all
the downstream miRNAs. However, the 3' retroviral pro-
moter may also restart a transcript, as has been discussed
for integrations into the Notch1 locus [34]. An indication
for this is the fact that the qPCR primers covering the the
3' end of the intron-less transcript AK030859, also meas-
ured increased expression levels in tumors with insertions
between the DNA segments of probe sets 1 and 2. At any
rate, we feel justified in concluding that except perhaps for
miR-1208, all other Pvt1 encoded miRNAs do exist, and
that it is likely that murine mir-1204 is oncogenic in T
lymphomas when constitutively expressed.
Co-mutation analysis
It is well established that tumorigenesis is the result of
accumulating several cooperating mutations that drive
relentless proliferation and aid in metastases. Co-muta-
tion analyses, where one oncogenic event is fixed by
means of a transgene in the mouse to be infected with ret-
rovirus, were very successful in identifying cooperating
oncogenes, for example with Myc [14], or with p27Kip1
loss [19]. Without fixing any event by a transgene, viral
insertional mutagenesis, though perhaps not providing all
the mutations necessary for a full-blown tumor, follows
the multistep scenario of tumorigenesis. Although in gen-
eral the superinfection barrier largely prevents multiple
proviral integrations within the same cell, re-infection
does happen over time. Because it is a rare event, such cells
are selected over the others only when these integrations
Table 1: Integration sites of tumors assayed for Pvt1 exon 1
transcript, and for Pvt1-encoded miRNA expression
# Tumor Location Orientation
1 593S chr15:61860693 T+G+
2 1919S chr15:61866476 T+G+
3 194S chr15:61866608 T+G+
4 1139S chr15:61866868 T+G+
5 1963S chr15:61867056 T+G+
6 3404S chr15:61867131 T+G+
7 1744S chr15:61867205 T+G+
8 244S chr15:61867333 T+G+
9 560S chr15:61867464 T+G+
10 1052S chr15:61867915 G+T+
11 672S chr15:61868051 G+T+
12 1813S chr15:61868173 G+T+
13 955S chr15:61868438 G+T-
14 763S chr15:61868296 G+T+
15 1754S chr15:61868379 G+T+
16 1182S chr15:61868500 G+T+
17 1572S chr15:61868585 G+T+
18 1890S chr15:61868694 G+T+
19 1888S chr15:61869059 G+T-
20 1190S chr15:61868969 G+T+
21 504S chr15:61869211 G+T+
22 2105S chr15:61869357 G+T+
23 1910S chr15:61870240 G+T+
24 549S chr15:61874317 G+T+
25 3005S chr15:61884560 G+T+
26 1437S chr15:61893983 G+T+
27 455S chr15:61909406 G+T+
28 2262S chr15:61922370 G+T+
31 2062T chr15:61988152 G+T+
32 1784S chr15:61995200 G+T+
33 1551S chr15:61996855 G+T+
34 3269T chr15:61997744 G+T+
35 1309S chr15:61998706 G+T+
36 1719S chr15:62041370 G+T-
37 652T chr15:62041573 G+T+
38 3155S chr15:62042340 G+T+
39 133S chr15:62043246 G+T+
40 1820S chr15:62062642 G+T+
41 1187S chr15:62285362 G+T+
42 1938T chr15:62286594 G+T+
43 674S chr15:62287322 G+T+
44 1907S chr15:62288987 G+T+
45 1717T chr15:62290852 G+T+
46 1959S chr15:62524605 G+T+
C2 1855S no Pvt1 integration site
C3 3252T no Pvt1 integration site
C4 3413T no Pvt1 integration site
C5 3421S no Pvt1 integration site
C6 1463S no Pvt1 integration site
C7 1967S no Pvt1 integration site
C8 14845S no Pvt1 integration site
C9 1278S no Pvt1 integration site
C10 1065S no Pvt1 integration site
Transcript: AK030859 chr15:61867667–61870735 G+
Sites as defined by mm8 version of genome. Orientation, either "+"
or "-", of the proviral insert (tag, denoted as T) relative to the
direction of the genome display, and to the Pvt1 transcript ("gene",
denoted as G, here always G+).
Retrovirology 2008, 5:4 />Page 10 of 14
(page number not for citation purposes)
also give a growth advantage. As a consequence, in gen-
eral, most viral insertions ("co-mutations") in a single
tumor are thought to be causative in its formation. With
the caveats of potential passenger mutations and potential
oligoclonality of tumors, co-mutation analysis may be a
powerful way to find cooperating signaling pathways in
tumorigenesis. For this analysis, the following two rules
can be stated: (i) genes that are co-mutated in a single can-
Table 2: Genomic locations of the mouse Pvt1-encoded miRNA sequences on chromosome 15, as given by the mm8 and mm9
genome versions.
miR-1204 miR-1205 miR-1206 miR-1207-5p miR-1207-3p miR-1208
mm8 61,869, 066 61,988,887 62,017,747 62,053,091 62,053,155 62,130,913
61,869, 086 61,988,906 62,017,766 62,053,114 62,053,172 62,130,931
mm9 61,870, 955 61,990,776 62,019,636 62,054,980 62,055,044 62,132,802
61,870, 975 61,990,795 62,019,655 62,055,003 62,055,061 62,132,820
Table 3: QPCR measuring mmu-miRNAs encoded by Pvt1.
Tumor # miR-1204 miR-1205 miR-1206 miR-1207-5p miR-1207-3p miR-1208
14 34.54 44.58 BT 29.03 ND 38.96
16 36.35 44.34 36.09 30.39 ND 39.42
20 34.06 42.24 BT 27.92 ND 38.78
21 34.6 39.73 BT 28.39 ND 39.63
22 33.06 41.13 BT 29.6 ND 37.3
23 35.46 42.13 BT 30.07 ND 39.06
31 35.2 39.56 BT 28.43 34.26 38.57
32 35.87 38.65 BT 30.07 34.93 38.9
34 33.3 38.59 BT 28.86 35.3 41.44
35 33.72 42.19 BT 29.91 34.3 ND
36 35.83 40.16 BT 30.85 35.47 39.5
39 33.16 42.44 BT 30.89 35.52 41.3
40 35.05 38.94 BT 31.14 40.16 45.52
41 34.95 43.62 BT 31.15 37.2 40.39
42 34.2 41.75 BT 29.44 35.64 40
43 33.92 40.13 BT 29.45 35.91 40.73
44 36.9 39.98 BT 31.34 36.45 42.1
45 33.36 41.07 BT 27.25 34.72 38.81
46 35.04 42.21 BT 28.93 36.1 41.29
Average ± STD 34.66 ± 1.12 41.23 ± 1.82 ND 29.64 ± 1.17 35.84 ± 1.54 40.09 ± 1.83
C2 38.02 42.23 BT 30.28 36.93 40.53
C3 33.53 41.93 BT 26.98 34.6 39.36
C4 36.19 41.1 BT 29.3 35.45 39.62
C5 36.03 45.22 BT 30.23 ND 39.23
C6.2 ND 37.35 ND ND 40.31 40.36
C6.3 36.9 42.82 BT 31.77 38.64 41.73
C7 37.08 BT BT 32.11 ND 41.11
C8 36.51 43.14 BT 30.89 ND 39.55
C9 37.15 44.73 BT 30.86 ND 40.32
C 10 36.8 45.2 BT 30.4 ND 39.26
Average ± STD 36.47 ± 1.25 42.64 ± 2.47 BT 30.31 ± 1.51 37.19 ± 2.33 40.11 ± 0.85
thymus 35.01 34.41 BT 33.06 38.17 43.4
spleen 34.05 40.3 BT 31.03 36.4 41.97
Reject H0 yes no no no no
Numbers in the first column correspond to the tumour numbers in the Table 1; other columns represent the cycle numbers needed to reach a
predetermined threshold. BT, below threshold; ND, not done; STD, standard deviation. A cycle number of 30 corresponds to approximately 3000
molecules per cell.
Retrovirology 2008, 5:4 />Page 11 of 14
(page number not for citation purposes)
cer cell represent different pathways that cooperate during
carcinogenesis; and (ii) genes within the same pathway
are never co-mutated. These rules assume "linear," non-
branched pathways, which is a gross oversimplification.
They also assume that it does not help to turn on a path-
way (twice) by two integrations rather than one, but, of
course, increased signal strength may indeed help tumor-
igenesis. For example, an obvious exception is Notch1, for
which two mutations have been shown to lead to more
aggressive growth than just one [35] – a fact that is
reflected by our finding of three double mutants (Fig. 6;
and unpublished), with mutations in the same two
domains that are also co-mutated in patients. Neverthe-
less, if in a large sample set, one never finds two genes co-
mutated, it seems fairly safe to assume that they are in the
same pathway.
Fig. 6 shows a matrix for co-mutation analysis, here focus-
ing on Pvt1. The numbers (color blue, underlined) repre-
sent the frequency of tagged oncogenes/tumor suppressor
genes detected in the T lymphoma screen, in the order of
their incidence, horizontally and vertically. The numbers
in the boxes at the intersections (color black) indicate the
number of tumors the cancer genes were found in the
same tumor. In this matrix, Pvt1 is represented by number
3, i.e., it is the third most frequent cancer locus in mouse
T lymphomas mutated by MLV. The other high frequency
tagged genes (1, 2, 4, 5, 6 and 7) are Evi5, Notch1,
Rasgrp1, Ahi1, Gfi1 and Myc, respectively. Because they
are found together with Pvt1 in a number of tumors, these
genes are all co-mutations, except for Myc – there are no
tumors with insertions to both Myc and Pvt1 loci. By the
logic above, this apparently places Pvt1 and Myc into the
same pathway, although from this analysis it cannot be
determined which one of the genes is upstream. Another
indication for the two genes sharing a pathway comes
from the fact that they have the same co-mutations (Fig.
6); and that they both do not co-mutate with gene 21,
which thus ought to be in the same pathway as well.
With 11% of the 2199 T lymphomas studied having inser-
tions within it, the pathway pvt is part of what seems to be
one of the most important regulators of T lymphomagen-
esis in the BALB/c mouse strain, and, by extension, per-
haps also in Burkitt's lymphoma and in mouse
plasmacytomas, as these are clearly driven by the translo-
cations involving the Myc and Pvt1 loci. If so, it seems
peculiar that in our screen with Akv, which induces B cell
lymphomas in NMRI mice, only one out of 1798 tags
were in the Myc locus, and none in the Pvt1 locus. Simi-
larly, among the resulting 24 tumors analyzed by Lov-
mand et al. [15], only one tumor, containing an Akv
variant, harbored a clonal proviral integration in the c-
Myc locus. Because most cells, including B cells, express
the Akv receptor, the reason for this may lie in the differ-
entiation stage of the infected cell.
Conclusion
Part of the complexity in determining the functional sig-
nificance of the Pvt1 locus stems from the fact that Pvt1 is
closely linked to the Myc locus. Translocations directly
into the Myc locus change expression levels of Myc, and
thus easily explain their contribution to oncogenesis; but
the breakpoints of variant translocations into the Pvt1
Matrix for co-mutation analysisFigure 6
Matrix for co-mutation analysis. Only a partial view is given. The numbers (color blue, underlined) represent the onco-
genes/tumor suppressor genes detected in the T lymphoma screen, in the order of their incidence, horizontally and vertically.
The numbers in the boxes at the intersections (color black) indicate the number of tumors the cancer genes were found in the
same tumor.
Evi5
Notch1
Pvt 1
Rasgrp1
Ahi1
Gfi1
Myc
Retrovirology 2008, 5:4 />Page 12 of 14
(page number not for citation purposes)
locus extend up to 400 kb downstream of Myc, and they
also have been thought to cause overexpression of Myc as
well. Because the Pvt1 transcript encodes no protein, the
effect on Myc was thought to be direct, and, therefore,
long range [4]. On the other hand, the multiple myeloma
cases with translocations in the PVT1 locus without
immunoglobulin gene translocation would argue for this
locus to be oncogenic in its own right, as do the retroviral
integrations into this locus.
In this paper, we present a large number of tumors with
retroviral integrations into the Pvt1 locus, which thus can
be regarded as oncogenic, particularly as these integration
events are associated with overexpression of Pvt1 tran-
scripts. We also confirm that the Pvt1 locus encodes miR-
NAs, and that retroviral insertion can lead to altered
expression of at least one of these miRNAs. From the co-
mutation analysis, we also conclude that Pvt1 and Myc are
likely in the same pathway; this may mean that any of the
miRNAs directly determine Myc transcript levels by
siRNA-type mediated degradation; or, because there is no
clear binding site for any of these miRNAs in the 3'UTR of
Myc, more likely by regulating the translation of upstream
factors that activate Myc. Consistent with this hypothesis,
over-expression of mir-1204 in mouse pre-B cells, but not
in pro-B cells, appears to increase Myc expression [28] –
apparently in a cell type and/or stage specific fashion.
Conversely, Myc may also regulate the levels of Pvt1
encoded miRNAs. Which of these alternatives is the case
may be decided once the targets of the miRNAs are
known.
Methods
Retroviral induction of tumors of mice
BOSC23 retroviral packaging cells were transfected with
plasmids encoding the complete SL3-3 provirus. Viral par-
ticles from culture supernatant were injected intraperito-
neally into newborn (<3 days) BALB/c mice. The fathers of
the injected mice were also mutagenized by ethyl-nitroso-
urea as part of another study [36]. Mice were monitored
everyday for general sickness as well as tumor develop-
ment. When sickness or tumors of defined size were dis-
covered, mice were euthanized and tumors of the spleen
and thymus were removed and frozen at -80°C.
Identification of provirus integration sites
The genomic locations of the proviral integrations were
determined using the splinkerette-based PCR method
[37]. This method recovers genomic DNA directly flank-
ing the 5' LTR of the integrated provirus. Genomic DNA
was isolated from tumors using the DNeasy Tissue kit
(Qiagen) and digested using restriction enzymes BstYI or
NspI. A double-stranded splinkerette adapter molecule
[38] containing the appropriate restriction site was ligated
to the digested genomic DNA using the Quick Ligation kit
(New England Biolabs). These ligation products were then
digested with EcoRV to prevent subsequent amplification
of internal viral fragments. The resulting mixture was puri-
fied using QIAquick PCR purification kits (Qiagen), and
subject to three rounds of PCR using nested PCR primers
that had homology to the adapter DNA and to the 5' LTR
sequence of the SL3-3 virus. After resolving the PCR prod-
ucts by gel electrophoresis, the desired bands were puri-
fied using QIAquick Gel Extraction kits (Qiagen) and
subject to standard DNA sequencing.
Quantitative PCR of primary RNA transcripts
Total RNA was extracted from frozen mouse spleen and
thymus tumor samples using the RNeasy Mini Kit (Qia-
gen). All RNA samples were treated with rDNase
(Ambion) prior to reverse transcription. 500 ng RNA from
each tumor sample was reverse transcribed with random
hexamers using the SuperScript First-Strand Synthesis Sys-
tem III (Invitrogen). qPCR was conducted on the Strata-
gene MX3000P using Brilliant SYBR Green qPCR Master
Mix (Stratagene). SYBR qPCR primers were designed using
Beacon Designer 5.0 from Premier Biosoft and ordered
from Integrated DNA Technologies. Beta-actin (ACTB)
served as an endogenous control gene for all SYBR qPCR
runs. qPCR primers were as follows: ACTB: 5'-TTC-
CAGCCTTCCTTCTTG-3', 5'-GGAGCCAGAGCAGTAATC-
3'; Pvt1-exon1: 5'-(GAGCACAT)GGACCCACTG-3' (it
contains 8 bp of genomic sequence before the start of
AK090048 exon1, genomic part in parenthesis); 5'-GCT-
GCCAACATCCTTTCC-3'; AK030859 (3'end): 5'-
GGCACAAGAGAACCAAGTCC-3', 5'-CGCTTATCCTCCT-
GCTTCAAC-3'; and Myc-ExJ2-3: 5'-GACACCGCCCAC-
CACCAG-3', 5'-GCCCGACTCCGACCTCTTG-3'.
The qPCR reaction mixture contained 150 nM (final con-
centration) of each primer and the appropriate dilution of
cDNA for each target studied in a final qPCR reaction vol-
ume of 25 μl. PCR cycling was as follows: 95°C 10 min;
40 cycles of 95°C 30 sec, Ta (annealing) of 55 to 60°C 60
sec, 72°C 30–45 seconds; followed by a denaturation
cycle of 95°C 60 sec, 55°C 30 sec, 95°C 30 sec. Tumor
samples containing no integration sites in the region of
interest were used as control tumors. Relative expression
values (2
-ΔΔCt
) were calculated using control tumor 1 as a
calibrating sample. All relative expression values were
then normalized to set the average of the tumor controls
to a value of 1 for each target.
Quantitative PCR of miRNAs
MiRNAs and low molecular weight RNAs were isolated
from frozen mouse tumor tissue using the Purelink
miRNA Isolation Kit (Invitrogen). The mature species of
the miRNAs were measured by RT-qPCR using a stem-
loop RT primer specific for each miRNA [33] in the cells
listed, in triplicates. Accordingly, 50 ng of each tumor
Retrovirology 2008, 5:4 />Page 13 of 14
(page number not for citation purposes)
miRNA preparation was reverse transcribed with the
SuperScript III First-Strand Synthesis System for RT-PCR
using the following stem loop RT primers (50 nM final
concentration) 5'-GTCGTATCCAGTGCAGGGTCCGAGG-
TATTCGCACTGGATACGACAGCACT-3'(mmu-mir-
1204), 5'-GTCGTATCCAGTGCAGGGTCCGAGGTATTCG
CACTGGATACGACCTCAAA-3'(mmu-mir-1205), 5'-GTC
GTATCCAGTGCAGGGTCCGAGGTATTCGCACTGGATA
CGACACTTAA-3' (mmu-mir-1206), 5'-GTCGTATCCAGT
GCAGGGTCCGAGGTATTCGCACTGGATACGACCCCTT
C-3'(mmu-mir-1207-5p), 5'-GTCGTATCCAGTGCAGGG
TCCGAGGTATTCGCACTGGATACGACGAGATG-
3'(mmu-mir-1207-3p) and 5'-GTCGTATCCAGTGCAGG
GTCCGAGGTATTCGCACTGGATACGACCCAGCC-
3'(mmu-mir-1208). The reverse transcription reactions
were diluted 1:5 and 5 μl of these dilutions were used in
the 25 μl qPCR reactions. The annealing step was 50°C for
60s. The qPCR probes and primers were as follows: mmu-
mir-1204: 5'-GCGGTGGTGGCCTGCTCT-3', 5'-GTGCAG-
GGTCCGAGGT-3', 5'-[56-FAM]-CACTGGATACGACAGCAC
TG-[36-TAMSp]-3'; mmu-mir-1205: 5'-GGCGTCTGCAGGA
CTGG-3', 5'-GTGCAGGGTCCGAGGT-3', 5'-[56-FAM]-CACT-
GGATACGACCTCAAAG-[36-TAMSp]-3', mmu-mir-1206: 5'-
TTGCGGTATTCACTTGGG-3', 5'-GTGCAGGGTCCGAGGT-
3', 5'-[56-FAM]-CACTGGATACGACACTTAAACA-[36-TAMS
p]-3'; mmu-mir-1207-5p: 5'-TGCTGGCACGGTGGGTG-3',
5'-GTGCAGGGTCCGAGGT-3', 5'-[56-FAM]-CACTGGATAC-
GACCCCTTCC-[36-TAMSp]-3'; mmu-mir-1207-3p: 5'-TGTC
TGTCAGCTGGCCT-3', 5'-GTGCAGGGTCCGAGGT-3', 5'-[56
-FAM]-CACTGGATACGACGAGATGA-[36-TAMSp]-3'; mmu-
mir-1208: 5'-CCGGTCACTGTTCAGAC-3', 5'-GTGCAGGGTC
CGAGGT-3', 5' [56-FAM]-CACTGGATACGACCCAGCCT-[36
-TAMSp]-3'.
Synthetic RNA oligos (IDT) were used to generate a cali-
bration curve for each miRNA; for mmu-mir-1204, 5'-UG
GUGGCCUGCUCUCAGUGCU-3'; mmu-mir-1205, 5'-U
CUGCAGGACUGGCUUUGAG-3'; mmu-mir-1206, 5'-U
AUUCACUUGGGUGUUUAAGU-3'; mmu-mir-1207-5p,
5'-UGGCACGGUGGGUGGGAAGGG-3'; mmu-mir-1207
-3p, 5'-UCAGCUGGCCUUCAUCUC3'-3'; and mmu-mir-
1208, 5'-UCACUGUUCAGACAGGCUGG-3'. Amplifica-
tion efficiencies of the calibration curves for the 6 mmu-
mirs were at least 70%. Concentrations of the mature spe-
cies were calculated using the calibration curves and then
normalized by the average of the control tumors, to calcu-
late relative expression levels.
Authors' contributions
GBB designed and carried out the quantitative PCR exper-
iments for the miRNAs; AML designed and carried out the
quantitative PCR experiments for the primary RNA tran-
scripts and helped in the drafting of the manuscript; KH
and NJC previously identified the mouse miRNA-PVT
sequences, and KH was intimately involved in discussions
about the ongoing work and helped with the manuscript;
BBW carried out the tag recovery and identification; BBW
and MW planned and directed the execution of the retro-
viral screen and the design of the study, and MW wrote the
manuscript.
Acknowledgements
Supported by NIH grant R01CA100266 and by the Intramural Research
Program of the National Cancer Institute, NIH, Center for Cancer
Research. We thank Gabor Bartha, Lauri Li, Namitha Channa for help with
tag recovery and identification; and Finn Pedersen for advice and discussion.
References
1. Webb E, Adams JM, Cory S: Variant (6; 15) translocation in a
murine plasmacytoma occurs near an immunoglobulin
kappa gene but far from the myc oncogene. Nature 1984,
312(5996):777-779.
2. Shtivelman E, Henglein B, Groitl P, Lipp M, Bishop JM: Identification
of a human transcription unit affected by the variant chro-
mosomal translocations 2;8 and 8;22 of Burkitt lymphoma.
Proc Natl Acad Sci USA 1989, 86(9):3257-3260.
3. Huppi K, Siwarski D, Skurla R, Klinman D, Mushinski JF: Pvt-1 tran-
scripts are found in normal tissues and are altered by recip-
rocal(6;15) translocations in mouse plasmacytomas. Proc Natl
Acad Sci USA 1990, 87(18):6964-6968.
4. Shtivelman E, Bishop JM: Effects of translocations on transcrip-
tion from PVT. Mol Cell Biol 1990, 10(4):1835-1839.
5. Huppi K, Siwarski D: Chimeric transcripts with an open reading
frame are generated as a result of translocation to the Pvt-1
region in mouse B-cell tumors. Int J Cancer 1994, 59(6):848-851.
6. Cory S, Graham M, Webb E, Corcoran L, Adams JM: Variant (6;15)
translocations in murine plasmacytomas involve a chromo-
some 15 locus at least 72 kb from the c-myc oncogene. Embo
J 1985, 4(3):675-681.
7. Palumbo AP, Boccadoro M, Battaglio S, Corradini P, Tsichlis PN,
Huebner K, Pileri A, Croce CM: Human homologue of Moloney
leukemia virus integration-4 locus (MLVI-4), located 20 kilo-
bases 3' of the myc gene, is rearranged in multiple myelo-
mas. Cancer Res 1990, 50(20):6478-6482.
8. Graham M, Adams JM, Cory S: Murine T lymphomas with retro-
viral inserts in the chromosomal 15 locus for plasmacytoma
variant translocations. Nature 1985, 314(6013):740-743.
9. Lemay G, Jolicoeur P: Rearrangement of a DNA sequence
homologous to a cell-virus junction fragment in several
Moloney murine leukemia virus-induced rat thymomas. Proc
Natl Acad Sci USA 1984, 81(1):38-42.
10. Villeneuve L, Rassart E, Jolicoeur P, Graham M, Adams JM: Proviral
integration site Mis-1 in rat thymomas corresponds to the
pvt-1 translocation breakpoint in murine plasmacytomas.
Mol Cell Biol 1986, 6(5):1834-1837.
11. Hayward WS, Neel BG, Astrin SM: Activation of a cellular onc
gene by promoter insertion in ALV-induced lymphoid leuko-
sis. Nature 1981, 290(5806):475-480.
12. Nusse R, Varmus HE: Many tumors induced by the mouse
mammary tumor virus contain a provirus integrated in the
same region of the host genome. Cell 1982, 31(1):99-109.
13. Nusse R, van Ooyen A, Cox D, Fung YK, Varmus H: Mode of pro-
viral activation of a putative mammary oncogene (int-1) on
mouse chromosome 15. Nature 1984, 307(5947):131-136.
14. van Lohuizen M, Verbeek S, Scheijen B, Wientjens E, van der Gulden
H, Berns A: Identification of cooperating oncogenes in E mu-
myc transgenic mice by provirus tagging. Cell 1991,
65(5):737-752.
15. Lovmand J, Sorensen AB, Schmidt J, Ostergaard M, Luz A, Pedersen
FS: B-Cell lymphoma induction by akv murine leukemia
viruses harboring one or both copies of the tandem repeat in
the U3 enhancer. J Virol 1998, 72(7):5745-5756.
16. Li J, Shen H, Himmel KL, Dupuy AJ, Largaespada DA, Nakamura T,
Shaughnessy JD Jr, Jenkins NA, Copeland NG: Leukaemia disease
genes: large-scale cloning and pathway predictions. Nat Genet
1999, 23(3):348-353.
Publish with BioMed Central and every
scientist can read your work free of charge
"BioMed Central will be the most significant development for
disseminating the results of biomedical research in our lifetime."
Sir Paul Nurse, Cancer Research UK
Your research papers will be:
available free of charge to the entire biomedical community
peer reviewed and published immediately upon acceptance
cited in PubMed and archived on PubMed Central
yours — you keep the copyright
Submit your manuscript here:
/>BioMedcentral
Retrovirology 2008, 5:4 />Page 14 of 14
(page number not for citation purposes)
17. Suzuki T, Shen H, Akagi K, Morse HC, Malley JD, Naiman DQ, Jenkins
NA, Copeland NG: New genes involved in cancer identified by
retroviral tagging. Nat Genet 2002, 32(1):166-174.
18. Lund AH, Turner G, Trubetskoy A, Verhoeven E, Wientjens E, Huls-
man D, Russell R, DePinho RA, Lenz J, van Lohuizen M: Genome-
wide retroviral insertional tagging of genes involved in can-
cer in Cdkn2a-deficient mice. Nat Genet 2002, 32(1):160-165.
19. Hwang HC, Martins CP, Bronkhorst Y, Randel E, Berns A, Fero M,
Clurman BE: Identification of oncogenes collaborating with
p27Kip1 loss by insertional mutagenesis and high-through-
put insertion site analysis. Proc Natl Acad Sci USA 2002,
99(17):11293-11298.
20. Mikkers H, Allen J, Knipscheer P, Romeijn L, Hart A, Vink E, Berns A,
Romeyn L: High-throughput retroviral tagging to identify
components of specific signaling pathways in cancer. Nat
Genet 2002, 32(1):153-159.
21. Uren AG, Kool J, Berns A, van Lohuizen M: Retroviral insertional
mutagenesis: past, present and future. Oncogene 2005,
24(52):7656-7672.
22. Clurman BE, Hayward WS: Multiple proto-oncogene activations
in avian leukosis virus-induced lymphomas: evidence for
stage-specific events. Mol Cell Biol 1989, 9(6):2657-2664.
23. Wang CL, Wang BB, Bartha G, Li L, Channa N, Klinger M, Killeen N,
Wabl M: Activation of an oncogenic microRNA cistron by
provirus integration. Proc Natl Acad Sci USA 2006,
103(49):18680-18684.
24. Lum AM, Wang BB, Li L, Channa N, Bartha G, Wabl M: Retroviral
activation of the mir-106a microRNA cistron in T lym-
phoma. Retrovirology 2007, 4:5.
25. Eis PS, Tam W, Sun L, Chadburn A, Li Z, Gomez MF, Lund E, Dahlberg
JE: Accumulation of miR-155 and BIC RNA in human B cell
lymphomas. Proc Natl Acad Sci USA 2005, 102(10):3627-3632.
26. Scaria V, Jadhav V: microRNAs in viral oncogenesis.
Retrovirology
2007, 4(1):82.
27. Lenz J, Crowther R, Klimenko S, Haseltine W: Molecular cloning
of a highly leukemogenic, ecotropic retrovirus from an AKR
mouse. J Virol 1982, 43(3):943-951.
28. Huppi K, Volfovsky N, Runfola T, Jones TL, Mackiewicz M, Martin SE,
Mushinski JF, Stephens R, Caplen NJ: The identification of micro-
RNAs in a genomically unstable region of human chromo-
some 8q24. Mol Cancer Res 2007.
29. Akagi K, Suzuki T, Stephens RM, Jenkins NA, Copeland NG:
RTCGD: retroviral tagged cancer gene database. Nucleic Acids
Res 2004:D523-527.
30. Pedersen FS, Buchhagen DL, Chen CY, Hays EF, Haseltine WA:
Characterization of virus produced by a lymphoma induced
by inoculation of AKR MCF-247 virus. J Virol 1980,
35(1):211-218.
31. Griffiths-Jones S: miRBase: the microRNA sequence database.
Methods Mol Biol 2006, 342:129-138.
32. Weber MJ: New human and mouse microRNA genes found by
homology search. Febs J 2005, 272(1):59-73.
33. Chen C, Ridzon DA, Broomer AJ, Zhou Z, Lee DH, Nguyen JT, Bar-
bisin M, Xu NL, Mahuvakar VR, Andersen MR, et al.: Real-time
quantification of microRNAs by stem-loop RT-PCR. Nucleic
Acids Res 2005, 33(20):e179.
34. Hoemann CD, Beaulieu N, Girard L, Rebai N, Jolicoeur P: Two dis-
tinct Notch1 mutant alleles are involved in the induction of
T-cell leukemia in c-myc transgenic mice. Mol Cell Biol 2000,
20(11):3831-3842.
35. Weng AP, Ferrando AA, Lee W, Morris JPt, Silverman LB, Sanchez-
Irizarry C, Blacklow SC, Look AT, Aster JC: Activating mutations
of NOTCH1 in human T cell acute lymphoblastic leukemia.
Science 2004, 306(5694):269-271.
36. Glud SZ, Sorensen AB, Andrulis M, Wang B, Kondo E, Jessen R,
Krenacs L, Stelkovics E, Wabl M, Serfling E, et al.: A tumor-suppres-
sor function for NFATc3 in T-cell lymphomagenesis by
murine leukemia virus. Blood 2005,
106(10):3546-3552.
37. Mikkers H, Allen J, Knipscheer P, Romeijn L, Hart A, Vink E, Berns A:
High-throughput retroviral tagging to identify components
of specific signaling pathways in cancer. Nat Genet 2002,
32(1):153-159.
38. Devon RS, Porteous DJ, Brookes AJ: Splinkerettes – improved
vectorettes for greater efficiency in PCR walking. Nucleic Acids
Res 1995, 23(9):1644-1645.