Báo cáo y học: "Evaluation of an ambulatory system for the quantification of cough frequency in patients with chronic obstructive pulmonary disease" ppsx
Bạn đang xem bản rút gọn của tài liệu. Xem và tải ngay bản đầy đủ của tài liệu tại đây (930.27 KB, 7 trang )
BioMed Central
Page 1 of 7
(page number not for citation purposes)
Cough
Open Access
Methodology
Evaluation of an ambulatory system for the quantification of cough
frequency in patients with chronic obstructive pulmonary disease
Michael A Coyle*
1
, Desmond B Keenan
2
, Linda S Henderson
3
,
Michael L Watkins
3
, Brett K Haumann
4
, David W Mayleben
5
and
Michael G Wilson
6
Address:
1
Physiology Program, Harvard School of Public Health, Boston, MA, USA,
2
VivoMetrics, Inc., Ventura, CA, USA,
3
GlaxoSmithKline,
Respiratory and Inflammation Centre of Excellence for Drug Discovery Research Triangle Park, NC, USA,
4
GlaxoSmithKline, Respiratory and
Inflammation Centre of Excellence for Drug Discovery Stevenage, UK,
5
Community Research, Inc., Cincinnati, OH, USA and
6
Department of
Psychiatry, Indiana University School of Medicine, Indianapolis, IN, USA
Email: Michael A Coyle* - ; Desmond B Keenan - ;
Linda S Henderson - ; Michael L Watkins - ;
Brett K Haumann - ; David W Mayleben - ;
Michael G Wilson -
* Corresponding author
Abstract
Background: To date, methods used to assess cough have been primarily subjective, and only broadly reflect
the impact of chronic cough and/or chronic cough therapies on quality of life. Objective assessment of cough has
been attempted, but early techniques were neither ambulatory nor feasible for long-term data collection. We
evaluated a novel ambulatory cardio-respiratory monitoring system with an integrated unidirectional, contact
microphone, and report here the results from a study of patients with COPD who were videotaped in a quasi-
controlled environment for 24 continuous hours while wearing the ambulatory system.
Methods: Eight patients with a documented history of COPD with ten or more years of smoking (6 women; age
57.4 ± 11.8 yrs.; percent predicted FEV
1
49.6 ± 13.7%) who complained of cough were evaluated in a clinical
research unit equipped with video and sound recording capabilities. All patients wore the LifeShirt
®
system (LS)
while undergoing simultaneous video (with sound) surveillance. Video data were visually inspected and annotated
to indicate all cough events. Raw physiologic data records were visually inspected by technicians who remained
blinded to the video data. Cough events from LS were analyzed quantitatively with a specialized software
algorithm to identify cough. The output of the software algorithm was compared to video records on a per event
basis in order to determine the validity of the LS system to detect cough in COPD patients.
Results: Video surveillance identified a total of 3,645 coughs, while LS identified 3,363 coughs during the same
period. The median cough rate per patient was 21.3 coughs·hr
-1
(Range: 10.1 cghs·hr
-1
– 59.9 cghs·hr
-1
). The
overall accuracy of the LS system was 99.0%. Overall sensitivity and specificity of LS, when compared to video
surveillance, were 0.781 and 0.996, respectively, while positive- and negative-predictive values were 0.846 and
0.994. There was very good agreement between the LS system and video (kappa = 0.807).
Conclusion: The LS system demonstrated a high level of accuracy and agreement when compared to video
surveillance for the measurement of cough in patients with COPD.
Published: 04 August 2005
Cough 2005, 1:3 doi:10.1186/1745-9974-1-3
Received: 25 April 2005
Accepted: 04 August 2005
This article is available from: />© 2005 Coyle et al; licensee BioMed Central Ltd.
This is an Open Access article distributed under the terms of the Creative Commons Attribution License ( />),
which permits unrestricted use, distribution, and reproduction in any medium, provided the original work is properly cited.
Cough 2005, 1:3 />Page 2 of 7
(page number not for citation purposes)
Background
The most frequent complaint for which patients seek
treatment from primary care physicians in the United
States is cough [1]. Type, frequency and diurnal changes of
cough may be criteria for differential diagnosis, therapeu-
tic efficacy, and a gauge for the progression of chronic dis-
ease. Historically, cough evaluation has been difficult and
of limited clinical value due to a lack of surveillance tools
to assess cough frequency completely and its impact on
health-related quality of life (HRQL).
To date, methods used to assess cough have been prima-
rily subjective, and only broadly reflect the impact of
chronic cough and/or chronic cough therapies on quality
of life [2-5]. These methods have been unable to offer sub-
stantial information related to the minimal reduction in
cough frequency necessary to achieve a significant
improvement in HQRL. Objective assessment of cough
has been attempted, but these techniques were neither
ambulatory nor feasible for long-term data collection [6-
8]. Other systems have evaluated sound to quantify cough
frequency and intensity with moderate success [9,10], but
have been limited in their effectiveness outside the labo-
ratory and requires labor intensive analysis and interpre-
tation [11-15].
We evaluated a novel ambulatory cardio-respiratory mon-
itoring system with an integrated unidirectional, contact
microphone, and report here the results from a study of
patients with COPD who were videotaped in a quasi-con-
trolled environment for 24 continuous hours while wear-
ing the ambulatory system.
Methods
Subjects
Eight subjects with chronic obstructive pulmonary disease
(COPD) who complained of cough as a prominent symp-
tom (e.g., ten or greater self reported bouts of cough per
day) were recruited for the study. Subjects were men and
women over the age of 40 who had a documented medi-
cal history of COPD and a smoking history of ≥ 10 years
with chronic productive cough. Patient characteristics can
be found in Table 1. Patients were excluded from the
study if, upon screening, (1) it was determined from
patient medical history that cough could be due to other
known causes such as gastro-esophageal reflux, asthma, or
any anatomical abnormalities of the upper respiratory
tract, and/or (2) if patients were using prescribed or over
the counter anti-tussive medications within 24-hours of
the start of the study.
The protocol was approved by an independent ethical
review board (Western IRB, 3535 7th Avenue SW, Olym-
pia, WA, USA, 98502) and all patients received a verbal
and written description of the study and gave informed
consent prior to participation. All data were collected
under the medical supervision of board certified
pulmonologists.
Instrumentation and monitoring
LifeShirt
®
System
Patients were fitted with the wearable LifeShirt
®
system
(LS, VivoMetrics, Inc., Ventura, CA, USA), which incorpo-
rates respiratory inductance plethysmography (RIP) for
the non-invasive measurement of volume and timing ven-
tilatory variables and has been described elsewhere [15-
22]. The system also incorporates a unidirectional contact
microphone, a single channel ECG, and a centrally
located, 3-axis accelerometer. Data were processed and
stored on a compact flash card that was housed within the
recorder unit. Patients were invited to wear the LS system
for a maximum of 24 hours.
Video surveillance
Patients spent the testing period in an assigned room
where the video monitoring equipment was installed.
Patients were monitored via video recorder camera (low-
lux) with unidirectional free-air microphone for the dura-
tion of the testing period. The video data stream was syn-
chronized to the LS data stream by the coordination of the
device clocks. The LS recorder has an on-board electronic
diary which creates an event time stamp in the LS software
data stream which was referenced to the video data time
display to determine the beginning of the recording
period. Patients were allowed free range of the research
facility and were permitted to watch television, use the tel-
ephone, dine, take breaks and sleep.
Data analysis and statistics
Raw physiologic data records were uploaded to a central-
ized data center and were visually inspected for quality by
technicians. 94.1% of the data were interpretable and
available for comparison to video. Specialized software
(VivoLogic
®
, VivoMetrics, Inc., Ventura, CA, USA) was
used to view the LS data and a proprietary algorithm
housed within the software was used to identify cough
Table 1: Patient characteristics. Values are means ± SD; Ht =
height; Wt = weight; BMI = Body mass index; %FEV
1
= %
predicted forced expiratory volume in one second; n = 8 (6
women)
Variable
Age (yrs) 57.4 ± 11.8
Ht (cm) 165.4 ± 7.2
Wt (kg) 76.1 ± 14.4
BMI (kg/m
2
) 27.8 ± 4.7
%FEV
1
49.6 ± 13.7
Cough 2005, 1:3 />Page 3 of 7
(page number not for citation purposes)
from the physiologic recordings. LS data were visually
inspected by two independent reviewers who remained
blinded to the video data. Each noted the time (hour,
minute and second) of each cough. These data were cap-
tured into a spreadsheet. Cough events (hour, minute,
second, millisecond) identified by the LS software were
exported into a separate spreadsheet. A practical extrac-
tion and report language (PERL) script was written to tem-
porally align the two data streams so that the output from
each device could be compared for agreement on an event
by event basis.
To summarize the validity and reliability of the ambula-
tory system to detect cough under several conditions, six
validation and agreement measures were used including,
sensitivity (SN), specificity (SP), positive predictive value
(PPV), negative predictive value (NPV), accuracy and
kappa [23] were calculated relative to video rating. The
PPV is the probability that a patient coughed, if the system
judged the respiratory event as a cough. Likewise, the NPV
is the probability that the patient did not cough, given
that the system did not judge the event as a cough. Accu-
racy is the proportion of all correct tests. The method used
to calculate the confidence intervals was the Wilson score
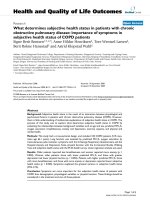
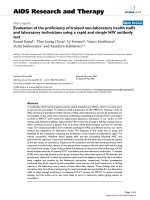
Representative recording of a single cough followed by a throat clear during quiet breathingFigure 1
Representative recording of a single cough followed by a throat clear during quiet breathing. V
T
= tidal volume; F
b
= breathing frequency; Mic = contact microphone output; SE = sound envelope; HR = heart rate; ECG = electrocardiograph
tracing; Posture = body position defined as upright, supine, right decubitis and left decubitis; Cough = cough output from algo-
rithm. The shaded bar contains the cough event. Cough is indicated by a single solid line at the end of the breath that contains
the cough. Note the change in the posture from supine to upright to supine immediately following the cough. Entire duration
of depicted recording is 1-min and 1-sec.
Cough 2005, 1:3 />Page 4 of 7
(page number not for citation purposes)
method without continuity correction [24], which has
been previously shown to exhibit a logit scale symmetry
property with consequent log scale symmetry for certain
derived intervals [25].
Results
A satisfactory fit of the available standard sizes of the res-
piratory inductance plethysmography (RIP) garment was
achieved in all patients and the system was well tolerated
during the recording period. Figure 1 and Figure 2 depict
a representative recording of a single cough during quiet
breathing and during a series of coughs close together,
respectively. Figure 3 is a representative recording of
speech.
Patients were invited to be observed for a maximum of 24
hours. A total of 109 hours of simultaneous recordings of
video and LS were obtained. Of that time, 73.9 hours were
observed during the day and 34.7 hours were observed
during the night. During the recording period, the total
number of coughs documented by video surveillance was
3,645. The LS system reported 3,363 coughs during the
same time period. The median cough rate per patient was
21.3 coughs·hr
-1
(Range: 10.1 cghs·hr
-1
– 59.9 cghs·hr
-1
).
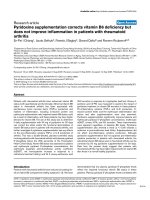
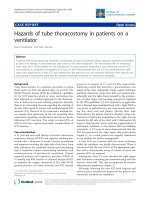
Representative recording of coughing during sleepFigure 2
Representative recording of coughing during sleep. V
T
= tidal volume; F
b
= breathing frequency; Mic = contact micro-
phone output; SE = sound envelope; HR = heart rate; ECG = electrocardiograph tracing; Posture = body position defined as
upright, supine, right decubitis and left decubitis; Cough = cough output from LS algorithm. The first shaded bar contains the
cough bout. Ten coughs occurred during the 9-sec bout. Each cough is indicated by a single solid line at the end of the breath
that contains the cough. Note that the cough bout was followed by a 15-sec apnea (second shaded bar). Entire duration of
depicted recording is 1-min and 23-sec.
Cough 2005, 1:3 />Page 5 of 7
(page number not for citation purposes)
Table 2 provides performance summaries for the LS sys-
tem to detect cough during for night vs. day and for low
and high respiration rates, respectively. Patients were
assigned to low vs. high respiratory rate depending on
whether the rate was below or above the median breath-
ing frequency (median F
b
= 21 br·min
-1
). The system was
highly accurate in identifying cough as a respiratory event
during night or day. Accuracy during the night was 99.4%,
while accuracy during the day was 98.8% for a difference
= 0.53%. The specificities and negative predictive values
are considered 'excellent' by the criteria proposed by Byrt
(1996)[26]. Sensitivities, positive predictive values and
kappa can be considered 'very good' by the same criteria.
Likewise, the performance summaries for the system
between high or low respiration rates were remarkably
similar. Accuracy, specificities, and negative predictive val-
ues were 'excellent' and sensitivities, positive predictive
values and kappa were 'very good' [26].
Discussion
We report validity and reliability statistics for a novel
ambulatory system to evaluate its capability to detect
cough and demonstrate a high level of agreement and
accuracy when compared to video surveillance for cough
over an extended period. The system was well-tolerated
and allowed for free movement throughout the monitor-
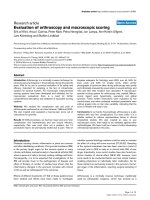
Representative recording of talking and laughingFigure 3
Representative recording of talking and laughing. V
T
= tidal volume; F
b
= breathing frequency; Mic = contact micro-
phone output; SE = sound envelope; HR = heart rate; ECG = electrocardiograph tracing; Posture = upright. The shaded bar
contains a burst of laughing. Entire duration of depicted recording is 1-min and 37-sec.
Cough 2005, 1:3 />Page 6 of 7
(page number not for citation purposes)
ing facility. The system continuously monitors several car-
dio-pulmonary-activity variables, which allowed us to
evaluate ventilatory strategies associated with coughing,
which is one of its novel features.
The patient population in this study coughed with great
frequency, which reflects the fact these were COPD
patients who had a primary complaint of cough. At
screening, patients were asked if they coughed ten times
per day or more. Although all of the patients met this
requirement, they had difficulty recalling how many
cough bouts per day they experienced. As such, we did not
predict that this population would cough with such a high
frequency and, although the number of coughs was higher
than anticipated, it was within the range of what has been
reported previously [12].
Agreement between the LS system and video surveillance
was excellent. Interestingly, we did observe that the
nocturnal validation and agreement statistics, as well as
differences between low and high respiratory rates, were
statistically significantly different, although they differed
only slightly in magnitude. These small, yet statistically
significant, difference likely reflect the influence of the res-
piratory events (e.g., V
T
and F
b
) sample size during the
recording period on the statistical power for these com-
parisons and is not clinically significant.
Objective cough assessment has been attempted on
numerous previous occasions [6-8,10,12,14]. Until now,
a robust, accurate ambulatory system has failed to emerge.
This is likely due to the fact that previous systems have
attempted to identify cough with a single physiologic sig-
nal (e.g., sound). Sound-based technologies have been
the primary means of cough assessment due to the audi-
ble sound that is generated during a cough [28]. These sys-
tems, however, are susceptible to a high false positive rate
when ambient noise is prominent and are unable to dis-
tinguish cough-like sounds (e.g., throat clearing) from
true cough. Hsu et al. (1994) [12] augmented sound anal-
yses with concomitant intercostal electromyography
(EMG) analyses and evaluated various clinical popula-
tions (e.g., normal controls, stable asthmatics and
patients with daily, persistent & non-productive cough)
and concluded that their system may be useful in the
assessment of antitussive therapies. Hsu et al., however,
did not present evidence of agreement by comparing their
results to a reference standard.
There were three limitations to the study. First, the sample
size was small. Sample size was limited by available
resources to review the vast amount of video and LS data.
Second, women (6/8) were over represented in the study,
which was due to an inauspicious baseline imbalance.
Third, the data were collected in a clinical setting due to
the requirement for video monitoring equipment.
However, patients were not confined to any one space and
ambulated, spoke on the phone, dined and performed
additional activities of daily living.
A substantial challenge in this study was the choice of a
reference standard with which to evaluate the novel
device. We chose video based on the fact that the source
document (video) could be reviewed during the adjudica-
tion process if there was uncertainty with respect to the
occurrence of a cough. Scoring the video in duplicate was
an arduous task which likely increased the possibility of
human error due to fatigue and it is possible that some
coughs were missed. Events that were missed by both
reviewers would not have been adjudicated, but identified
Table 2: Validation and agreement statistics (with 95% confidence intervals) for the LifeShirt system during day & night and at low &
high respiration rates. Values are calculated values for the sensitivity (SN), specificity (SP), positive predictive-value (PPV), negative
predictive-value (NPV), accuracy (ACC) and the kappa statistic. Values in parentheses are the 95% confidence intervals. All values are
for LS system compared to video documentation of cough events; * p-value < 0.0001 for night vs. day comparisons of period for SN,
SP, NPV and ACC; ¶p-value < 0.0001 for night vs. day comparisons of respiratory rate for SN, SP, PPV, NPV; ‡ p-value = 0.004 for day
vs. night comparisons of respiratory rate for ACC. Day period defined as 0600–1800; Night period defined as 1800–0600. Patients were
assigned to the low or high respiratory rate group based on whether their mean F
b
was below or above the median F
b
(median = 21
br·min
-1
).
Period Respiratory Rate
Combined Day Night Low High
SN 78.1 (76.7, 79.4) 76.7 (75.1, 78.2) 82.7 (80.0, 85.1)* 69.5 (66.3, 72.6) 80.6 (79.0, 82.0)¶
SP 99.6 (99.5, 99.6) 99.6 (99.5, 99.6) 99.7 (99.7, 99.8)* 99.5 (99.5, 99.6) 99.7 (99.6, 99.7) ¶
PPV 84.6 (83.3, 85.8) 84.5 (83.0, 85.8) 85.0 (82.3, 87.3) 69.8 (66.5, 72.8) 89.4 (88.1, 90.5) ¶
NPV 99.4 (99.3, 99.4) 99.3 (99.2, 99.3) 99.7 (99.6, 99.7)* 99.5 (99.5, 99.6) 99.3 (99.2, 99.3) ¶
ACC 99.0 (99.0, 99.1) 98.8 (98.8, 98.9) 99.4 (99.3, 99.5)* 99.1 (99.0, 99.2) 99.0 (98.9, 99.0)‡
Kappa 80.7 (79.7, 81.7) 79.8 (78.6, 81.0) 83.5 (81.5, 85.5) 69.2 (66.6, 71.7) 84.2 (83.1, 85.3)
Publish with BioMed Central and every
scientist can read your work free of charge
"BioMed Central will be the most significant development for
disseminating the results of biomedical research in our lifetime."
Sir Paul Nurse, Cancer Research UK
Your research papers will be:
available free of charge to the entire biomedical community
peer reviewed and published immediately upon acceptance
cited in PubMed and archived on PubMed Central
yours — you keep the copyright
Submit your manuscript here:
/>BioMedcentral
Cough 2005, 1:3 />Page 7 of 7
(page number not for citation purposes)
by the LS system and therefore would have been inappro-
priately scored as a false-positive. Thus, these results are a
conservative estimate of LS capabilities and may underes-
timate the predictive power of the device.
Conclusion
We report data from a novel, ambulatory, multi-signal
device that shows a high level of agreement and accuracy
when compared to video/audio surveillance over an
extended period and confirm its potential in the evalua-
tion of antitussive therapies. The availability of a valid,
robust ambulatory tool for quantifying cough will enable
the determination of the minimal required reduction in
cough to maximally improve patient HQRL, and open up
a broad array of research questions both specific to cough
and wherein cough may be an important covariate,
comorbidity, or confounding factor.
Competing interests
Financial Disclosure: MAC and DBK were employed by
VivoMetrics during the course of the study. MGW consults
for VivoMetrics. LSH, MLW, BKH are employed by Glaxo-
SmithKline. Supported by a grant from GlaxoSmithKline.
References
1. Schappert SM: National ambulatory medical care survey:
summary. Vital Health Stat 1993, 230:1-20.
2. Birring SS, Prudon B, Carr AJ, Singh SJ, Morgan MD, Pavord ID:
Development of a symptom specific health status measure
for patients with chronic cough: Leicester Cough Question-
naire (LCQ). Thorax 2003, 58:339-343.
3. French CL, Irwin RS, Curley FJ, Krikorian CJ: Impact of chronic
cough on quality of life. Arch Intern Med 1998, 158:1657-1661.
4. Irwin RS, French CT, Fletcher KE: Quality of life in coughers. Pulm
Pharmacol Ther 2002, 15:283-286.
5. French CT, Irwin RS, Fletcher KE, Adams TM: Evaluation of a
cough-specific quality-of-life questionnaire. Chest 2002,
121:1123-1131.
6. Barach AL, Bickerman HA, Beck GJ: Clinical and physiological
studies on the use of metacortandracin in respiratory dis-
ease.1.Bronchial asthma. DC 1955, 27:515-522.
7. Bickerman HA, Barach AL: The experimental production of
cough in human subjects induced by citric acid aerosols.
Peliminary studies in the evaluation of antitussive agents. Am
J Med Sci 1954, 228:156-163.
8. Prime FJ: The assessment of antitusive drugs in man. Br Med J
1961, 1:1149-1151.
9. Woolf CR, Rosenberg A: The cough suppressant effect of her-
oin and codeine: a controlled clinical study. Can Med Assoc J
1962, 87:810-814.
10. Sevelius H, Colmore JP: Objective assessment of antitussive
agents in patients with chronic cough. J New Drugs 1966,
6:216-233.
11. Chang AB, Phelan PD, Robertson CF, Newman RG, Sawyer SM: Fre-
quency and perception of cough severity. J Paediatr Child Health
2001, 37:142-145.
12. Hsu JY, Stone RA, Logan-Sinclair RB, Worsdell M, Busst CM, Chung
KF: Coughing frequency in patients with persistent cough:
assessment using a 24 hour ambulatory recorder. Eur Respir J
1994, 7:1246-1253.
13. Dalmasso F, Isnardi E, Sudaro L, Bellantoni R: Bioacoustins of
cough during bronchial inhalation challenge (BIC) with
methacholine. Eur Resp J 2001, 18:135S.
14. Subburaj S, Parvez L, Rajagopalan TG: Methods of recording and
analysing cough sounds. Pulm Pharmacol 1996, 9:269-279.
15. Tobin MJ, Chadha TS, Jenouri G, Birch SJ, Gazeroglu HB, Sackner MA:
Breathing patterns. 1. Normal subjects. Chest 1983,
84:202-205.
16. Tobin MJ, Chadha TS, Jenouri G, Birch SJ, Gazeroglu HB, Sackner MA:
Breathing patterns. 2. Diseased subjects. Chest 1983,
84:286-294.
17. Chadha TS, Schneider AW, Birch S, Jenouri G, Sackner MA: Breath-
ing pattern during induced bronchoconstriction. Journal of
Applied Physiology: Respiratory, Environmental & Exercise Physiology 1984,
56:1053-1059.
18. Sackner MA, Gonzalez HF, Jenouri G, Rodriguez M: Effects of
abdominal and thoracic breathing on breathing pattern
components in normal subjects and in patients with chronic
obstructive pulmonary disease. American Review of Respiratory
Disease 1984, 130:584-587.
19. Tobin MJ, Guenther SM, Perez W, Mador MJ: Accuracy of the res-
piratory inductive plethysmograph during loaded breathing.
Journal of Applied Physiology 1987, 62:497-505.
20. Cantineau JP, Escourrou P, Sartene R, Gaultier C, Goldman M: Accu-
racy of respiratory inductive plethysmography during wake-
fulness and sleep in patients with obstructive sleep apnea.
Chest 1992, 102:1145-1151.
21. Carter GS, Coyle MA, Mendelson WB: Validity of a portable car-
dio-respiratory system to collect data in the home environ-
ment in patients with obstructive sleep apnea. Sleep and
Hypnosis 2004, 6:85-92.
22. Clarenbach CF, Senn O, Brack T, Bloch KE: Monitoring of ventila-
tion during exercise by a novel portable respiratory induc-
tive plethysmograph. Chest, In Print 2005.
23. Greenhalgh T: How to read a paper. Papers that report diag-
nostic or screening tests. BMJ 1997, 315:540-543.
24. Wilson EB: Probable inference, the law of succession, and sta-
tistical inference. J Am Stat Assoc 1927, 22:209-212.
25. Newcombe RG: Two-sided confidence intervals for the single
proportion: comparison of seven methods. Stat Med 1998,
17:857-872.
26. Byrt T: How good is that agreement? (Letter to editor). Epi-
demiology 1996, 7:561.