Báo cáo y học: "Positive end-expiratory pressure at minimal respiratory elastance represents the best compromise between mechanical stress and lung aeration in oleic acid induced lung injury" pps
Bạn đang xem bản rút gọn của tài liệu. Xem và tải ngay bản đầy đủ của tài liệu tại đây (982.44 KB, 13 trang )
Open Access
Available online />Page 1 of 13
(page number not for citation purposes)
Vol 11 No 4
Research
Positive end-expiratory pressure at minimal respiratory elastance
represents the best compromise between mechanical stress and
lung aeration in oleic acid induced lung injury
Alysson Roncally S Carvalho
1
, Frederico C Jandre
1
, Alexandre V Pino
1
, Fernando A Bozza
2
,
Jorge Salluh
3
, Rosana Rodrigues
4
, Fabio O Ascoli
2
and Antonio Giannella-Neto
1
Biomedical Engineering Program, COPPE, Federal University of Rio de Janeiro, Av. Horácio Macedo, CT Bloco H-327, 2030, 21941-914, Rio de
Janeiro, Brazil
2
Fundação Oswaldo Cruz, Instituto de Pesquisa Clinica Evandro Chagas e Laboratório de Imunofarmacologia, IOC, Av Brasil, 4365, Manguinhos,
21045-900 Rio de Janeiro, Brazil
3
National Institute of Cancer-1, ICU, Praça Cruz Vermelha, 20230-130 Rio de Janeiro, Brazil
4
Radiodiagnostic Service, Clementino Fraga Filho Hospital, Federal University of Rio de Janeiro, R Professor Rodolpho Paulo Rocco, 255, 21-941-
913 Rio de Janeiro, Brazil
Corresponding author: Antonio Giannella-Neto,
Received: 5 Jan 2007 Revisions requested: 20 Feb 2007 Revisions received: 3 Apr 2007 Accepted: 9 Aug 2007 Published: 9 Aug 2007
Critical Care 2007, 11:R86 (doi:10.1186/cc6093)
This article is online at: />© 2007 Carvalho et al.; licensee BioMed Central Ltd.
This is an open access article distributed under the terms of the Creative Commons Attribution License ( />),
which permits unrestricted use, distribution, and reproduction in any medium, provided the original work is properly cited.
Abstract
Introduction Protective ventilatory strategies have been applied
to prevent ventilator-induced lung injury in patients with acute
lung injury (ALI). However, adjustment of positive end-expiratory
pressure (PEEP) to avoid alveolar de-recruitment and
hyperinflation remains difficult. An alternative is to set the PEEP
based on minimizing respiratory system elastance (Ers) by
titrating PEEP. In the present study we evaluate the distribution
of lung aeration (assessed using computed tomography
scanning) and the behaviour of Ers in a porcine model of ALI,
during a descending PEEP titration manoeuvre with a protective
low tidal volume.
Methods PEEP titration (from 26 to 0 cmH
2
O, with a tidal
volume of 6 to 7 ml/kg) was performed, following a recruitment
manoeuvre. At each PEEP, helical computed tomography scans
of juxta-diaphragmatic parts of the lower lobes were obtained
during end-expiratory and end-inspiratory pauses in six piglets
with ALI induced by oleic acid. The distribution of the lung
compartments (hyperinflated, normally aerated, poorly aerated
and non-aerated areas) was determined and the Ers was
estimated on a breath-by-breath basis from the equation of
motion of the respiratory system using the least-squares
method.
Results Progressive reduction in PEEP from 26 cmH
2
O to the
PEEP at which the minimum Ers was observed improved poorly
aerated areas, with a proportional reduction in hyperinflated
areas. Also, the distribution of normally aerated areas remained
steady over this interval, with no changes in non-aerated areas.
The PEEP at which minimal Ers occurred corresponded to the
greatest amount of normally aerated areas, with lesser
hyperinflated, and poorly and non-aerated areas. Levels of PEEP
below that at which minimal Ers was observed increased poorly
and non-aerated areas, with concomitant reductions in normally
inflated and hyperinflated areas.
Conclusion The PEEP at which minimal Ers occurred, obtained
by descending PEEP titration with a protective low tidal volume,
corresponded to the greatest amount of normally aerated areas,
with lesser collapsed and hyperinflated areas. The institution of
high levels of PEEP reduced poorly aerated areas but enlarged
hyperinflated ones. Reduction in PEEP consistently enhanced
poorly or non-aerated areas as well as tidal re-aeration. Hence,
monitoring respiratory mechanics during a PEEP titration
procedure may be a useful adjunct to optimize lung aeration.
Introduction
Mechanical ventilation has become the most important life
support modality in patients suffering from acute lung injury
(ALI) [1]. However, use of high tidal volumes (V
T
s) and
ALI = acute lung injury; CT = computed tomography; Ers = elastance of the respiratory system; PEEP = positive end-expiratory pressure; PEEP
Ers
=
PEEP at which the minimum Ers was observed; Rrs = resistance of the respiratory system; V
T
= tidal volume; ZEEP = zero end-expiratory pressure.
Critical Care Vol 11 No 4 Carvalho et al.
Page 2 of 13
(page number not for citation purposes)
inappropriate levels of positive end-expiratory pressure
(PEEP) may worsen any pre-existing lung inflammatory proc-
ess [2,3].
Currently, a major difficulty when instituting a lung-protective
ventilatory strategy in ALI lies in the objective determination of
a PEEP level that prevents alveolar de-recruitment without
inducing lung over-inflation and pulmonary distortion [4-6]. In
clinical practice PEEP is usually adjusted according to oxygen-
ation response and the required fraction of oxygen [7], but
both PEEP-induced over-distension and tidal recruitment are
rather difficult to detect [8]. An alternative is to determine an
'optimal' level of PEEP based on minimizing the mechanical
stress that results from tidal alveolar recruitment and over-dis-
tension [9]. For this purpose, the deflation limb of the pres-
sure-volume curve has been used to identify the level of PEEP
that effectively prevents alveolar de-recruitment [7,10]. How-
ever, pressure-volume curves are not easily obtained at the
bedside and often require special manoeuvres, such as dis-
connection from the ventilator or modifications to the tidal ven-
tilatory pattern.
Morphological analysis of lung computed tomography (CT)
images has been used to assess lung aeration, and this
approach may provide an objective tool with which to establish
optimal mechanical ventilation settings [11-14]. However, the
CT scan is not portable and often requires transport of the
patient to the radiology department.
A clinically feasible alternative is to set the PEEP level based
on minimizing the elastance of the respiratory system (Ers),
during a descending PEEP titration [15,16]. In healthy piglets
managed using a protective low V
T
ventilatory strategy, we
recently showed that the PEEP at which the minimum Ers was
observed (PEEP
Ers
) appeared to represent a good compro-
mise between maximum lung aeration and least areas of hyper-
inflation and de-recruitment [17]. Similarly, it has been shown
that continuous monitoring of the dynamic respiratory system
compliance permitted the detection of alveolar de-recruitment
in a protocol involving descending PEEP titration in a sur-
factant-depleted swine model [18].
The aim of this work was to evaluate the distribution of lung
aeration, as assessed based on morphological analysis of CT
images, and the behaviour of the Ers in a porcine model of ALI,
during a descending PEEP titration manoeuvre with a low V
T
.
The correspondence and contrast between Ers and distribu-
tion of lung aeration, particularly the distribution of lung aera-
tion at PEEP
Ers
, were examined. In addition, the feasibility of
using continuous monitoring of the Ers to establish the optimal
PEEP level is discussed.
Materials and methods
The protocol was submitted and approved by the local Ethics
Committee for Assessment of Animal Use in Research
(CEUA/FIOCRUZ).
Animal preparation
The animal preparation and protocol, apart from ALI induction,
were similar to those presented in detail in the report by Car-
valho and coworkers [17]. In brief, six piglets (17 to 20 kg), lay-
ing in the supine position, were pre-medicated with midazolam
(Dormire; Cristália, São Paulo, Brazil) and connected to an
Amadeus ventilator (Hamilton Medical; Rhäzüns, Switzerland).
The animals underwent volume-controlled ventilation with
square flow waveform, with a PEEP of 5 cmH
2
O, fractional
inspired oxygen of 1.0, V
T
of 8 ml/kg, inspiratory/expiratory
ratio of 1:2, and respiratory rate between 25 and 30 breaths/
min, in order to maintain normocapnia (arterial carbon dioxide
tension range 35 to 45 mmHg). A flexible catheter was
inserted through which blood samples were drawn for blood
gas analysis (I-STAT with EG7+ cartridges; i-STAT Corp, East
Windsor, USA) in order to certify that ALI criteria were satis-
fied. The animals were sedated with a continuous infusion of
ketamine (Ketamina; Cristália) delivered at a rate of 10 mg/kg
per hour and paralyzed with pancuronium (Pavulon; Organon
Teknika, São Paulo, Brazil) at 2 mg/kg per hour. The airway
opening pressure was measured using a pressure transducer
(163PC01D48; Honeywell Ltd, Freeport, USA) connected to
the endotracheal tube, and flow was measured using a varia-
ble-orifice pneumotachometer (Hamilton Medical) connected
to a pressure transducer (176PC07HD2; Honeywell Ltd). Air-
way opening pressure and flow were digitized at a sampling
rate of 200 Hz per channel. The volume was calculated by
numerical integration of flow.
Experimental protocol
After 20 to 120 min of artificial ventilation, lung injury was
induced by means of central venous infusion of oleic acid
(0.05 ml/kg) until the arterial oxygen tension (PaO
2
) fell to
below 200 mmHg for at least 30 min. After lung injury was
established, the V
T
was set to 6 ml/kg and a recruitment
manoeuvre was performed, with a sustained inflation of 30
cmH
2
O over 30 s. The PEEP was titrated by descending from
26 cmH
2
O to 20, 16, 12, 8, 6 and then 0 cmH
2
O (zero PEEP
[ZEEP]). The duration of each step was 3 min, except for the
26 cmH
2
O step and ZEEP (6 min each; Figure 1). All mechan-
ical ventilation parameters were kept constant during the
entire titration procedure. At the end of the protocol, the ani-
mals were killed using an intravenous injection of potassium
chloride while they were deeply sedated.
Computed tomography scan procedure and image
analysis
Helical CT scans (Asteion; Toshiba, Tokyo, Japan) were
obtained at a fixed anatomic level in the lower lobes of the
lungs, corresponding to the greatest transverse lung area.
Available online />Page 3 of 13
(page number not for citation purposes)
Each scan comprised five to seven thin section slices (1 mm).
Scanning time, tube current and voltage were 1 s, 120 mA and
140 kV, respectively. The actual image matrix was 512 × 512
and the voxel dimensions ranged from 0.22 to 0.29 mm. The
scans were obtained at the end of each PEEP step, during
end-expiratory and end-inspiratory pauses of 15 to 20 s (Fig-
ure 1). All images were acquired with the animal laying supine
position during the entire protocol.
The images were imported and analyzed using a purpose-built
routine (COPPE-CT) written in MatLab (Mathworks, Natick,
MA, USA). The lung contours were manually traced to define
the region of interest. The presence of hyperinflated (-1,000 to
-900 Hounsfield units, coloured in red), normally aerated (-900
to -500 Hounsfield units, blue), poorly aerated (-500 to -100
Hounsfield units, light grey) and non-aerated areas (-100 to
+100 Hounsfield units, dark grey) was determined, in accord-
ance with a previously proposed classification [14,19]. The
absolute weight of tissue (in grams) in each slice as well as in
each compartment within the slice was also calculated using
standard equations [14]. Attenuation values outside the range
of -1,000 to +100, which contributed under 1% of all counts,
were excluded. In order to compare the images obtained at
end-expiration and end-inspiration, the slices with the greatest
anatomical coincidence between end-expiration and end-
inspiration images were chosen, by selecting one of the last
five to seven slices at end-expiration and one of the first slices
at the end-inspiration.
In order to evaluate any possible cephalo-caudal gradient, in
two of the animals three CT scan slices were obtained at the
apical level (near hilus), middle (near the carina) and basal (up
to diaphragm) at a PEEP of 26 cmH
2
O during end-expiratory
and end-inspiratory pauses.
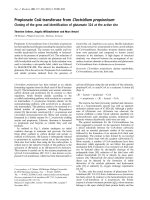
Figure 1
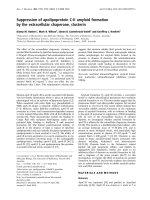
Time plot of Paw during the PEEP titration procedureTime plot of Paw during the PEEP titration procedure. The baseline ventilation, with a PEEP of 5 cmH
2
O, and the recruitment maneuver followed by
the descending PEEP titration are shown. At the end of each PEEP step, a CT scan was performed at end-expiratory (left) and end-inspiratory (right)
pauses. (CT scan images from a representative animal are shown.) CT, computed tomography; Paw, airway opening pressure; PEEP, positive end-
expiratory pressure.
3 min
Time
Recruitment
Critical Care Vol 11 No 4 Carvalho et al.
Page 4 of 13
(page number not for citation purposes)
Data analysis
Signals of airway opening pressure, flow and volume were
used to obtain the parameters required by the equation of
motion of the respiratory system using least-squares linear
regression, considering a linear single-compartment model:
Paw = Ers × V(t) + Rrs × dV(t)/dt + EEP (1)
Where Rrs is the resistance of the respiratory system, V(t) is
the volume, dV/dt is the flow and EEP is the end-expiratory
pressure. Curve fitting to the linear single-compartment model
(Eqn 1) was performed using data acquired during the entire
PEEP titration procedure. For data analysis, mean values of
Ers, Rrs and EEP were calculated on a breath-by-breath basis
from the last minute of each PEEP step, and immediately
before the CT scanning was performed. The quality of fitting
was assessed using the coefficient of determination of the
regression (R
2
).
Statistical analysis
Data are presented as median and range values, attributed to
the respective PEEP values. The peak and plateau pressures,
as well as the estimated and applied PEEP values, were meas-
ured at each PEEP level. A Wilcoxon signed rank test for
paired samples was applied to compare changes in Ers for
each PEEP step, as well as changes in lung aeration between
end-expiration and end-inspiration at each PEEP value. In all
tests, a P < 0.05 was considered significant.
Results
The respiratory mechanics parameters, namely the estimated
Ers and Rrs, and the PEEP, are presented in Table 1. The Ers
reached a minimum with PEEP set to 16 cmH
2
O for all (Figure
2) but two animals (for which the levels of PEEP that yielded
the lowest Ers were 12 cmH
2
O and 20 cmH
2
O; see Figures
3 and ).
Table 2 presents the absolute weight of tissue (in grams) at
end-expiration and end-inspiration, in each slice and in each
compartment within the slice, during the PEEP titration. Note
that an overall increase in the slice mass was observed as
PEEP decreased. Additionally, a reduction in the slice mass
was consistently observed from expiration to inspiration. The
slice mass increase was concentrated in the poorly and non-
aerated compartments.
CT scan morphological analyses and respiratory
mechanics during PEEP titration
The reduction in PEEP from 26 cmH
2
O to PEEP
Ers
signifi-
cantly increased poorly aerated areas (ranges increase from
8–21% to 14–31% at end-expiration, and from 7–16% to 13–
23% at end-inspiration), with no significant change in non-aer-
ated areas, which remained below 5%. Normally aerated areas
remained in a plateau ranging from 61% to 80% at end-expi-
ration and from 66% to 81% at end-inspiration, and hyperin-
flated areas monotonically decreased (ranges decrease from
2–16% to 1–8% at end-expiration, and from 3–19% to 2–
10% at end-inspiration). The distribution of aeration at each
PEEP step is depicted in Figures 2 to 4. Note that PEEP
Ers
resulted in the best compromise between normally, hyperin-
flated and non-aerated areas in all studied animals. A predom-
inance of hyperinflated areas in nondependent lung regions
was observed, whereas poorly aerated areas appeared to be
more diffusely distributed. Non-aerated areas, which were
always less than 5%, occurred in dependent regions (Figures
2 to 4, upper panels).
The progressive reduction in PEEP from PEEP
Ers
to ZEEP
Table 1
Respiratory mechanics and regression parameters
Parameter Descending PEEP titration steps
PEEP
appl
(cmH
2
O)
27.1 (25.3–27.7) 21.0 (19.8–22.1) 16.3 (15.6–17.2) 12.3 (12–13.1) 8.4 (7.7–9.2) 6.2 (5.9–6.9) 0.8 (0.5–1.7)
Ppeak
(cmH
2
O)
47.85 (40–52) 36.4 (31.3–40.5) 29.35 (25.7–30.6) 25.1 (22.6–28.2) 24.05 (21.3–26.4) 23.7 (20.7–25.7) 24 (21.6–28.8)
Pplateau
(cmH
2
O)
39.5 (33.8–45.6) 31.2 (28.9–37.5) 25.6 (24.4–28.1) 21.3 (19.2–25.1) 19.1 (17–22.4) 18.1 (16.3–22.2) 17.9 (14.2–21.4)
Ers
(cmH
2
O.l
-1
)
131.4 (90.1–141.4) 84.0 (65.1–101) 65.5 (54.9–81.5) 70.4 (53–95.9) 86.4 (67.5–129.2) 94.3 (81.2–143.6) 148.8 (91.2–198)
Rrs
(cmH
2
O.l
-1
.s)
11.5 (7.4–11.8) 9.7 (6.8–10.4) 8.7 (6.6–10.3) 8.7 (7.8–11.2) 11.2 (9.1–13.8) 11.7 (9.6–15.3) 17.2 (13.9–22.8)
PEEP
est
(cmH
2
O)
26.7 (25.2–27.7) 20.9 (119.6–20.8) 16.4 (15.4–17.2) 12.3 (12.1–12.6) 8.4 (7.8–8.7) 6.2 (5.88–6.6) 0.45 (0.07–2.2)
R
2
0.975 (0.97–0.985) 0.975 (0.97–0.983) 0.979 (0.97–0.985) 0.98 (0.97–0.988) 0.98 (0.97–0.99) 0.982 (0.97–0.99) 0.99 (0.88–0.99)
Data are presented as median (range). Ers, elastance of the respiratory system; PEEP, positive end-expiratory pressure; PEEP
appl
, applied PEEP; PEEP
est
, estimated PEEP;
P
peak
, peak ventilator pressure; P
plateau
, plateau ventilator pressure; Rrs, resistance of the respiratory system; R
2
, coefficient of determination of the regression analysis.
Available online />Page 5 of 13
(page number not for citation purposes)
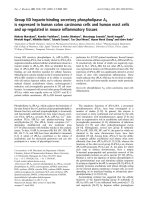
Figure 2
Ers, Rrs and morphological analysis of the CT scans during PEEP titration for animals I, II, III and VIErs, Rrs and morphological analysis of the CT scans during PEEP titration for animals I, II, III and VI. The median and range of Ers and Rrs, and the
distribution of lung aeration are plotted as a function of PEEP. Red diamonds indicate hyperinflated areas, blue circles indicate normally aerated
areas, light grey squares indicate poorly aerated areas, and black triangles indicate non-aerated areas. The filled and open symbols indicate lung aer-
ation changes at end-inspiration and end-expiration, respectively. Regions of interest on the CT scan images obtained during the PEEP titration in a
representative case (animal I) are also presented in the upper panel. Aeration titration in a representative case (animal I) are also presented in the
upper panel. Aeration status is colour coded in the images. Red indicates hyperinflated areas, and blue, light grey and black indicate normally aer-
ated, poorly aerated and non-aerated areas, respectively. CT, computed tomography; Ers, respiratory system elastance; PEEP, positive end-expira-
tory pressure; Rrs, respiratory system resistance.
0 5 10 15 20 25 30
50
100
150
200
Ers (cmH
2
O/L)
0 5 10 15 20 25 30
5
10
15
20
25
PEEP (cmH
2
O)
Rrs (cmH
2
O/L/s)
0 5 10 15 20 25 30
0
20
40
60
80
100
% Areas
0 5 10 15 20 25 30
0
20
40
60
80
100
% Areas
PEEP (cmH
2
O)
Animals I,II,III and VI
PEEP 0 PEEP 6 PEEP 8 PEEP 12 PEEP 16 PEEP 20 PEEP 26
End - Expiration
End-Inspiration
Critical Care Vol 11 No 4 Carvalho et al.
Page 6 of 13
(page number not for citation purposes)
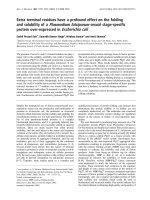
Figure 3
Ers, Rrs and morphological analysis of the CT scans during PEEP titration for animal IVErs, Rrs and morphological analysis of the CT scans during PEEP titration for animal IV. The regions of interest of the CT scan images obtained dur-
ing the PEEP titration are also shown in the upper panel. For details, see legend to Figure 2. CT, computed tomography; Ers, respiratory system
elastance; PEEP, positive end-expiratory pressure; Rrs, respiratory system resistance.
0 5 10 15 20 25 30
50
100
150
200
Ers (cmH
2
O/L)
0 5 10 15 20 25 30
0
5
10
15
20
25
Rrs (cmH
2
O/L/s)
0 5 10 15 20 25 30
0
20
40
60
80
100
% Areas
0 5 10 15 20 25 30
0
20
40
60
80
100
% Areas
PEEP (cmH
2
O)
Animal IV
PEEP 0 PEEP 6 PEEP 8 PEEP 12 PEEP 16 PEEP 20 PEEP 26
End - Expiration
End-Inspiration
Available online />Page 7 of 13
(page number not for citation purposes)
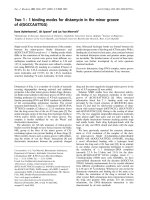
Figure 4
Ers, Rrs and morphological analysis of the CT scans during PEEP titration for animal VErs, Rrs and morphological analysis of the CT scans during PEEP titration for animal V. The regions of interest of the CT scan images obtained dur-
ing the PEEP titration are also shown in the upper panel. For details, see legend to Figure 2. CT, computed tomography; Ers, respiratory system
elastance; PEEP, positive end-expiratory pressure; Rrs, respiratory system resistance.
0 5 10 15 20 25 30
50
100
150
200
Ers (cmH
2
O/L)
0 5 10 15 20 25 30
0
5
10
15
20
25
Rrs (cmH
2
O/L/s)
0 5 10 15 20 25 30
0
20
40
60
80
100
% Areas
0 5 10 15 20 25 30
0
20
40
60
80
100
% Areas
PEEP (cmH
2
O)
Animal V
PEEP 0 PEEP 6 PEEP 8 PEEP 12 PEEP 16 PEEP 20 PEEP 26
End - Expiration
End-Inspiration
Critical Care Vol 11 No 4 Carvalho et al.
Page 8 of 13
(page number not for citation purposes)
resulted in a significant increase in non-aerated areas (ranges
increased from 2–4% to 26–58% at end-expiratory pause,
and from 2–5% to 25–50% at end-inspiratory pause), with
concomitant reductions in normal inflation (from 61–80% to
15–46% at end-expiratory pause, and from 66–81% to 22–
47% at end-inspiratory pause) and hyperinflation (from 1–8%
to 0–1% at end-expiratory pause, and from 2–10% to 0–4%
at end-inspiratory pause).
Figure 5 depicts the images and the corresponding density
histogram distributions for two animals during end-expiratory
and end-inspiratory pauses at a PEEP of 26 cmH
2
O. Note that
no significant cephalo-caudal gradient was observed between
the apex and basal levels, but in one animal the middle level
exhibited less areas of hyperinflation. From the apex to the
base, the peak of the histogram shifted toward the normally
aerated range (Figure 5, bottom).
Discussion
CT scan and elastic properties analysis
The main objective of this work was to assess the correspond-
ence between the findings of CT scan morphological analysis
and the dynamics of the mechanical characteristics of the res-
piratory system, in order to evaluate the usefulness of
elastance in establishing PEEP in a protective, low V
T
strategy.
The experimental protocol was designed to resemble a clinical
procedure based on minimization of Ers, as used to set PEEP
in patients with ALI [15,16,20]. PEEP titration with a protective
low V
T
(ranging from 6 to 7 ml/kg) was performed in a swine
oleic acid induced lung injury.
The main finding of our work is that optimization of PEEP
based on minimizing the Ers appears to achieve the best com-
promise between recruitment/de-recruitment and
hyperinflation. Additionally, as reported previously, tidal
recruitment and hyperinflation appear to be simultaneous
processes that occur in different lung regions during inspira-
tion and at different PEEP levels [5,21,22].
After a recruitment manoeuvre, progressive reduction in PEEP
from 26 cmH
2
O to PEEP
Ers
increased poorly aerated areas
with a proportional reduction in hyperinflated areas; the distri-
bution of normally aerated areas remained steady during this
interval for all animals (Figures 2 to 4). It has been proposed
Table 2
CT-scan slice mass during PEEP titration procedure
Parameter Descending PEEP titration steps
PEEP
appl
(cmH
2
O)
27.1 (25.3–
27.7)
21.0 (19.8–
22.1)
16.3 (15.6–
17.2)
12.3 (12–13.1) 8.4 (7.7–9.2) 6.2 (5.9–6.9) 0.8 (0.5–1.7)
Slice mass (g)
Exp 4.8 (3.0–5.1) 4.9 (3.2–5.1) 5.3 (3.5–5.8) 6.0 (4.0–6.3) 6.7 (4.5–7.9) 7.4 (4.9–9.2) 8.6 (6.4–10.2)
Ins 4.4 (2.9–4.8) 4.6 (3.1–5.2) 4.9 (3.2–5.4) 5.5 (3.4–7.0) 6.2 (3.9–7.0) 6.6 (4.3–8.3) 7.5 (5.1–9.1)
Hyperinflated
(g)
Exp 0.06 (0.02–
0.12)
0.06 (0.01–
0.1)
0.04 (0.01–
0.08)
0.03 (0.00–
0.05)
0.02 (0.00–
0.06)
0.01 (0.00–
0.03)
0.00 (0.00–
0.00)
Ins 0.087 (0.03–
0.15)
0.07 (0.03–
0.12)
0.05 (0.02–
0.10)
0.03 (0.01–
0.07)
0.03 (0.01–
0.06)
0.03 (0.01–
0.06)
0.01 (0.00–
0.04)
Normally (g)
Exp 2.7 (1.9–3.2) 2.8 (2.1–3.4) 2.61 (2.2–3.1) 2.16 (1.8–2.5) 1.79 (1.4–2.1) 1.59 (1.2–1.9) 0.83 (0.5–1.4)
Ins 2.67 (1.9–
3.14)
2.69 (2.0–3.3) 2.73 (2.1–3.2) 2.30 (1.9–2.5) 1.89 (1.6–2.3) 1.70 (1.4–2.0) 1.15 (0.9–1.3)
Poorly (g)
Exp 1.4 (0.8–1.7) 1.3 (0.9–1.9) 2.0 (1.0–2.4) 2.7 (1.5–3.1) 2.5 (1.5–3.0) 2.3 (1.8–2.8) 2.3 (2.0–2.9)
Ins 1.0 (0.8–1.5) 1.3 (0.8–1.6) 1.5 (0.9–1.8) 2.1 (1.1–2.4) 2.0 (1.3–2.5) 1.9 (1.2–2.4) 2.0 (1.6–3.0)
Non-aerated (g)
Exp 0.3 (0.2–0.4) 0.3 (0.2–0.7) 0.4 (0.2–0.9) 0.9 (0.3–1.5) 2.3 (0.8–3.5) 3.5 (1.1–5.3) 5.6 (3.2–7.3)
Ins 0.3 (0.1–0.6) 0.3 (0.2–0.8) 0.5 (0.2–0.8) 0.8 (0.3–2.8) 2.3 (0.6–2.8) 3.0 (1.0–4.5) 3.8 (2.2–6.2)
Shown are the slice mass (absolute slice tissue mass, in grams), and the mass in hyperinflated compartments (Hyperinflated), in normally aerated
compartments (Normally), in poorly aerated compartments (Poorly) and in the non-aerated compartments (Non-aerated). Data are presented as
median (range). CT, computed tomography; Exp, end-expiratory slice; Ins, end-inspiratory slice; PEEP, positive end-expiratory pressure; PEEP
appl
,
applied positive end-expiratory pressure.
Available online />Page 9 of 13
(page number not for citation purposes)
that the amount of poorly aerated areas reflects the specific
initial lesion; in oleic acid induced ALI, this is the capillary leak-
age with interstitial and alveolar oedema [23]. In view of this,
high levels of PEEP appeared to reduce the amount of poorly
aerated areas, probably by redistributing the interstitial
oedema, but some of the normally aerated areas became
hyperinflated.
PEEP
Ers
marked the pressure at which the coexistence of nor-
mally aerated, poorly aerated and hyperinflated areas
appeared to minimize overall lung parenchyma recoil pres-
sures, resulting in plateau pressures below 30 cmH
2
O (Table
1). The compromise achieved by PEEP
Ers
, resulting in a bal-
ance in the distribution of aeration, may be of value as a guide
to mechanical ventilation and is in accordance with our recent
findings obtained in healthy mechanically ventilated piglets, in
which we used a similar protocol [17]. Comparing the dynam-
ics of Ers and lung aeration at PEEP
Ers
with those at the high-
est PEEP step during the titration protocol, we identified a
difference between healthy animal and those with induced ALI.
In healthy piglets, a twofold rise in Ers was accompanied by a
significant increment in hyperinflated areas and a concomitant
reduction in normally aerated areas, suggesting direct corre-
spondence between radiological evidence of hyperinflation
and overstretching of the alveolar septum. In ALI conditions, a
minor increase in hyperinflated areas and a steady amount of
normally aerated areas were observed. Bearing this in mind,
the increase in Ers in animals with ALI (from 54.5–81.5
cmH
2
O/l at PEEP
Ers
to 91–141.5 cmH
2
O/l at a PEEP of 26
cmH
2
O) may not solely be attributed to the increase in
hyperinflated areas; it is possible that mechanical stress in
alveolar septa at the interface of poorly aerated and non-aer-
ated areas with normally aerated alveoli also played a role
[4,9,24].
Another possibility is that an overall underestimation of aera-
tion could occur as a consequence of the reduction in gas/tis-
sue ratio in each voxel. The oleic acid induced injury produces
acute endothelial and alveolar epithelial cell necrosis, resulting
in multiple pulmonary microembolisms and protein-rich pulmo-
Figure 5
Comparative changes in lung aeration at different anatomic levelsComparative changes in lung aeration at different anatomic levels. Images from the apex to diaphragm level during an end-expiratory pause and an
end-inspiratory pause for two studied animals (left and right columns). The computed tomography (CT) scans were acquired near the lung hilus
(upper), near the carina (middle) and at juxta-diaphragmatic (lower) levels; the respective histograms of density are also shown (bottom).
Critical Care Vol 11 No 4 Carvalho et al.
Page 10 of 13
(page number not for citation purposes)
nary oedema in a pattern that depends upon the distribution of
perfusion [25-27]. Bearing these pathological mechanisms in
mind, it is possible that an overall underestimation of aeration
occurred, leading to an overestimation of non-aerated areas
and therefore an underestimation of hyperinflated areas.
In the present study, a PEEP of 26 cmH
2
O appeared to pre-
vent tidal de-recruitment (Figures 2 to 4). In agreement with
our findings, Neumann and coworkers [28], using a similar
model of ALI in pigs (weighing 31.3 ± 3.3 kg), found that oleic
acid injured lungs tended to de-recruit rapidly during expiration
when PEEPs lower than 15 cmH
2
O were applied, whereas
PEEP levels greater than 20 cmH
2
O almost prevented tidal
de-recruitment and PEEP at 25 cmH
2
O completely avoided
cyclic de-recruitment/recruitment. It is therefore possible that
a PEEP greater than PEEP
Ers
results in lung stability; however,
this stability may be accompanied by overstretching caused by
the hyperinflation of some previously normally aerated areas.
Nevertheless, an analysis of the associated biological cost
would be required to identify the potential benefits of this
'open the lung and keep it open' ventilatory strategy. Addition-
ally, some lung units may only be recruited with hazardous lev-
els of PEEP, which may have potential haemodynamic
drawbacks, for instance the reduction in cardiac output
related to a drop in preload caused by impaired venous return
[24,29] and redistribution of blood flow away from well-venti-
lated units, which often increases ventilatory dead space [30].
In the present study it is reasonable to assume that PEEPs
greater than 26 cmH
2
O would further increase the Ers, with a
corresponding reduction in normally aerated and a steep
increase in hyperinflated areas, in a pattern similar to that
observed by Carvalho and coworkers [17] in healthy lungs at
levels of PEEP in excess of PEEP
Ers
.
The institution of a PEEP level below PEEP
Ers
was associated
with a progressive increase in non-aerated areas. A similar
finding was described in a preceding report from our group
[31], in which we proposed that PEEP
Ers
appears to prevent
alveolar de-recruitment in ALI, according to analysis of CT
scans. It is remarkable that the first step in PEEP below PEEP-
Ers
resulted in an increase in poorly and non-aerated areas and
a concomitant reduction in normally aerated areas in all
animals studied (Figures 2 to 4). However, interpretation of
these findings must take into account the inability of the CT
morphological analysis to separate the effects of reduction in
the amount of aeration from the concomitant increase in the
amount of tissue and liquid observed with PEEP reduction.
The increase in the slice tissue mass as PEEP decreased, as
well as from expiration to inspiration (Table 2), may reflect
cephalo-caudal shrinking of the lungs or may result from the
fact that, at high levels of PEEP, the V
T
may distribute outside
the field of view of the CT scanner. However, we expect that a
protective low V
T
would not cause enough displacement to
move the area observed in the inspiratory slice beyond the
block of expiratory slices. In fact, it was possible to recognize
the same anatomical landmarks at end-expiration and end-
inspiration images in all of the studied animals (Figures 2 to 5).
In accordance with our results, a reduction in lung mass as
PEEP increased was reported by Karmrodt and coworkers
[23]. Those authors compared the distribution of aeration in
two experimental models of ALI (induced by oleic acid injec-
tion and surfactant depletion) in piglets (25 ± 1 kg). Different
levels of continuous positive airways pressure were applied in
a random order (ranging from 5 to 50 cmH
2
O), and CT scans
of the whole lung were acquired at each level of continuous
positive airways pressure (slice thickness 1 mm). The volume
of lung tissue decreased from 223 ± 53 ml to 35 ± 17 ml at a
continuous positive airways pressure of 5 and 50 cmH
2
O,
respectively, mainly in poorly aerated and non-aerated
compartments.
In pigs with ALI induced by surfactant depletion, Suarez-Sip-
mann and coworkers [18] recently reported that continuous
monitoring of dynamic compliance allowed detection of the
beginning of lung collapse during descending titration of
PEEP. The authors reported that the PEEP at which maximal
compliance was observed was between 16 and 12 cmH
2
O in
all eight studied animals, and that a PEEP of 16 cmH
2
O was
required to prevent lung de-recruitment, achieving a compro-
mise between mechanical stress, intrapulmonary shunt and
PaO
2
. Thus, low PEEP levels increased Ers by several mech-
anisms, such as reduction in lung aerated volume as a conse-
quence of alveoli flooding by haemorrhagic oedema in
dependent regions, and tidal overstretching of some previ-
ously normally aerated areas, especially in nondependent
regions. These mechanical effects may be accompanied by a
progressive reduction in PaO
2
and augmented intrapulmonary
shunt, as shown by Suarez-Sipmann and coworkers [18].
The airways resistance exhibited dynamics similar to those of
Ers during PEEP titration. With progressive reduction in PEEP
from 26 cmH
2
O to ZEEP, the airways resistance exhibited a
smooth reduction until PEEP
Ers
was reached, after which it
rose again, showing marked augmentation between PEEP at
6 cmH
2
O and ZEEP. At low levels of PEEP, the augmentation
in Rrs may be attributed to progressive closure of the airways;
however, clearance of mucus during the reduction in PEEP
could have contributed to the elevation in Rrs. The higher val-
ues of Rrs at PEEP levels greater than PEEP
Ers
were unex-
pected, and one may speculate that it may have been caused
by uneven distribution of ventilation as a consequence of
reduced regional compliance in hyperinflated areas.
Additionally, the hyperinflated areas at nondependent lung
regions may compress dependent lung regions, contributing
to a heterogeneous distribution of ventilation, as proposed by
Suarez-Sipmann and coworkers [18].
Available online />Page 11 of 13
(page number not for citation purposes)
The use of descending PEEP titration after a recruitment
manoeuvre to minimize Ers may be a practical approach to
establishing PEEP during controlled mechanical ventilation.
Ward and colleagues [15] showed that the process of select-
ing PEEP based on minimizing the Ers may be easier and
could be more frequently applied at the bedside than use of a
static pressure-volume curve. However, as described by Suter
and coworkers [32], the pressure at minimal Ers is dependent
and decreases with increasing V
T
. This volume dependence of
Ers could be minimized by using a fixed small V
T
(such as 5 to
6 ml/kg) during the titration protocol. This V
T
range is in
accordance with the current recommendations for a protective
ventilatory strategy [2,33] and is essential to minimize depend-
ence of Ers on V
T
and to prevent adjustment of PEEP to an
inadequate level.
The benefits of instituting high levels of PEEP appear to
depend on the pattern of lung injury distribution [4]. Our find-
ings recapitulate the radiological appearance of a diffuse pat-
tern of ALI/acute respiratory distress syndrome, which has
high recruitment potential [21,34]. Further research may be
required to determine the correspondence between Ers
dynamics and the pattern of aeration in lungs with a focal dis-
tribution, which have low recruitment potential and a large
amount of normally aerated areas [21,34].
In summary, continuous monitoring of the Ers, estimated using
least-squares linear regression, during a descending PEEP
titration after a recruitment manoeuvre apparently indicates
that PEEP
Ers
represents a balance between lung aeration and
mechanical stress. These findings support the proposal that
this technique, which is feasible at the bedside, may help to
prevent lung de-recruitment [18] and minimizes the coexist-
ence of poorly aerated and hyperinflated areas.
Study limitations
A limitation of the present study is that the lung morphological
analysis was based on a single slice of the CT scan taken at
the juxta-diaphragmatic level. One could question whether
such an image is truly representative of the whole lung. How-
ever, it could be argued that the amount of non-aerated areas
is likely to be well represented, because these areas are more
common near to the diaphragm [33,35]. The distribution of
hyperinflated areas appears to represent a discrete cephalo-
caudal gradient, as shown in Figure 5. It can also be observed
that the apex distribution of aeration was similar to the distri-
bution at the juxta-diaphragmatic level. The middle level (close
to the carina) exhibited fewer hyperinflated areas than the apex
and basal levels in one animal, which is probably attributable
to the presence of the heart-limiting lung expansion in nonde-
pendent regions [36]. Our data are in accordance with find-
ings recently reported by Karmrodt and coworkers [31]. In
pigs with ALI induced by oleic acid, those investigators
described only a small cephalo-caudal gradient of
hyperinflated areas at different levels of continuous positive
airways pressure.
The blood gas analyses were not conducted during PEEP
titration at each PEEP step. However, several studies suggest
that the amount of alveolar flooding, observed during morpho-
logical analyses of the CT scan images, exhibits an inverse
correlation with PaO
2
dynamics [28,37,38]. Additionally, in
surfactant-depleted piglets, Suarez-Sipmann and coworkers
[18] showed that as PEEP is reduced after a recruitment
manoeuvre, the PaO
2
/fractional inspired oxygen ratio
decreased with a concomitant augmentation of intrapulmonary
shunt fraction.
The effects of chest wall elastance were not measured in the
present study. However, in a similar model of ALI in piglets, de
Abreu and coworkers [39] showed that the chest wall
elastance made just a small contribution to the overall proper-
ties of the respiratory system. Additionally, the effects of the
nonphysiological supine position on the overall distribution of
aeration in piglets were not assessed in the present study.
However, it is expected that, as the lung injury was induced
with the animals in supine position, the primary lesion was
more likely to have occurred in dependent regions. In
accordance with this, Karmrodt and coworkers [31] showed,
in a similar oleic acid injury model, that non-aerated areas were
predominantly located in these dependent regions, and that
the weight of the heart also contributes to lung collapse in cau-
dal regions. Furthermore, those authors described a decrease
in non-aerated lung volume along the cranio-caudal axis at
high levels of airway pressure. These findings are apparently in
accordance with our data as well as with the effects of PEEP
on regional distribution of aeration in humans [21].
The temporal effect on lung stability was not accessed in the
present study. However, alveolar de-recruitment in oleic acid
injury models seems to occur during the first few moments of
expiration [28,29]. Based on this, we believe that complete
stabilization of lung compartments should have occurred by
the end of each PEEP step. Additionally, PEEP
Ers
obtained in
our protocol was near to that obtained in the work reported by
Suarez-Sipmann and coworkers [18], which used a 10 min
time interval for each PEEP step. In the present protocol, we
attempted to achieve a compromise was between the PEEP
step time interval and the total time required to perform the
entire PEEP titration, in order to make this manoeuvre useful in
clinical practice.
Conclusion
In an porcine model of ALI induced by oleic acid PEEP
Ers
,
obtained after a recruitment manoeuvre followed by descend-
ing PEEP titration, corresponded to the highest amount of nor-
mally aerated areas, with less poorly aerated and hyperinflated
areas, according to CT scan morphologic analysis. The institu-
tion of high levels of PEEP reduced the poorly aerated areas
Critical Care Vol 11 No 4 Carvalho et al.
Page 12 of 13
(page number not for citation purposes)
but also enlarged the hyperinflated areas. The reduction in
PEEP consistently increased poorly or non-aerated areas as
well as tidal re-aeration, especially at low PEEP (PEEP < 6
cmH
2
O). Hence, the PEEP
Ers
may be a useful aid to optimizing
lung aeration to minimize lung mechanical stress.
Competing interests
The authors declare that they have no competing interests.
Authors' contributions
ARSC, FCJ, FAB, FOA and JS participated in the design of the
study and carried out the experiments. ARSC processed the
data, performed the statistical analysis and wrote the manu-
script. AVP designed the experimental setup. RR established
the CT protocol and analysis. AGN and FCJ conceived and
coordinated the study, and helped to write the manuscript. All
authors read and approved the final manuscript.
Acknowledgements
João HN Soares helped during the anaesthetic procedure. This work
was partly supported by the Brazilian Agencies CNPq, CAPES and
FAPERJ.
References
1. Lassen H: A preliminary report on the 1952 epidemic of polio-
myelitis in Copenhagen with special reference to the treat-
ment of acute respiratory insufficiency. Lancet 1953, 1:37-41.
2. Dos Santos CC, Slutsky AS: Protective ventilation of patients
with acute respiratory distress syndrome. Crit Care 2004,
8:145-147.
3. Dos Santos CC, Slutsky AS: The contribution of biophysical
lung injury to the development of biotrauma. Annu Rev Physiol
2006, 68:585-618.
4. Rouby JJ, Lu Q, Goldstein I: Selecting the right level of positive
end-expiratory pressure in patients with acute respiratory dis-
tress syndrome. Am J Respir Crit Care Med 2002,
165:1182-1186.
5. Treggiari MM, Romand JA, Martin JB, Suter PM: Air cysts and
bronchiectasis prevail in nondependent areas in severe acute
respiratory distress syndrome: a computed tomographic
study of ventilator-associated changes. Crit Care Med 2002,
30:1747-1752.
6. Rouby JJ, Puybasset L, Nieszkowska A, Lu Q: Acute respiratory
distress syndrome: lessons from computed tomography of
the whole lung. Crit Care Med 2003, 31:S285-S295.
7. Takeuchi M, Goddon S, Dolhnikoff M, Shimaoka M, Hess DR,
Amato MB, Kacmarek RM: Set positive end-expiratory pressure
during protective ventilation affects lung injury. Anesthesiology
2002, 97:682-692.
8. Richard JC, Maggiore SM, Mercat A: Clinical review: bedside
assessment of alveolar recruitment. Crit Care 2004,
8:163-169.
9. Terragni PP, Rosboch GL, Lisi A, Viale AG, Ranieri VM: How res-
piratory system mechanics may help in minimising ventilator-
induced lung injury in ARDS patients. Eur Respir J 2003,
22:15S-21S.
10. Hickling KG: Best compliance during a decremental, but not
incremental, positive end-expiratory pressure trial is related to
open-lung positive end-expiratory pressure: a mathematical
model of acute respiratory distress syndrome lungs. Am J
Respir Crit Care Med 2001, 163:69-78.
11. Bernard GR: Acute respiratory distress syndrome: a historical
perspective. Am J Respir Crit Care Med 2005,
172:798-806.
12. Pesenti A, Tagliabue P, Patroniti N, Fumagalli R: Computerised
tomography scan imaging in acute respiratory distress
syndrome. Intensive Care Med 2001, 27:631-639.
13. Roth H, Luecke T, Deventer B, Joachim A, Herrmann P, Quintel M:
Pulmonary gas distribution during ventilation with different
inspiratory flow patterns in experimental lung injury: a com-
puted tomography study. Acta Anaesthesiol Scand 2004,
48:851-861.
14. Gattinoni L, Caironi P, Pelosi P, Goodman LR: What has com-
puted tomography taught us about the acute respiratory dis-
tress syndrome? Am J Respir Crit Care Med 2001,
164:1701-1711.
15. Ward NS, Lin DY, Nelson DL, Houtchens J, Schwartz WA, Klinger
JR, Hill NS, Levy MM: Successful determination of lower inflec-
tion point and maximal compliance in a population of patients
with acute respiratory distress syndrome. Crit Care Med 2002,
30:963-968.
16. Suh GY, Kwon OJ, Yoon JW, Park SJ, Ham HS, Kang SJ, Koh WJ,
Chung MP, Kim HJ: A practical protocol for titrating 'optimal'
PEEP in acute lung injury: recruitment maneuver and PEEP
decrement. J Korean Med Sci 2003, 18:349-354.
17. Carvalho AR, Jandre FC, Pino AV, Bozza FA, Salluh JI, Rodrigues
R, Soares JH, Giannella-Neto A: Effects of descending positive
end-expiratory pressure on lung mechanics and aeration in
healthy anaesthetized piglets. Crit Care 2006, 10:R122.
18. Suarez-Sipmann F, Bohm SH, Tusman G, Pesch T, Thamm O,
Reissmann H, Reske A, Magnusson A, Hedenstierna G: Use of
dynamic compliance for open lung positive end-expiratory
pressure titration in an experimental study. Crit Care Med
2006.
19. Vieira SR, Puybasset L, Richecoeur J, Lu Q, Cluzel P, Gusman PB,
Coriat P, Rouby JJ: A lung computed tomographic assessment
of positive end-expiratory pressure-induced lung
overdistension. Am J Respir Crit Care Med 1998,
158:1571-1577.
20. Suter PM, Fairley HB, Isenberg MD: Optimum end-expiratory air-
way pressure in patients with acute pulmonary failure. N Engl
J Med 1975, 292:284-289.
21. Puybasset L, Gusman P, Muller JC, Cluzel P, Coriat P, Rouby JJ:
Regional distribution of gas and tissue in acute respiratory
distress syndrome. III. Consequences for the effects of posi-
tive end-expiratory pressure. CT Scan ARDS Study Group.
Adult Respiratory Distress Syndrome. Intensive Care Med
2000, 26:1215-1227.
22. Dueck R: Alveolar recruitment versus hyperinflation: a balanc-
ing act. Curr Opin Anaesthesiol
2006, 19:650-654.
23. Karmrodt J, Bletz C, Yuan S, David M, Heussel CP, Markstaller K:
Quantification of atelectatic lung volumes in two different por-
cine models of ARDS. Br J Anaesth 2006, 97:883-895.
24. Marini JJ, Gattinoni L: Ventilatory management of acute respira-
tory distress syndrome: a consensus of two. Crit Care Med
2004, 32:250-255.
25. Schuster DP: Clinical lessons from an experimental model of
ARDS. Pediatr Pulmonol Suppl 1995, 11:104-105.
26. Schuster DP: ARDS: clinical lessons from the oleic acid model
of acute lung injury. Am J Respir Crit Care Med 1994,
149:245-260.
27. Schoene RB, Robertson HT, Thorning DR, Springmeyer SC,
Hlastala MP, Cheney FW: Pathophysiological patterns of reso-
Key messages
• Administration of PEEP, downward titrated after a
recruitment manoeuvre, may prevent cyclic recruitment/
de-recruitment.
• PEEP
Ers
represented a compromise between maximiz-
ing normally aerated areas and minimizing tidal recruit-
ment and hyperinflation.
• Lung stability may be obtained with high levels of PEEP
at the expense of hyperinflation of previously normally
aerated areas.
• The Ers is a feasible bedside index and may be useful in
selecting a PEEP level that balances lung aeration and
mechanical stress in lung injury.
Available online />Page 13 of 13
(page number not for citation purposes)
lution from acute oleic acid lung injury in the dog. J Appl
Physiol 1984, 56:472-481.
28. Neumann P, Berglund JE, Mondéjar EF, Magnusson A, Hedensti-
erna G: Effect of different pressure levels on the dynamics of
lung collapse and recruitment in oleic-acid-induced lung
injury. Am J Respir Crit Care Med 1998, 158:1636-1643.
29. Rouby JJ: Optimizing lung aeration in positive end-expiratory
pressure. Am J Respir Crit Care Med 2004, 170:1039-1040.
30. Dries DJ, Marini JJ: Optimized positive end-expiratory pressure:
an elusive target. Crit Care Med 2002, 30:1159-1160.
31. Carvalho ARS, Jandre FC, Pino AV, Rodrigues R, Bozza FA, Salluh
J, Lima Junior FA, Ascoli F, Giannella-Neta A: Correspondence
between CT morphological analysis and elastic mechanical
properties in normal and acute lung injury swine models. In
Annals of the 9th Congress of The World Federation of Societies
of Intensive and Critical Care Medicine 18–22 September 2005;
Buenos Aires, Argentina. Buenos Aires: LatinComm;
2005:146-146.
32. Suter PM, Fairley HB, Isenberg MD: Effect of tidal volume and
positive end-expiratory pressure on compliance during
mechanical ventilation. Chest 1978, 73:158-162.
33. Rouby JJ, Contantin JM, Girardi C, Zhang M, Qin Lu: Mechanical
Ventilation in patients with acute respiratory distress
syndrome. Anesthesiology 2004, 101:228-234.
34. Gattinoni L, Caironi P, Cressoni M, Chiumello D, Ranieri VM, Quin-
tel M, Russo S, Patroniti N, Cornejo R, Bugedo G: Lung recruit-
ment in patients with the acute respiratory distress syndrome.
N Engl J Med 2006, 354:1775-1786.
35. Rouby JJ, Lu Q: Bench-to-bedside review: adjuncts to mechan-
ical ventilation in patients with acute lung injury. Crit Care
2005, 9:465-471.
36. Bugedo G, Bruhn A, Hernández G, Rojas G, Varela C, Tapia JC,
Castillo L: Lung computed tomography during a lung recruit-
ment maneuver in patients with acute lung injury. Intensive
Care Med 2003, 29:218-225.
37. Rylander C, Högman M, Perchiazzi G, Magnusson A, Hedenstierna
G: Functional residual capacity and respiratory mechanics as
indicators of aeration and collapse in experimental lung injury.
Anesth Analg 2004, 98:782-789.
38. Neumann P, Berglund JE, Fernández Mondéjar E, Magnusson A,
Hedenstierna G: Dynamics of lung collapse and recruitment
during prolonged breathing in porcine lung injury. J Appl
Physiol 1998, 85:1533-1543.
39. de Abreu MG, Quelhas AD, Spieth P, Bräuer G, Knels L, Kasper
M, Pino AV, Bleyl JU, Hübler M, Bozza F, et al.: Comparative
effects of vaporized perfluorohexane and partial liquid vennti-
lation in oleic acid-induced lung injury. Anesthesiology 2006,
104:278-289.