Báo cáo y học: " Goal-directed fluid management based on pulse pressure variation monitoring during high-risk surgery: a pilot randomized controlled trial" pdf
Bạn đang xem bản rút gọn của tài liệu. Xem và tải ngay bản đầy đủ của tài liệu tại đây (303.98 KB, 9 trang )
Open Access
Available online />Page 1 of 9
(page number not for citation purposes)
Vol 11 No 5
Research
Goal-directed fluid management based on pulse pressure
variation monitoring during high-risk surgery: a pilot randomized
controlled trial
Marcel R Lopes
1
, Marcos A Oliveira
1
, Vanessa Oliveira S Pereira
1
, Ivaneide Paula B Lemos
1
,
Jose Otavio C Auler Jr
2
and Frédéric Michard
3
1
Department of Anesthesia and Critical Care, Santa Casa de Misericórdia de Passos, 164 rua Santa Casa, 37900-020, Passos, MG, Brazil
2
Department of Anesthesia and Critical Care, INCOR-University of São Paulo, 44 Dr. Enéas de Carvalho Aguiar Avenida, 05403-000, São Paulo, SP,
Brazil
3
Department of Anesthesia and Critical Care, Béclère Hospital – University Paris XI, 157 rue de la Porte de Trivaux, 92141, Clamart, France
Corresponding author: Frédéric Michard,
Received: 30 Apr 2007 Accepted: 7 Sep 2007 Published: 7 Sep 2007
Critical Care 2007, 11:R100 (doi:10.1186/cc6117)
This article is online at: />© 2007 Lopes et al.; licensee BioMed Central Ltd.
This is an open access article distributed under the terms of the Creative Commons Attribution License ( />),
which permits unrestricted use, distribution, and reproduction in any medium, provided the original work is properly cited.
Abstract
Introduction Several studies have shown that maximizing stroke
volume (or increasing it until a plateau is reached) by volume
loading during high-risk surgery may improve post-operative
outcome. This goal could be achieved simply by minimizing the
variation in arterial pulse pressure (ΔPP) induced by mechanical
ventilation. We tested this hypothesis in a prospective,
randomized, single-centre study. The primary endpoint was the
length of postoperative stay in hospital.
Methods Thirty-three patients undergoing high-risk surgery
were randomized either to a control group (group C, n = 16) or
to an intervention group (group I, n = 17). In group I, ΔPP was
continuously monitored during surgery by a multiparameter
bedside monitor and minimized to 10% or less by volume
loading.
Results Both groups were comparable in terms of demographic
data, American Society of Anesthesiology score, type, and
duration of surgery. During surgery, group I received more fluid
than group C (4,618 ± 1,557 versus 1,694 ± 705 ml (mean
±SD), P < 0.0001), and ΔPP decreased from 22 ± 75 to
9±1% (P < 0.05) in group I. The median duration of
postoperative stay in hospital (7 versus 17 days, P < 0.01) was
lower in group I than in group C. The number of postoperative
complications per patient (1.4 ± 2.1 versus 3.9 ± 2.8, P < 0.05),
as well as the median duration of mechanical ventilation
(1 versus 5 days, P < 0.05) and stay in the intensive care unit
(3 versus 9 days, P < 0.01) was also lower in group I.
Conclusion Monitoring and minimizing ΔPP by volume loading
during high-risk surgery improves postoperative outcome and
decreases the length of stay in hospital.
Trial registration NCT00479011
Introduction
Several reports [1-4] have shown that monitoring and maximiz-
ing stroke volume by volume loading during high-risk surgery
decreases the incidence of postoperative complications and
the length of stay in the intensive care unit (ICU) and in the
hospital. Unfortunately, this strategy has so far required the
measurement of stroke volume by a cardiac output monitor as
well as a specific training period for the operators [5].
By increasing pleural pressure, mechanical inspiration induces
cyclic variations in cardiac preload that may be turned into
cyclic changes in left ventricular stroke volume and arterial
pulse pressure (the difference between systolic and diastolic
pressure) [6]. The variation in arterial pulse pressure (ΔPP)
induced by mechanical ventilation is known to be a very accu-
rate predictor of fluid responsiveness; that is, of the position
on the preload/stroke volume relationship (the Frank-Starling
ASA = American Society of Anesthesiology; ΔPP = variation in arterial pulse pressure; HES = hydroxyethylstarch; ICU = intensive care unit.
Critical Care Vol 11 No 5 Lopes et al.
Page 2 of 9
(page number not for citation purposes)
curve) [7-11]. In brief, in patients operating on the flat portion
of the Frank-Starling curve (and hence insensitive to cyclic
changes in preload induced by mechanical ventilation), ΔPP is
low, and volume loading does not result in a significant
increase in stroke volume [6]. Conversely, in patients operat-
ing on the steep portion of the preload/stroke volume relation-
ship (and hence sensitive to cyclic changes in preload induced
by mechanical ventilation), ΔPP is high, and volume loading
leads to a significant increase in stroke volume [6]. By increas-
ing cardiac preload, volume loading induces a rightward shift
on the preload/stroke volume relationship and hence a
decrease in ΔPP. Patients who have reached the plateau of
the Frank-Starling relationship can be identified as patients in
whom ΔPP is low [6,12]. The clinical and intraoperative goal
of 'maximizing stroke volume by volume loading' can therefore
be achieved simply by minimizing ΔPP [12].
We performed the present study to investigate whether moni-
toring and minimizing ΔPP by volume loading during high-risk
surgery may improve postoperative outcome.
Materials and methods
Patients
After approval by the ethical committee of Santa Casa de Mis-
ericórdia de Passos (Passos, MG, Brazil) and written informed
consent, 33 patients undergoing high-risk surgery were
enrolled between 22 September 2005 and 23 January 2006
and randomized to either a control group (group C) or an inter-
vention group (group I). Patients were selected according to a
preoperative decision (by the surgeon and the intensivist) that
postoperative care would be undertaken in the ICU because
of co-morbidities or/and the surgical procedure. Patients less
than 18 years old, with cardiac arrhythmias, with a body mass
index of more than 40, or undergoing surgery with an open
thorax, neurosurgery or emergency surgery, were excluded.
Intraoperative monitoring
Heart rate, arterial pressure (radial arterial line, 20 gauge),
pulse oximetry, and capnography (Capnostat Mainstream CO
2
sensor, Respironics Inc., Murrysville, PA, USA) were moni-
tored in all patients during the surgical procedure with the use
of a multiparameter bedside monitor (DX 2020; Dixtal, São
Paulo, SP, Brazil). In patients in group I, the arterial pressure
curve was recorded via a specific module (IBPplus; Dixtal),
allowing the automatic calculation of ΔPP by the monitor as
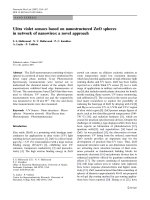
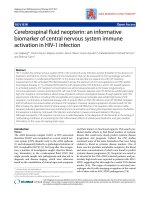
follows (Figure 1). Each respiratory cycle is identified from the
capnogram, systolic and diastolic arterial pressures are meas-
ured on a beat-to-beat basis, and pulse pressure is calculated
as the difference between systolic and diastolic pressure.
Maximum and minimum values for pulse pressure (PP
max
and
PP
min
, respectively) are determined over each respiratory
cycle, and ΔPP is calculated as a percentage as described
Figure 1
Automatic calculation of variation in arterial pulse pressure (ΔPP) from the recordings of arterial pressure and capnographic signals on a regular bed-side monitorAutomatic calculation of variation in arterial pulse pressure (ΔPP) from the recordings of arterial pressure and capnographic signals on a regular bed-
side monitor.
Available online />Page 3 of 9
(page number not for citation purposes)
originally [13]:
ΔPP = 100 × (PP
max
- PP
min
)/[(PP
max
+ PP
min
)/2]
The mean value of ΔPP is automatically calculated over three
consecutive floating periods of eight respiratory cycles, and
the median value of this triple determination is displayed on the
bedside monitor and updated after each new respiratory cycle
(Figure 1).
Protocol
Randomization was performed preoperatively by using sealed
envelopes. During the surgical procedure, patients were man-
aged in accordance with our institution's standard of care.
Group C received fluid intraoperatively at the discretion of the
anesthetist, whereas group I received additional hydroxyethyl-
starch 6% (HES) boluses to minimize and maintain ΔPP ≤
10%. This ΔPP cutoff value was chosen according to previous
reports showing that when ΔPP ≤ 10%, an increase in stroke
volume of 10% or more as a result of volume loading is very
unlikely [7-11,13]. During the postoperative period, both
groups were managed by intensivists (in the ICU), and clini-
cians (in the wards) not involved in the intraoperative manage-
ment or in data collection. These individuals were not informed
of patient allocation.
Data collection
Over the study period all data were collected prospectively
and patients were followed up until hospital discharge. Preop-
erative and intraoperative data collection was undertaken by
one of the investigators (VOSP), whereas postoperative data
collection was undertaken by another (IPBL), who was not
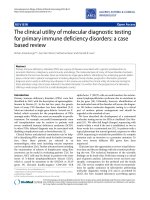
aware of the allocation group. Figure 2 shows the trial profile.
Before surgery, the sex, age, weight, height, history of renal
failure requiring dialysis or not, cirrhosis, chronic obstructive
pulmonary disease, hypertension, peripheral vascular disease,
coronary artery disease, other cardiac disease, diabetes melli-
tus, and cerebrovascular disease were recorded. The body
mass index was calculated according to the standard formula
(BMI = weight/height
2
). Serum creatinine concentration, pro-
thrombin time, hemoglobin concentration, and platelet con-
centration were obtained from routine preoperative biological
tests. During the surgical procedure, tidal volume, ventilatory
frequency, infused volume of crystalloid solutions, HES, and
blood products were recorded. Heart rate, mean arterial pres-
sure, percutaneous arterial oxygen saturation, and hemoglobin
concentration were collected both at the beginning and at the
end of the surgical procedure. The duration of surgery was
also recorded. After the surgical procedure, the following
parameters were collected both at admission to the ICU and
24 hours later: mean arterial pressure, heart rate, percutane-
ous arterial oxygen saturation. During the 24 hours after
admission to the ICU, venous lactate concentrations were
measured every 6 hours and the mean lactate value was cal-
culated over the first 24-hour period in the ICU. The need for
continuous vasoactive (dopamine or/and norepinephrine
(noradrenaline)) support was also recorded.
Postoperative ICU infections (pneumonia, abdominal, urinary
tract, line-related sepsis and wound infections), respiratory
complications (pulmonary embolism, acute lung injury, and
respiratory support for more than 24 hours exclusive of acute
lung injury), cardiovascular complications (arrhythmia, hypo-
tension, acute pulmonary edema, acute myocardial infarction,
stroke, and cardiac arrest exclusive of fatal outcome), abdom-
inal complications (Clostridium difficile diarrhea, acute bowel
obstruction, upper gastrointestinal bleed, and anastomotic
leak), hematologic complications (platelet count less than
100,000/μl or prothrombin time less than 50%), and renal
complications (urine output less than 500 ml/day or serum
creatinine more than 170 μmol/l or dialysis for acute renal fail-
ure) were collected in accordance with criteria used previously
by other investigators [3,14,15].
Statistical analysis
Data were analysed by comparing patients in group C with
those in group I on an intention-to-treat basis. The primary out-
come measure was the duration of postoperative stay in hos-
pital. On the basis of our own hospital registry, the mean
duration of postoperative stay in hospital in group C was a pri-
ori estimated at 16 ± 8 days (mean ± SD). In accordance with
previous publications [1,2], we postulated that the mean dura-
tion of postoperative stay in hospital in group I could be 35%
lower. A sample size of 33 patients in each group was calcu-
lated for a 0.05 difference (two-sided) with a power of 80%
[16]. An intermediate analysis after the enrolment of the first
33 patients was planned, to readjust the population sample
size if necessary. Secondary outcome measures were the
number of postoperative complications per patient, as well as
the duration of mechanical ventilation and stay in the ICU.
Figure 2
Trial profileTrial profile.
Critical Care Vol 11 No 5 Lopes et al.
Page 4 of 9
(page number not for citation purposes)
Results are expressed as mean ± SD, or as median [interquar-
tile ranges] for the duration of mechanical ventilation, stay in
the ICU, and stay in hospital. Comparisons between groups C
and I were performed with a non-parametric Mann-Whitney U
test (quantitative data) or a χ
2
test (qualitative data). In group
I, the effect of HES administration on ΔPP during surgery was
assessed with a non-parametric Wilcoxon rank-sum test. Lin-
ear correlations were tested by using the Spearman rank
method. A P value less than 0.05 was considered statistically
significant.
Results
Over the 4-month (22 September 2005 to 23 January 2006)
enrolment study period, 237 patients were admitted to our
medico-surgical ICU, 57 of these after a surgical procedure.
Among these 57 postoperative patients, 33 patients fulfilled
the inclusion criteria and agreed to participate in the study. Six-
teen patients were randomly assigned to group C and 17 to
group I (Figure 2). Thestudy was stopped after the intermedi-
ate analysis (33 patients enrolled) because we observed a sig-
nificant decrease in the length of stay in hospital (primary
endpoint) in group I.
Before surgery
Before surgery, the groups were comparable in terms of sex
ratio, age, weight, height, body mass index, American Society
of Anesthesiology (ASA) score, type of surgery, and preoper-
ative biological tests (Table 1). They were also comparable in
terms of co-morbidities, except in regard to peripheral vascular
disease, where the observed incidence was significantly
higher (P = 0.04) in group I.
During surgery
The duration of the surgical procedure, as well as respiratory
settings (tidal volume and ventilatory frequency) were compa-
rable in both groups (Table 2). During the surgical procedure,
the amount of HES and the total amount of fluid (including
crystalloid, HES, and blood products) was significantly greater
in group I than in group C (Table 2). None of the patients
received continuous vasoactive support during surgery. In
group I (ΔPP was not measured in group C), ΔPP decreased
significantly from 22 ± 7% to 9 ± 1% (mean ± SD; P <
0.0001) over the time frame of the surgical procedure, and
was 10% or less at the end of the surgical procedure in all
except four patients (range 7 to 11).
After surgery
On admission to the ICU, the mean arterial pressure was sig-
nificantly greater in group I (Table 3); 24 hours after admission
to the ICU, fewer patients required vasoactive support in
group I, and blood lactate was lower in this group (Table 3).
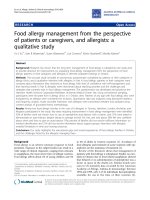
Postoperative complications are listed in Table 4. The number
of patients with postoperative complications is shown in Fig-
ure 3. Fewer patients developed complications in group I (7
patients (41%) versus 12 patients (75%), P = 0.049). The
number of complications per patient was lower in group I than
in group C (1.4 ± 2.1 per patient versus 3.9 ± 2.8 per patient,
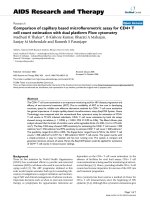
P = 0.015). The median [interquartile range] duration of
mechanical ventilation (1 [1 to 2] versus 5 [1 to 12] days, P <
0.05), stay in the ICU (3 [2 to 4] versus 9 [4.5 to 15.5] days,
P < 0.01), and stay in hospital (7 [6 to 8.25] versus 17 [8 to
20] days, P < 0.01) was significantly lower in group I than in
group C (Figure 4). Over the study period (until hospital
Table 1
Patients' characteristics before surgery
Characteristic Group
C (n = 16) I (n = 17)
Sex, M/F 12/4 11/6
Age (years) 62 ± 10 63 ± 16
Weight (kg) 68 ± 16 66 ± 16
Height (cm) 170 ± 8 164 ± 9
Body mass index (kg/
m
2
)
23 ± 4 24 ± 5
ASA II score 3 3
ASA III score 9 8
ASA IV score 4 6
Chronic disease
Renal failure
requiring dialysis
10
Renal failure
without dialysis
a
56
Cirrhosis 0 1
Chronic obstructive
pulmonary disease
68
Hypertension 13 13
Peripheral vascular
disease
39
b
Coronary artery
disease
13
Other cardiopathy 5 8
Diabetes mellitus 5 7
Cerebrovascular
disease
13
Preoperative biological
tests
Serum creatinine
(μmol/l)
124 ± 90 132 ± 55
Prothrombin time
(percentage)
87 ± 13 80 ± 19
Hemoglobin (g/dl) 11.3 ± 2.0 11.9 ± 2.5
Platelets (/μl) 305,000 ± 108,000 301,000 ± 110,000
ASA, American Society of Anesthesiology physical status; C, control;
I, intervention.
a
Serum creatinine more than 130 μmol/l;
b
P < 0.05,
control group versus intervention group.
Available online />Page 5 of 9
(page number not for citation purposes)
discharge), five patients died (on days 7, 11, 18, 19, and 26)
in group C, whereas two patients died (on days 7 and 22) in
group I (P = 0.171). In group C, the cause of death was septic
shock and ARDS in four cases (pneumonia n = 1, abdominal
sepsis n = 2, pneumonia and urosepsis n = 1), and acute pul-
monary edema in one case. In group I, the cause of death was
unexplained cardiac arrest in one case, and acute respiratory
failure in one case (tracheostomy complication). Because
death does influence the duration of mechanical ventilation,
the duration of stay in the ICU, and the duration of stay in hos-
pital, we also compared these parameters when considering
only survivors (n = 26). The median [interquartile range] dura-
tion of mechanical ventilation, stay in the ICU, and stay in hos-
pital was 1 [1 to 2] versus 2 [0.25 to 5.5] days (P = 0.29), 3
[2.25 to 4] versus 6 [3.25 to 11.75] days (P = 0.014), and 7
[6 to 8] versus 16 [7.5 to 20.25] days (P = 0.024) in survivors
of group I (n = 15) and group C (n = 11), respectively.
Discussion
Our study shows that monitoring and minimizing ΔPP by fluid
loading during high-risk surgery decreases the incidence of
postoperative complications and also the duration of mechan-
ical ventilation, stay in the ICU, and stay in hospital.
Hypovolemia can pass undetected before, during, and after
major surgery. Aside from the inevitable losses in the intraop-
erative period mainly due to bleeding, most patients are still
starved for a minimum of 6 hours preoperatively to reduce the
risk of acid aspiration syndrome. Additionally, patients under-
Table 2
Type of surgery, physiologic status, and fluid administered
during the surgical procedure
Parameter Group
C (n = 16) I (n = 17)
Type of surgery
Upper gastrointestinal 4 4
Hepato-biliary 2 3
Lower gastrointestinal 8 10
Urology 1 0
Other 1 0
Respiratory settings
Tidal volume (ml/kg) 9.1 ± 0.5 8.6 ± 0.6
Ventilatory frequency (/min) 13 ± 1 13 ± 1
Physiologic status at start of
surgery
Heart rate (/min) 66 ± 9 77 ± 17
Mean arterial pressure (mmHg) 96 ± 16 90 ± 18
SpO
2
(percentage) 97 ± 3 97 ± 3
ΔPP (percentage) 22 ± 7
Hemoglobin (g/dl) 11.3 ± 2.0 11.9 ± 2.5
Physiologic status at end of
surgery
Heart rate (/min) 86 ± 19 80 ± 17
Mean arterial pressure (mmHg) 68 ± 20 78 ± 14
SpO
2
(percentage) 97 ± 3 97 ± 3
ΔPP (percentage) 9 ± 1
a
Hemoglobin (g/dl) 9.8 ± 1.4 9.6 ± 1.6
Fluid administered
Volume of crystalloid infused
(ml)
1,563 ± 602 2,176 ± 1,060
Volume of colloid infused (ml) 0 2,247 ± 697
b
Volume of red blood cells
infused (ml)
131 ± 268 159 ± 320
Number of patients who
received red blood cells
45
Volume of FFP infused (ml) 0 35 ± 106
Number of patients who
received FFP
02
Total volume infused (ml) 1,694 ± 705 4,618 ± 1,557
b
Total volume infused (ml/kg per
hour)
7 ± 2 21 ± 8
b
Duration of surgery (hours) 3.7 ± 1.4 3.9 ± 2.0
SpO
2
, percutaneous arterial oxygen saturation; ΔPP, variation in
arterial pulse pressure; FFP, fresh frozen plasma; C, control; I,
intervention.
a
P < 0.05, end of surgery versus start of surgery;
b
P <
0.0001, control group versus intervention group.
Table 3
Hemodynamic and physiologic status on admission to ICU and
24 hours later
Status Group
C (n = 16) I (n = 17)
On admission to ICU
Mean arterial pressure (mmHg) 66 ± 20 80 ± 18
a
Heart rate (/min) 90 ± 18 85 ± 20
SpO
2
(percentage) 96 ± 4 96 ± 2
Lactate (mmol/l) 1.5 ± 1.1 1.1 ± 0.8
At 24 h after admission to ICU
Mean arterial pressure (mmHg) 80 ± 12 82 ± 11
Heart rate (/min) 92 ± 21 85 ± 18
SpO
2
(%) 97 ± 3 95 ± 3
Vasoactive support (n) 8 2
a
Lactate (mmol/l) 1.9 ± 1.1 0.7 ± 0.8
b
Mean lactate over 24 h (mmol/l) 2.4 ± 1.1 1.2 ± 0.4
c
ICU, intensive care unit; SpO
2
, percutaneous arterial oxygen
saturation; C, control; I, intervention.
a
P < 0.05,
b
P < 0.01,
c
P <
0.001, control group versus intervention group.
Critical Care Vol 11 No 5 Lopes et al.
Page 6 of 9
(page number not for citation purposes)
going abdominal surgery frequently receive bowel preparation,
another factor that may induce or worsen hypovolemia
[17,18]. In our study population, all patients undergoing bowel
surgery (n = 18) received a bowel preparation (2,000 ml of
mannitol solution per os) administered over a period of 2–3
hours and started 16 hrs before the surgical procedure, and
2,500 ml of glucose solution intravenously over the same
period. Other patients (n = 15) were starved for 12 hours
before the surgical procedure and received 1,500 ml of glu-
cose solution intravenously over this period. Classical cardio-
vascular parameters such as heart rate and arterial pressure
are poor indicators of volume status, and these were in the
normal range in both groups just before surgery. In contrast, in
comparison with values reported previously [7-11], preopera-
tive ΔPP values were quite high (in group I), suggesting that
some of our patients were probably hypovolemic at the begin-
ning of the surgical procedure.
Perioperative hypovolemia leading to poor organ perfusion is
thought to be a major factor in determining postoperative mor-
bidity after major surgery. Optimization of circulatory status
perioperatively was a concept first promulgated by Shoemaker
and colleagues [19]. They found a significant reduction in mor-
tality and stay in hospital in high-risk surgical patients receiving
fluid loading with or without dobutamine to increase cardiac
output and oxygen delivery to supranormal values. Compara-
ble results from other groups [20-22] using a similar goal-
directed approach lends further support to the importance of
avoiding hypovolemia and tissue oxygen debt perioperatively.
Instead of targeting a given threshold value of cardiac index or
of oxygen delivery during surgery, other authors have pro-
posed to guide intraoperative fluid administration by using indi-
vidual Frank-Starling curves [1-4,12,23]. Several studies have
shown that monitoring and maximizing stroke volume by fluid
loading (until stroke volume reaches a plateau, actually the pla-
teau of the Frank-Starling curve) during high-risk surgery is
associated with improved postoperative outcome [1-4]. The
benefit in using such a fluid strategy, guided by the continuous
esophageal Doppler measurement of stroke volume, was
established first in patients undergoing cardiac surgery [1] or
hip surgery [2], and was extended more recently to patients
undergoing major bowel or general surgery [3,4].
Intra-arterial blood pressure monitoring is common practice in
most patients undergoing high-risk surgery [24]. The assess-
ment of ΔPP is therefore a simple and cost-saving method in
Table 4
Postoperative complications
Complication Group
C (n = 16) I (n = 17)
Infection
Pneumonia 5 2
Abdominal 4 3
Urinary tract 1 0
Respiratory
Pulmonary embolism 1 0
Respiratory support > 24 h (exclusive of
acute lung injury)
65
Acute lung injury 5 1
Cardiovascular
Arrhythmia
a
63
Hypotension
a
11 3
Acute pulmonary edema 2 0
Cardiac arrest (exclusive of fatal
outcome)
10
Abdominal
Acute bowel obstruction 1 0
Upper gastrointestinal bleed 2 1
Anastomotic leak 1 0
Coagulopathy
Platelet count <100,000/μl
b
or
prothrombin time < 50%
c
64
Renal
Urine output < 500 ml/day or serum
creatinine > 170 μmol/l
d
or dialysis for
acute renal failure
11 1
Total number of complications 63 23
Number (percentage) of patients with
complications
12 (75) 7 (41)
C, control; I, intervention.
a
Requiring pharmacologic treatment;
b
if at
least 150,000/μl preoperatively;
c
if at least 70% preoperatively;
d
if
130 μmol/l or less preoperatively.
Figure 3
Numbers of patients with postoperative complications in the control and intervention groupsNumbers of patients with postoperative complications in the control
and intervention groups.
Available online />Page 7 of 9
(page number not for citation purposes)
comparison with technologies monitoring cardiac output or
oxygen delivery. Such a simple approach therefore has the
potential for widespread application because it is not routinely
feasible for anesthetists to monito cardiac output or oxygen
delivery in many institutions, as well as in many countries.
Our study has some limitations. First, this is a single-centre
trial, and local perioperative standard of care may have influ-
enced the results. There is no specific fluid protocol for high-
risk surgery in Santa Casa Misericordia hospital. Anesthetists
were free to use the type and the volume of fluid they consid-
ered necessary to maintain blood pressure during the surgical
procedure, and did not monitor central venous pressure. As a
result, group C did not receive HES and received much less
fluid than group I during the surgical procedure (the difference
between groups was 2,924 ml). The debate over correct intra-
operative fluid management is unresolved [23,25,26]. Indeed,
facing studies showing a benefit in optimizing stroke volume
and oxygen delivery by fluid loading, few studies have
conversely shown a benefit in fluid restriction [27-29]. For
instance, Nisanevich and colleagues [29] recently compared
the postoperative outcome of two groups of patients undergo-
ing abdominal surgery, a restrictive group (receiving 4 ml/kg of
crystalloid solution per hour during the surgical procedure)
and a liberal group (receiving a bolus of 10 ml/kg followed by
12 ml/kg per hour during surgery). Patients in the restrictive
group received an average total volume of 1,230 ml during the
surgical procedure, whereas those in the liberal group
received 3,670 ml (that is, 2,440 ml more). The number of
patients with complications was smaller in the restrictive
group, as was the duration of postoperative stay in hospital.
Although the study populations are not comparable (ASA
scores were higher in our study), it is interesting to note that
the total amount of fluid received intraoperatively by our con-
trol group (7 ml/kg per hour) was higher than the volume of
fluid received by the restrictive group (4 ml/kg per hour) of
Nisanevich's study [29].
The mortality rate was high in our control group, but we must
bear in mind that it was calculated from a small patient popu-
lation and that most of our patients had many co-morbidities
(ASA score was 3 or more in all except six patients; that is, in
82% of our study population). Moreover, it was consistent with
mortality rates of patients undergoing high-risk surgery
reported previously in Brazil [21,30]. In Europe or in the USA,
high-risk surgery mortality rates are usually lower [3,4,15,22],
although mortality rates up to 22% [20] and 34% [19] have
also been reported. In this respect, our findings strongly sug-
gest that an intraoperative goal-directed fluid therapy based
on ΔPP monitoring is useful for improving outcome at least in
our institution, but caution should be exercised before extrap-
olating our findings to other patient populations or to other
institutions in which standard perioperative fluid management
may be different.
The morbidity was high in our patients, with an incidence of
postoperative complications of 41% and 75% in groups I and
C, respectively. The overall management of our patients may
have contributed, at least in part, to this finding. However, one
must point out that the incidence of postoperative complica-
tions is also directly influenced by the number of complications
collected. We used a very extensive list of postoperative com-
plications, including infectious, respiratory, cardiovascular,
and abdominal complications proposed recently by Pearse
and colleagues [15], as well as hematologic and renal compli-
cations proposed by Bennett-Guerrero and colleagues [14]
and Gan and colleagues [3]. Finally, the incidence of postop-
erative complications in our study was comparable to the inci-
dence reported by Pearse and colleagues [15] in a recent
study investigating the value of postoperative optimization in
patients undergoing high-risk surgery (44% in the optimization
group versus 68% in the control group).
The small number of patients enrolled in this study is also a lim-
itation. Although patients were randomized, we observed that
the groups were not comparable in terms of peripheral vascu-
lar disease (the incidence was higher in group I). If this finding
could not be an advantage to group I, in which a better out-
come was finally reported, it indicates the risk of imbalance
between the groups as a result of the small sample size. In this
regard, because we did not measure ΔPP in the control group,
we cannot definitely exclude the possibility that ΔPP might
have been different between groups C and I at the beginning
of surgery. Our results therefore merit confirmation on a larger
scale, and ideally on a multicentre basis. Such a trial is cur-
rently ongoing in several hospitals in São Paulo, Brazil. In con-
Figure 4
Box-and-whiskers representation of the duration (days) of mechanical ventilation (MV), stay in the intensive care unit (ICU), and stay in hospi-tal in the control and intervention groupsBox-and-whiskers representation of the duration (days) of mechanical
ventilation (MV), stay in the intensive care unit (ICU), and stay in hospi-
tal in the control and intervention groups. The line inside a box denotes
the median, the limits of the box denote the 75th centile of the data,
and the whiskers represent the 90th centile of the data.
Critical Care Vol 11 No 5 Lopes et al.
Page 8 of 9
(page number not for citation purposes)
trast, the fact that we observed significant differences
between the outcomes of two small groups of patients empha-
sizes the potential value of using ΔPP to tailor fluid administra-
tion during high-risk surgery, and the likelihood of observing
similar differences in larger populations of patients.
Finally, because ΔPP is directly influenced by the magnitude of
cyclic changes in pleural pressure induced by mechanical
inspiration, it cannot be recommended as a guide to fluid
administration in patients who are not mechanically ventilated
with regular tidal volume (for example patients undergoing sur-
gery under regional anesthesia) or when chest compliance is
abnormally increased (for example during open chest surgery)
or decreased (for example in morbidly obese patients) [6]. In
this regard, it must be noted that these populations were
excluded from the present study, as were patients with cardiac
arrhythmia, in whom ΔPP cannot be evaluated [31].
Conclusion
Our study shows that monitoring and minimizing ΔPP by vol-
ume loading during high-risk surgery decreases the number of
postoperative complications and also the duration of mechan-
ical ventilation, stay in the ICU, and stay in hospital. Thus, ΔPP
may serve as a simple tool for improving the outcome of
patients undergoing high-risk surgery. Further studies are
required to confirm the results of our pilot study on a larger
scale, as well as in different settings.
Competing interests
The named authors declare that they have no conflict of inter-
est. Dixtal had no role in the study design, data collection, data
analysis, data interpretation, or writing of the report.
Authors' contributions
FM, MRL, and JOCA participated in the trial design. VOSP
and IPBL obtained the data. MRL, FM, and MAO participated
in the data analysis and interpretation of the results. FM and
MRL were involved in the statistical analysis and wrote the
paper. All authors read and approved the final manuscript.
Acknowledgements
The authors thank Maria De Amorim (Paris, France) and Julia Fukushima
(São Paulo, SP, Brazil) for help in data analysis, Dr Julia Wendon (Lon-
don, UK) for reviewing the manuscript, and Dixtal (Sao Paulo, SP, Brazil)
for providing the software for the automatic calculation of ΔPP.
References
1. Mythen MG, Webb AR: Perioperative plasma volume expan-
sion reduces the incidence of gut mucosal hypoperfusion dur-
ing cardiac surgery. Arch Surg 1995, 130:423-429.
2. Sinclair S, James S, Singer M: Intraoperative intravascular vol-
ume optimisation and length of hospital stay after repair of
proximal femoral fracture: a randomised controlled trial. BMJ
1997, 315:909-912.
3. Gan TJ, Soppitt A, Maroof M, El-Moalem H, Robertson KM, Moretti
E, Dwane P, Glass PSA: Goal-directed intraoperative fluid
administration reduces length of hospital stay after major
surgery. Anesthesiology 2002, 97:820-826.
4. Wakeling HG, McFall MR, Jenkins CS, Woods WGA, Miles WFA,
Barclay GR, Fleming SC: Intraoperative oesophageal Doppler
guided fluid management shortens postoperative hospital
stay after major bowel surgery. Br J Anaesth 2005,
95:634-642.
5. Lefrant JY, Bruelle P, Aya AG, Saissi G, Dauzat M, de La Coussaye
JE, Eledjam JJ: Training is required to improve the reliability of
esophageal Doppler to measure cardiac output in critically ill
patients. Intensive Care Med 1998, 24:347-352.
6. Michard F: Changes in arterial pressure during mechanical
ventilation. Anesthesiology 2005, 103:419-428.
7. Michard F, Boussat S, Chemla D, Anguel N, Mercat A, Lecarpen-
tier Y, Richard C, Pinsky MR, Teboul JL: Relation between respi-
ratory changes in arterial pulse pressure and fluid
responsiveness in septic patients with acute circulatory
failure. Am J Respir Crit Care Med 2000, 162:134-138.
8. Bendjelid K, Suter PM, Romand JA: The respiratory change in
preejection period: a new method to predict fluid
responsiveness. J Appl Physiol 2004, 96:337-342.
9. Kramer A, Zygun D, Hawes H, Easton P, Ferland A: Pulse pres-
sure variation predicts fluid responsiveness following coro-
nary artery bypass surgery. Chest 2004, 126:1563-1568.
10. De Backer D, Heenen S, Piagnerelli M, Koch M, Vincent JL: Pulse
pressure variations to predict fluid responsiveness: influence
of tidal volume. Intensive Care Med 2005, 31:517-523.
11. Solus-Biguenet H, Fleyfel M, Tavernier B, Kipnis E, Onimus J,
Robin E, Lebuffe G, Decoene C, Pruvot FR, Vallet B: Non-invasive
prediction of fluid responsivenss during major hepatic
surgery. Br J Anaesth 2006, 97:808-816.
12. Michard F, Lopes MR, Auler JOC Jr: Pulse pressure variation:
beyond the fluid management of patients with shock. Crit
Care 2007, 11:131.
13. Michard F, Chemla D, Richard C, Wysocki M, Pinsky MR, Lecar-
pentier Y, Teboul JL: Clinical use of respiratory changes in arte-
rial pulse pressure to monitor the hemodynamic effects of
PEEP. Am J Respir Crit Care Med 1999, 159:935-939.
14. Bennett-Guerrero E, Welsby I, Dunn TJ, Young LR, Wahl TA, Diers
TL, Phillips-Bute BG, Newman MF, Mythen MG: The use of a
postoperative morbidity survey to evaluate patients with pro-
longed hospitalization after routine, moderate-risk, elective
surgery. Anesth Analg 1999, 89:514-519.
15. Pearse R, Dawson D, Fawcett J, Rhodes A, Grounds RM, Bennett
ED: Early goal-directed therapy after major surgery reduces
complications and duration of hospital stay. A randomised,
controlled trial. Crit Care 2005, 9:R687-R693.
16. Schulz KF, Grimes DA: Sample size calculations in randomised
trials: mandatory and mystical. Lancet 2005, 365:1348-1353.
17. Holte K, Nielsen KG, Madsen JL, Kehlet H: Physiologic effects of
bowel preparation. Dis Colon Rectum 2004, 47:1397-1402.
18. Junghans T, Neuss H, Strohauer M, Raue W, Haase O, Schink T,
Schwenk W: Hypovolemia after traditional preoperative care in
patients undergoing colonic surgery is underrepresented in
conventional hemodynamic monitoring. Int J Colorectal Dis
2006, 21:693-697.
19. Shoemaker WC, Appel PL, Kram HB, Waxman K, Lee TS: Pro-
spective trial of supranormal values of survivors as therapeu-
tic goals in high-risk surgical patients. Chest 1988,
94:1176-1186.
20. Boyd O, Grounds M, Bennett ED: A randomized clinical trial of
the effect of deliberate perioperative increase of oxygen deliv-
ery on mortality in high-risk surgical patients. JAMA 1993,
270:2699-2707.
21. Lobo SMA, Salgado PF, Castillo VG, Borim AA, Polachini CA, Pal-
chetti JC, Brienzi SLA, de Oliveira GG: Effects of maximizing
Key messages
• Monitoring and minimizing arterial pulse pressure varia-
tion (ΔPP) by volume loading during high-risk surgery
decreases the duration of stay in hospital.
• This goal-directed strategy is also useful in decreasing
the number of postoperative complications, as well as
the duration of mechanical ventilation and stay in the
ICU.
Available online />Page 9 of 9
(page number not for citation purposes)
oxygen delivery on morbidity and mortality in high-risk surgi-
cal patients. Crit Care Med 2000, 28:3396-3404.
22. Kern JW, Shoemaker WC: Meta-analysis of hemodynamic opti-
mization in high-risk patients. Crit Care Med 2002,
30:1686-1692.
23. Spahn DR, Chassot PG: CON: fluid restriction for cardiac
patients during major noncardiac surgery should be replaced
by goal-directed intravascular fluid administration. Anesth
Analg 2006, 102:344-346.
24. Buhre W, Rossaint R: Perioperative management and monitor-
ing in anaesthesia. Lancet 2003, 362:1839-1846.
25. Joshi GP: Intraoperative fluid restriction improves outcome
after major elective gastrointestinal surgery. Anesth Analg
2005, 101:601-605.
26. Boldt J: Fluid management of patients undergoing abdominal
surgery – more questions than answers. Eur J Anaesth 2006,
23:631-640.
27. Kita T, Mammoto T, Kishi Y: Fluid management and postopera-
tive respiratory disturbances in patients with transthoracic
esophagectomy for carcinoma. J Clin Anesth 2002,
14:252-256.
28. Brandstrup B, Tonnesen H, Beier-Holgersen R, Hjortso E, Ording
H, Lindorff-Larsen K, Rasmussen MS, Lanng C, Wallin L, the Dan-
ish Study Group on Perioperative Fluid Therapy: Effects of intra-
venous fluid restriction on postoperative complications:
comparison of two perioperative fluid regimens. Ann Surg
2003, 238:641-648.
29. Nisanevich V, Felsenstein I, Almogy G, Weissman C, Einav S,
Matot I: Effect of intraoperative fluid management on outcome
after intraabdominal surgery. Anesthesiology 2005, 103:25-32.
30. Lobo SM, Lobo FR, Polachini CA, Patini DS, Yamamoto AE, de
Oliveira NE, Serrano P, Sanches HS, Spegiorin MA, Queiroz MM,
et al.: Prospective, randomized trial comparing fluids and dob-
utamine optimization of oxygen delivery in high-risk surgical
patients. Crit Care 2006, 10:R72.
31. Michard F: Volume management using dynamic parameters:
the good, the bad, and the ugly. Chest 2005, 128:
1902-1903.