System Analysis, Design, and Development Concepts, Principles, and Practices phần 9 potx
Bạn đang xem bản rút gọn của tài liệu. Xem và tải ngay bản đầy đủ của tài liệu tại đây (2.55 MB, 84 trang )
We exercise the simulations over a variety of OPERATING ENVIRONMENT scenarios and con-
ditions. Results are analyzed and compiled and documented in an Architecture Trade Study. The
Architecture Trade Study rank orders the results as part of its recommendations. Based on a review
of the Architecture Trade Study, SEs select an architecture. Once the architecture is selected, the
simulation serves as the framework for evaluation and refining each simulated architectural entity
at lower levels of abstraction.
Application 2: Simulation-Based Architectural
Performance Allocations
Modeling and simulation are also employed to perform simulation-based performance allocations
as illustrated in Figure 51.2. Consider the following example:
EXAMPLE 51.9
Suppose that Requirement A describes and bounds Capability A. Our initial analysis derives three subordinate
capabilities, A1 through A3, that are specified and bounded by Requirements A1 through A3: The challenge
is: How do SEs allocate Capability A’s performance to Capabilities A1 through A3?
Let’s assume that basic analysis provides us with an initial set of performance allocations that is “in the
ballpark.” However, the interactions among entities are complex and require modeling and simulation to
support performance allocation decision making. We construct a model of the Capability A’s architecture to
investigate the performance relationships and interactions of Entities A1 through A3.
Next, we construct the Capability A simulation consisting of models, A1 through A3, representing
subordinate Capabilities A1 through A3. Each supporting capability, A1 through A3, is modeled using the
System Entity Capability Construct shown in Figure 22.1. The simulation is exercised for a variety of stimuli,
cues, or excitations using Monte Carlo methods to understand the behavior of the interactions over a range of
operating environment scenarios and conditions. The results of the interactions are captured in the system
behavioral response characteristics.
51.5 Application Examples of Modeling and Simulation
659
Entity
A
Entity
A
Entity
B
Entity
B
Entity
C
Entity
C
Entity
A
Entity
A
Entity
B
Entity
B
Entity
D
Entity
D
Entity
E
Entity
E
Candidate Architecture #n
Candidate Architecture #1
Simulation
#1
Simulation
#1
Simulation
#n
Simulation
#n
Architecture
Trade Study
Architectural
Selection
Recommendations
#1 Architecture #3
#2 Architecture #1
#3 Architecture #2
1
2
3
4
5
6
Figure 51.1 Simulation-Based Architecture Selection
Simpo PDF Merge and Split Unregistered Version -
After several iterations to optimize the interactions, SEs arrive at a final set of performance allocations
that become the basis for requirements specifications for capability A. Is this perfect? No! Remember, this is
a human approximation or estimate. Due to variations in physical components and the OPERATING ENVI-
RONMENT, the final simulations may still have to be calibrated, aligned, and tweaked for field operations
based on actual field data. However, we initiated this process to reduce the complexity of the solution space
into more manageable pieces. Thus, we arrived at a very close approximation to support requirements’ allo-
cations without having to go to the expense of developing the actual working hardware and software.
Application 3: Simulation-Based Acquisition (SBA)
Traditionally, when an Acquirer acquired a system or product, they had to wait until the System
Developer delivered the final system for Operational Test and Evaluation (OT&E) or final accept-
ance. During OT&E the User or an Independent Test Agency (ITA) conducts field exercises to eval-
uate system or product performance under actual OPERATING ENVIRONMENT conditions.
Theoretically there should be no surprises. Why?
1. The System Performance Specification (SPS) perfectly described and bounded the well-
defined solution space.
2. The System Developer created the ideal physical solution that perfectly complies with the
SPS.
In REALITY every system design solution has compromises due to the constraints imposed.
Acquirers and User(s) of a system need a level of confidence “up front” that the system will perform
as intended. Why? The cost of developing large complex systems, for example, and ensuring that
they meet User validated operational needs is challenging.
One method for improving the chances of delivery success is simulation-based acquisition
(SBA). What is SBA? In general, when the Acquirer releases a formal Request for Proposal (RFP)
solicitation for a system or product, a requirement is included for each Offeror to deliver a working
simulation model along with their technical proposal. The RFP stipulates criteria for meeting a
660
Chapter 51 System Modeling and Simulation
Entity A1 Model Entity A2 Model Entity A3 Model
Capability A
Simulation
Stimulus, Cue,
or Excitation
System Behavioral
Response
Characteristic
Requirement A
(Capability A)
Requirement A
(Capability A)
Derived Reqmt. A1
(Capability A1)
Derived Reqmt. A1
(Capability A1)
Derived Reqmt. A2
(Capability A2)
Derived Reqmt. A2
(Capability A2)
Derived Reqmt. A3
(Capability A3)
Derived Reqmt. A3
(Capability A3)
Entity
A1
Entity
A1
Entity
A2
Entity
A2
Entity
A3
Entity
A3
Capability A Architecture
P
erformance
Allocations
Requirement
Derivations
Acceptable Range of Inputs
1
2
3
4
5
6
7
8
Figure 51.2 Simulation-Based Performance Allocations
Simpo PDF Merge and Split Unregistered Version -
prescribed set of functionality, interface and performance requirements. To illustrate how SBA is
applied, refer to Figure 51.3.
EXAMPLE 51.10
Let’s suppose a User has an existing system and decides there is a need to replace a SUBSYSTEM such as a
propulsion system. Additionally, an Existing System Simulation is presently used to investigate system per-
formance issues.
The User selects an Acquirer to procure the SUBSYSTEM replacement. The Acquirer releases an RFP
to a qualified set of Offerors, competitors A through n. In response to RFP requirements, each Offeror
delivers a simulation of their proposed system or product to support the evaluation of their technical proposal.
On delivery, the Acquirer Source Selection Team evaluates each technical proposal using predefined
proposal evaluation criteria. The Team also integrates the SUBSYSTEM simulation into the Existing System
Simulation for further technical evaluation.
During source selection, the offeror’s technical proposals and simulations are evaluated. Results of the
evaluations are documented in a Product Acquisition Trade Study. The TSR provides a set of Acquisition Rec-
ommendations to the Source Selection Team (SST), which in turn makes Acquisition Recommendations to a
Source Selection Decision Authority (SSDA).
Application 4: Test Environment Stimuli
System Integration, Test, and Evaluation (SITE) can be a very expensive element of system devel-
opment, not only from its labor intensiveness but also the creation of the test environment inter-
faces to the unit under test (UUT). There are several approaches SEs can employ to test a UUT.
The usual system integration, test, and evaluation (SITE) options include: 1) stimulation, 2) emu-
lation, and 3) simulation. The simulations in this context are designed to reproduce external system
interfaces to the (UUT). Refer to Figure 51.4.
51.5 Application Examples of Modeling and Simulation 661
Entity
A
Entity
A
Entity
B
Entity
B
Entity
C
Existing System Simulation
Competitor A
Competitor A
Competitor “n”
Competitor B
Competitor B
Product A
Product A
Product B
Product B
Product C
OR
Product
Acquisition
Trade Study
Report
Acquisition
Recommendations
#1 Product #3
#2 Product #n
#3 Product #1
……….
#n Product #2
Candidate
Performance
Evaluations
2
3
1
6
7
4
5
Priority
Figure 51.3 Simulation-Based Acquisition (SBA)
Simpo PDF Merge and Split Unregistered Version -
Application 5: Simulation-Based Failure Investigations
Large complex systems often require simulations that enable decision makers to explore dif-
ferent aspects of performance in employing the system or product in a prescribed OPERATING
ENVIRONMENT.
Occasionally, these systems encounter an unanticipated failure mode that requires in-depth
investigation. The question for SEs is: What set of system/operator actions or conditions and
use case scenarios contributed to the failure? Was the root cause due to: 1) latent defects, design
flaws, or errors, 2) reliability of components, 3) operational fatigue, 4) lack of proper mainte-
nance, 5) misuse, abuse, or misapplication of the system from its intended application, or 6) an
anomaly?
Due to safety and other issues, it may be advantageous to explore the root cause of the
FAILURE using the existing simulation. The challenge for SEs is being able to:
1. Construct the chain of events leading to the failure.
2. Reliably replicate the problem on a predictable basis.
A decision could be made to use the simulation to explore the probable cause of the failure mode.
Figure 51.5 illustrates how you might investigate the cause of failure.
Let’s assume that a System Failure Report (1) documents the OPERATING ENVIRONMENT
scenarios and conditions leading to a failure event. It includes a maintenance history record among
the documents. Members of the failure analysis team extract the Operating Conditions and Data
(2) from the report and incorporate actual data and into the Existing System Simulation (3). SEs
perform analyses using Validated Field Data (4)—among which are the instrument data and a
metallurgical analysis of components/residues—and they derive additional inputs and make valid
assumptions as necessary.
662 Chapter 51 System Modeling and Simulation
Unit Under
Test (UUT)
Unit Under
Test (UUT)
Physical
Interfacing
Entity
• Hardware
• Software
Physical
Interfacing
Entity
• Hardware
• Software
Simulated
Interfacing
Entity
Simulated
Interfacing
Entity
Emulated
Interfacing
Entity
Emulated
Interfacing
Entity
OR
OPERATING
ENVIRONMENT
REPRESENTATION
Stimulation
Emulation
Simulation
1
3
5
Figure 51.4 Stimulation, Emulation, and Simulation Testing Options
Simpo PDF Merge and Split Unregistered Version -
The failure analysis team explores all possible actions and rules out probable causes using
Monte Carlo simulations and other methods. As with any failure mode investigation, the approach
is based on the premise that all scenarios and conditions are suspect until they are ruled out by a
process of fact-based elimination. Simulation Results (7) serve as inputs to a Failure Modes and
Effects Analysis (FMEA) (8) that compares the results the scenarios and conditions identified in
the System Failure Report (1). If the results are not predictable (9), the SEs continue to Refine the
Model/Operations (10) until they are successful in duplicating the root cause on a predictable basis.
Application 6: Simulation-Based Training
Although simulations are used as analytical tools for technical decision making, they are also used
to train system operators. Simulators are commonly used for air and ground vehicle training. Figure
51.6 provides an illustrative example.
For these applications, simulators are developed as deliverable instructional training devices
to provide the look and feel of actual systems such as aircraft. As instructional training devices,
these systems support all phases of training including:1) briefing, 2) mission training, and 3) post-
mission debriefing. From an SE perspective, these systems provide a Human-in-the Loop (HITL)
training environment that includes:
1. Briefing Stations (3) support trainee briefs concerning the planned missions and mission
scenarios.
2. Instructor/Operator Stations (IOS) (5) control the training scenario and environment.
3. Target System Simulation (1) simulates the physical system the trainee is being trained to
operate.
4. Visual Systems (8) generate and display (9) (10) simulated OPERATING
ENVIRONMENTS.
5. Databases (7) support visual system environments.
6. Debrief Stations (3) provide an instructional replay of the training mission and results.
51.5 Application Examples of Modeling and Simulation 663
Entity
A
Entity
A
Entity
B
Entity
B
Entity
C
Entity
C
Existing System Simulation
System
Failure
Report
Operating
Conditions
& Data
Operating
Conditions
& Data
Parameter A
Acceptable Range of Inputs
Parameter “n”
Acceptable Range of Inputs
Failure Modes, &
Effects Analysis
(FMEA)
Failure Modes, &
Effects Analysis
(FMEA)
Predictable
Results?
Refine Model/
Operations
Refine Model/
Operations
Failure Modes
& Effects Data
Validated Field
Data
Validated Field
Data
No
Yes
1
2
5
6
3
89
10
4
11
Initial
State
Simulation
Results
7
Final
State
Figure 51.5 Simulation-Based Failure Mode Investigations
Simpo PDF Merge and Split Unregistered Version -
Training Simulator Implementation. In general, there are several types of training
simulators:
• Fixed Platform Simulators Provide static implementation and use only visual system
motion and cues to represent dynamic motion of the trainee.
• Motion System Simulators Employ one-, two-, or three-axis six-degree-of-freedom (6
DOF) motion platforms to provide an enhanced realism to a simulated training session.
One of the challenges of training simulation development is the cost related to hardware and soft-
ware. Technology advances sometimes outpace the time required to develop and delivery new
systems. Additionally, the capability to create an immersive training environment that transcends
the synthetic and physical worlds is challenging.
One approach to these challenges is to develop a virtual reality simulator. What is a virtual
reality simulation?
• Virtual Reality Simulation The employment of physical elements such as helmet visors
and sensory gloves to psychologically immerse a subject in an audio, visual, and haptic feed-
back environment that creates the perception and sensation of physical reality.
Application 7: Test Bed Environments for
Technical Decision Support
When we develop systems, we need early feedback on the downstream impacts of technical deci-
sions. While methods such as breadboards, brassboards, rapid prototyping, and technical demon-
strations enable us to reduce risk, the reality is that the effects of these decisions may not be known
until the System Integration, Test, and Evaluation (SITE) Phase. Even worse, the cost to correct
any design flaws or errors in these decisions or physical implementations increases significantly as
a function of time after Contract Award.
664 Chapter 51 System Modeling and Simulation
Instructor/
Operator
Station (IOS)
Instructor/
Operator
Station (IOS)
Physical System
Interface Device(s)
• Trainee Station(s)
• Operator Station(s)
Physical System
Interface Device(s)
• Trainee Station(s)
• Operator Station(s)
Instructor
Instructor
SYSTEM OF
INTEREST
(SOI)
Simulation
SYSTEM OF
INTEREST
(SOI)
Simulation
Trainee(s)
Trainee(s)
Brief/
Debrief
Station(s)
Brief/
Debrief
Station(s)
Image
Generation
System
Image
Generation
System
Visual
Projection
System
Visual
Projection
System
Simulated
Imagery
Visual Imagery and Cues
Trainee Responses
System
Responses/
Haptic Feedback
Simulation
Parameters &
Control
Simulation Inputs
& Control
Simulation
Stimuli &
Responses
Instruction and Communications
Playback
Scenarios
Simulation
Databases
Visual Database
Other
Databases
Visual
Data Visual Data
Projected
Images
1
2
3
4 5
6
7
8 9
10
Physical
Motion
Devices
Figure 51.6 Simulation-Based Training
Simpo PDF Merge and Split Unregistered Version -
From an engineering perspective, it would be desirable to evolve and mature models, or pro-
totypes of a laboratory “working system,” directly into the deliverable system. An approach such
as this provides continuity of:
1. The evolving system design solution and its element interfaces.
2. Verification of those elements.
The question is: HOW can we implement this approach?
One method is to create a test bed. So, WHAT is a Test Bed and WHY do you need one?
Test Bed Development Environments. A test bed is an architectural framework and ENVI-
RONMENT that allows simulated, emulated, or physical components to be integrated as “working”
representations of a physical SYSTEM or configuration item (CI) and be replaced by actual com-
ponents as they become available. IEEE 610.12 (1990) describes a test bed as “An environment
containing the hardware, instrumentation, simulators, software tools, and other support elements
needed to conduct a test.”
Test beds may reside in environmentally controlled laboratories and facilities, or they may be
implemented on mobile platforms such as aircraft, ships, and ground vehicles. In general, a test
bed serves as a mechanism that enables the virtual world of modeling and simulation to transition
to the physical world over time.
Test Bed Implementation. A test bed is implemented with a central framework that integrates
the system elements and controls the interactions as illustrated in Figure 51.7. Here, we have a Test
Bed Executive Backbone (1) framework that consists of Interface Adapters (2), (5), (10) that serve
as interfaces to simulated or actual physical elements, PRODUCTS A through C.
During the early stages of system development, PRODUCTS A, B, and C are MODELED and
incorporated into simulations: Simulation A (4); Simulations B1 (7), B2 (9), B3 (8); and Simulation
51.5 Application Examples of Modeling and Simulation 665
Simulation
C
Simulation
C
Physical
Device C
PRODUCT C
Interface
Adapter
Interface
Adapter
Interface
Adapter
Interface
Adapter
Testbed
Executive
Backbone
Testbed
Executive
Backbone
Simulation
A
Simulation
A
Physical
Device A
Interface
Adapter
Interface
Adapter
PRODUCT A
PRODUCT B
Subsystem
B1
Subsystem
B3
Subsystem
B2
Subsystem
Simulation B3
Subsystem
Simulation B3
Subsystem
Simulation B2
Subsystem
Simulation B2
Subsystem
Simulation B1
Subsystem
Simulation B1
3
1
2
10
11
5
6
7
8 9
Where: = Simulated Interface
= Physical Interface
4
12
Figure 51.7 Simulation Testbed Approach to System Development
Simpo PDF Merge and Split Unregistered Version -
C (12). The objective is to investigate critical operational or technical issues (COIs/CTIs) and facil-
itate technical decision making. These initial simulations may be of LOW to MEDIUM fidelity. As
the system design solution evolves, HIGHER fidelity models may be developed to replace the lower
fidelity models, depending on specific requirements.
As PRODUCTS A, B, and C or their subelements are physically implemented as prototypes,
breadboards, brassboards, and the like, the physical entities may replace simulations A through C
as plug-and-play modules. Consider the following example:
EXAMPLE 51.11
During the development of PRODUCT B, SUBSYSTEMS B1 through B3 may be implemented as Simula-
tion B1, B2, and B3. At some point in time SUBSYSTEM B2 is physically prototyped in the laboratory. Once
the SUBSYSTEM B2 physical prototype reaches an acceptable level of maturity, Simulation B2 is removed
and replaced by the SUBSYSTEM B2 prototype. Later, when the SUBSYSTEM B2 developer delivers the
verified physical item, the SUBSYSTEM B2 prototype is replaced with the deliverable item.
In summary, a test bed provides a controlled framework with interface “stubs” that enable devel-
opers to integrate—“plug-and-play”—functional models, simulations, or emulations. As physical
hardware (HWCI) and software configuration items (CSCIs) are verified, they replace the models,
simulations, or emulations. Thus, over time the test bed evolves from an initial set of functional
and physical models and simulation representations to a fully integrated and verified system.
Reasons That Drive the Need for a Test Bed. Throughout the System Development and the
Operation and Support (O&S) phases of the system/product life cycle, SEs are confronted with
several challenges that drive the need for using a test bed. Throughout this decision-making process,
a mechanism is required that enables SEs to incrementally build a level of confidence in the evolv-
ing system architecture and design solution as well as to support field upgrades after deployment.
Under conventional system development, breadboards, brassboards, rapid prototypes, and tech-
nology demonstrations are used to investigate COIs/CTIs. Data collected from these decision aids
are translated into design requirements—as mechanical drawings, electrical assembly drawings and
schematics, and software design, for example.
The translation process is prone to human errors; however, integrated tool environments min-
imize the human translation errors but often suffer from format compatibility problems. Due to dis-
continuities in the design and component development workflow, the success of these decisions
and implementation may not be known until the System Integration, Test, and Evaluation (SITE)
Phase.
So, how can a test bed overcome these problems? There are several reasons why test beds can
facilitate system development.
Reason 1: Performance allocation–based decision making. When we engineer and develop
systems, recursive application of the SE Process Model requires informed, fact-based
decision making at each level of abstraction using the most current data available.
Models and simulations provide a means to investigate and analyze performance and
system responses to OPERATING ENVIRONMENT scenarios for a given set of
WHAT IF assumptions. The challenge is that models and simulations are ONLY as
GOOD as the algorithmic representations used and validated based on actual field
data measurements.
Reason 2: Prototype development expense. Working prototypes and demonstrations provide
mechanisms to investigate a system’s behavior and performance. However, full pro-
666 Chapter 51 System Modeling and Simulation
Simpo PDF Merge and Split Unregistered Version -
totypes for some systems may be too risky due to the MATURITY of the technology
involved and expense, schedule, and security issues. The question is: Do you have
incur the expense of creating a prototype of an entire system just to study a part of it?
Consider the following example:
EXAMPLE 51.12
To study an aerodynamic problem, you may not need to physically build an entire aircraft. Model a “piece”
of the problem for a given set of boundary conditions.
Reason 3: System component delivery problems. Despite insightful planning, programs often
encounter late vendor deliveries. When this occurs SITE activities may severely
impact contract schedules unless you have a good risk mitigation plan in place. SITE
activities may become bottlenecked until a critical component is delivered. Risk mit-
igation activities might include some form of representation—simulation, emulation,
or stimulation—of the missing component to enable SITE to continue to avoid inter-
rupting the overall program schedule.
Reason 4: New technologies. Technology drives many decisions. The challenge SEs must answer
is:
1. Is a technology as mature as its literature suggests.
2. Is this the RIGHT technology for this User’s application and longer term needs.
3. Can the technology be seamlessly integrated with the other system components with minimal
schedule impact.
So a test bed enables the integration, analysis, and evaluation of new technologies without expos-
ing an existing system to unnecessary risk. For example, new engines for aircraft.
Reason 5: Post deployment field support. Some contracts require field support for a specific
time frame following system delivery during the System Operations and Support
(O&S) Phase. If the Users are planning a series of upgrades via builds, they have a
choice:
1. Bear the cost of operating and maintaining a test article(s) of a fielded system for assess-
ing incremental upgrades to a fielded configuration.
2. Maintain a test bed that allows the evaluation of configuration upgrades.
Depending on the type of system and its complexity, test beds can provide a lower cost solution.
Synthesizing the Challenges. In general, a test bed provides for plug-and-play simulations of
a configuration items (CIs) or the actual physical component. Test beds are also useful for work
arounds because they can minimize SITE schedule problems. They can be used to:
• Integrate early versions of an architectural configuration that is populated with simulated
model representations (functional, physical, etc.) of configuration items (CIs).
• Establish a plug-and-play working test environment with prototype system components
before an entire system is developed.
• Evaluate systems or configuration items (CIs) to be represented by simulated or emulated
models that can be replaced by higher fidelity models and ultimately by the actual physical
configuration item (PCI).
51.5 Application Examples of Modeling and Simulation 667
Simpo PDF Merge and Split Unregistered Version -
• Apply various technologies and alternative architectural and design solutions for configu-
ration items (CIs).
• Assess incremental capability and performance upgrades to system field configurations.
Evolution of the Test Bed. Test beds evolve in a number of different ways. Test beds may be
operated and maintained until the final deliverable system completes SITE. At that point actual
systems serve as the basis for incremental or evolutionary development. Every system is different.
So assess the cost–benefits of maintaining the test bed. All or portions of the test bed may be
dismantled, depending on the development needs as well as the utility and expense of maintenance.
For some large complex systems, it may be impractical to conduct WHAT IF experiments on
the ACTUAL systems in enclosed facilities due to:
1. Physical space requirements.
2. Environmental considerations.
3. Geographically dispersed development organizations.
In these cases it may be practical to keep a test bed intact. This, in combination with the capabil-
ities of high-speed Internet access, may allow geographically dispersed development organizations
to conduct work with a test bed without having to be physically colocated with the actual system.
51.6 MODELING AND SIMULATION
CHALLENGES AND ISSUES
Although modeling and simulation offer great opportunities for SEs to exploit technology to under-
stand the problem and solution spaces, there are also a number of challenges and issues. Let’s
explore some of these.
Challenge 1: Failure to Record Assumptions and Scenarios
Modeling and simulation requires establishing a base set of assumptions, scenarios, and operating
conditions. Reporting modeling and simulation results without recording and noting this informa-
tion in technical reports and briefings diminishes the integrity and credibility of the results.
Challenge 2: Improper Application of the Model
Before applying a model to a specific type of decision support task, the intended application of the
model should be verified. There may be instances where models do not exist for the application.
You may even be confronted with a model that has only a degree of relevance to the application.
If this happens, you should take the relevancy into account and apply the results cautiously. The
best approach may be to adapt the current model.
Challenge 3: Poor Understanding of
Model Deficiencies and Flaws
Models and simulations generally evolve because an organization has an operational need to satisfy
or resolve. Where the need to resolve critical operational or technical issues (COIs/CTIs) is imme-
diate, the investigator may only model a segment of an application or “piece of the problem.” Other
Users with different needs may want to modify the model to satisfy their own “segment” needs.
Before long, the model will evolve through a series of undocumented “patches,” and then docu-
mentation accuracy and configuration control become critical issues.
668
Chapter 51 System Modeling and Simulation
Simpo PDF Merge and Split Unregistered Version -
To a potential user, such a model may have risks due to potential deficiencies or shortcomings
relative to the User’s application. Additionally, undiscovered design flaws and errors may exist
because parts of the model have not been exercised. Beware of this problem. Thoroughly investi-
gate the model before selecting it for usage. Locate the originator of the model, assuming they can
be located or are available. ASK the developers WHAT you should know about the model’s per-
formance, deficiencies, and flaws that may be untested and undocumented.
Challenge 4: Model Portability
Models tend to get passed around, patched, and adapted. As a result, configuration and version
control becomes a critical issue. Maintenance and configuration management of models and sim-
ulations and their associated documentation is very expensive. Unless an organization has a need
to use a model for the long term, the item may go onto a shelf. While the physics and logic of the
model may remain constant over time, the execution of the model on newer computer platforms
may be questionable. This often necessitates migration of the model to a new computer system at
a significant cost.
Challenge 5: Poor Model and Simulation Documentation
Models tend to be developed for specific rather than general applications. Since models and sim-
ulations are often nondeliverable items, documentation tends to get low priority and is often inad-
equate. Management decision making often follows a “do we put $1.00 into making the M&S better
or do we place $1.00 into documenting the product” mindset. Unless the simulation is a deliver-
able, the view is that it is only for internal use and so minimal documentation is the strategy.
Challenge 6: Failure to Understand Model Fidelity
Every model and simulation has a level of fidelity that characterizes its performance and quality.
Understand what level of fidelity you need, investigate the level of fidelity of the candidate model,
and make a determination of utility of the model to meet your needs.
Challenge 7: Undocumented Features
Models or simulations developed as laboratory tools typically are not documented with the level
of discipline and scrutiny of formal deliverables. For this reason a model or simulation may include
undocumented “features” that the developer forgot to record because of the available time, budgets
cuts, and the like. Therefore, you may think that you can easily reuse the model but discover that
it contains problem areas. A worst-case scenario is believing and planning to use a model only to
discover deficiencies when you are “too far down the stream” to pursue an alternative course of
action.
51.7 GUIDING PRINCIPLES
In summary, the preceding discussions provide the basis with which to establish the guiding prin-
ciples that govern modeling and simulation practices.
Principle 51.1 Model fidelity resides in the User’s mind. HIGH fidelity to one person may be
MEDIUM fidelity to a second person and LOW fidelity to a third person.
Principle 51.2 “All models are wrong but some are useful.” [George E.P. Box (1979) p. 202]
51.7 Guiding Principles 669
Simpo PDF Merge and Split Unregistered Version -
51.8 SUMMARY
In our discussion of modeling and simulation practices we identified, defined, and addressed various types of
models and simulations. We also addressed the implementation of test beds as evolutionary “bridges” that
enable the virtual world of modeling and simulation to evolve to the physical world.
GENERAL EXERCISES
1. Answer each of the What You Should Learn from This Chapter questions identified in the Introduction.
2. Refer to the list of systems identified in Chapter 2. Based on a selection from the preceding chapter’s
General Exercises or a new system selection, apply your knowledge derived from this chapter’s topical
discussions. If you were the Acquirer of the system:
(a) Are there critical operational and technical issues (COIs/CTIs) that drive the need to employ models
and simulations to support system development? Identify the issues.
(b) What elements of the system require modeling and simulation?
(c) Would a test bed facilitate development of this system? HOW?
(d) What requirements would you levy on a contractor in terms of documenting a model or simulation?
(e) What strategy would you validate the model or simulation?
(f) Could the models be employed as part of the deliverables operational system?
(g) What types of system upgrades do you envision for the evolution of this system? How would a test
bed facilitate evaluation of these upgrades?
ORGANIZATIONAL CENTRIC EXERCISES
1. Research your organization’s command media concerning modeling and simulation practices.
(a) What requirements and guidance are provided?
(b) What requirements are imposed on documenting models and simulations?
2. How are models and simulations employed in your line of business and programs?
3. Contact small, medium, and large contract programs within your organization.
(a) How do they employ models and simulations in their technical decision-making processes?
(b) What types of models do they use?
(c) How did the program employ models and simulations (in architectural studies, performance alloca-
tions, etc.)?
(d) What experiences have they had in external model documentation or developing documentation for
models developed internally?
(e) What lessons learned in the employment and application of models and simulations do they suggest?
(f) Do the programs employ test beds or use test beds of other external organizations?
(g) Did the contract require delivery of any models or simulations used as contract line items (CLINs)? If
so, what Contract Data Requirements List (CDRL) items were required, and when?
REFERENCES
670 Chapter 51 System Modeling and Simulation
DoD 5000.59-M. 1998. DoD Modeling and Simulation
(M&S) Glossary. Washington, DC: Department of
Defense. (DoD).
DSMC. 1998. Simulation Based Acquisition: A New
Approach. Defense System Management College
(DSMC) Press Ft. Belvoir, VA.
IEEE Std 610.12-1990. 1990. IEEE Standard Glossary of
Software Engineering Terminology. New York: Institute
of Electrical and Electronic Engineers (IEEE).
Kossiakoff, Alexander, and Sweet, William N. 2003.
Systems Engineering Principles and Practice. New York:
Wiley-InterScience.
Simpo PDF Merge and Split Unregistered Version -
Additional Reading 671
ADDITIONAL READING
Frantz, Frederick K. 1995. A Taxonomy of Model
Abstraction Techniques. Computer Sciences Corporation.
Proceedings of the 27th Winter Simulation Conference.
DSMC. 1998. Simulation Based Acquisition: A New
Approach. Defense System Management College
(DSMC) Press Ft. Belvoir, VA.
Lewis, Jack W. 1994. Modeling Engineering Systems. Engi-
neering Mentor series. Solana Beach, CA: HighText Pub-
lications.
Simpo PDF Merge and Split Unregistered Version -
Chapter 52
Trade Study Analysis
of Alternatives
52.1 INTRODUCTION
The engineering and development of systems requires SEs to identify and work through a large
range of critical operational and technical issues (COIs/CTIs). These issues range from the minis-
cule to the complex, requiring in-depth analyses supported by models, simulations, and prototypes.
Adding to the complexity, many of these decisions are interrelated. How can SEs effectively work
through these issues and keep the program on schedule?
This section answers this question with a discussion of trade study analysis of Alternatives
(AoA). We:
1. Explore WHAT a trade study is and how it relates to a trade space.
2. Introduce a methodology for conducting a trade study.
3. Define the format for a Trade Study Report (TSR).
4. Suggest recommendations for presenting trade study results.
5. Investigate challenges, issues, and risks related to performing trade studies.
We conclude with a discussion of trade study issues that SEs need to be prepared to address.
What You Should Learn from This Chapter
1. What is a trade study?
2. What are the attributes of a trade study?
3. How are trade studies conducted?
4. Who is responsible for conducting trade studies?
5. When are trade studies conducted?
6. Why do you need to do trade studies?
7. What is a trade space?
8. What methodology is used to perform a trade study?
9. How do you select trade study decision factors/criteria and weights?
10. What is a utility function?
11. What is a sensitivity analysis?
System Analysis, Design, and Development, by Charles S. Wasson
Copyright © 2006 by John Wiley & Sons, Inc.
672
Simpo PDF Merge and Split Unregistered Version -
52.1 Introduction 673
12. What is the work product of a trade study?
13. How do you document, report, and present trade study results?
14. What are some of the issues and risks in conducting a trade study?
Definitions of Key Terms
• Conclusion A reasoned opinion derived from a preponderance of fact-based findings and
other objective evidence.
• Decision Criteria Attributes of a decision factor. For example, if a decision factor is main-
tainability, decision criteria might include component modularity, interchangeability, acces-
sibility, and test points.
• Decision Factor A key attribute of a system, as viewed by Users or stakeholders, that has
a major influence on or contribution to a requirement, capability, critical operational, or
technical issue (COI/CTI) being evaluated. Examples include elements of technical per-
formance, cost, schedule, technology, and support.
• Finding A commonsense observation supported by in-depth analysis and distillation of facts
and other objective data. One or more findings support a conclusion.
• Recommendation A logically reasoned plan or course of action to achieve a specific
outcome or results based on a set of conclusions.
• Sensitivity Analysis “A procedure for testing the robustness of the results of trade-off analy-
sis by examining the effect of varying assigned values of the decision criteria on the result
of the analysis.” (Source: Kossiakoff and Sweet, System Engineering, p. 453)
• Trade Space An area of evaluation or interest bounded by a prescribed set of boundary
constraints that serve to scope the set of acceptable candidate alternatives, options, or choices
for further trade study investigation and analysis.
• Trade Study “An objective evaluation of alternative requirements, architectures, design
approaches, or solutions using identical ground rules and criteria.” (Source: former
MIL-STD-499)
• Trade Study Report (TSR) A document prepared by an individual or team that captures
and presents key considerations—such as objectives, candidate options, and methodology—
used to recommend a prioritized set of options or course of action to resolve a critical oper-
ational or technical issue.
• Utility Function A linear or nonlinear characteristic profile or value scale that represents
the level of importance different stakeholders place on a system or entity attribute or capa-
bility relative to constraints established by a specification.
• Utility Space An area of interest bounded by minimum and/or maximum performance cri-
teria established by a specification or analysis and a degree of utility within the performance
range.
• Viable Alternative A candidate approach that is qualified for consideration based on its
technical, cost, schedule, support, and risk level merits relative to decision boundary
conditions.
Trade Study Semantics
Marketers express a variety of terms to Acquirers and Users that communicate lofty goals that SEs
aspire to achieve. Terms include best solution, optimal solution, preferred solution, solution of
choice, ideal solution, and so on. Rhetorically speaking:
Simpo PDF Merge and Split Unregistered Version -
• HOW do we structure a course of action to know when we have achieved a “best solution”?
• WHAT is a “preferred” solution? Preferred by WHOM?
These questions emphasize the importance of structuring a course of action that enables us to arrive
at a consensus of what these terms mean. The mechanism for accomplishing this course of action
is a trade study, which is an analysis of alternatives (AoA).
To better understand HOW trade studies establish a course of action to achieve lofty goals,
let’s begin by establishing the objectives of a trade study:
52.2 TRADE STUDY OBJECTIVES
The objectives of a trade study are to:
1. INVESTIGATE a critical operational or technical issue (COI/CTI).
2. IDENTIFY VIABLE candidate solutions.
3. EXPLORE the fact-based MERITS of candidate solutions relative to decision criteria
derived from stakeholder requirements—via the contract, Statement of Objectives (SOO),
specification requirements, user interviews, cost, or schedules.
4. PRIORITIZE solution recommendations.
In general, COIs/CTIs are often too complex for most humans to internalize all of the technical
details on a personal level. Adding to the complexity are the interdependencies among the
COIs/CTIs. Proper analysis requires assimilation and synthesis of large complex data sets to arrive
at a preferred approach that has relative value or merit to the stakeholders such as Users, Acquirer,
and System Developer. The solution to this challenge is to conduct a trade study that consists of a
structured analysis of alternatives (AoA).
Typical Trade Study Decision Areas
The hierarchical decomposition of a system into entities at multiple levels of abstraction and selec-
tion of physical components requires a multitude of technical and programmatic decisions. Many
of these decisions are driven by the system design-to/for objectives and resource constraints.
Referral For more information about system development objectives, refer to Chapter 35 on
System Design To/For Objectives.
If we analyze the sequences of many technical decisions, categories of trade study areas emerge
across numerous system, product, or service domains. Although every system, product, or service
is unique and has to be evaluated on its own merits, most system decisions can be characterized
using Figure 52.1. Specifically, the large vertical box in the center of the graphic depicts the top-
down chain of decisions common to most entities regardless of system level of abstraction.
Beginning at the top of the center box, the decision sequences include:
• Architecture trades
• Interface trades including human-machine interfaces
• Hardware/software (HW/SW) trades
• Commercial off-the-shelf (COTS)/nondevelopmental item (NDI)/new development trades
• HW/SW component composition trades
• HW/SW process and methods trades
• HW/SW integration and verification trades
674
Chapter 52 Trade Study Analysis of Alternatives
Simpo PDF Merge and Split Unregistered Version -
52.2 Trade Study Objectives 675
This chain of decisions applies to entities at every system level of abstraction—from SYSTEM, to
PRODUCT, to SUBSYSTEM, and so forth, as illustrated by the left facing arrows. SEs employ
decision aids to support these decisions, such as analyses, prototypes, mock-ups, models, simula-
tions, technology demonstrations, vendor data, and their own experience, as illustrated by the box
shown at the right-hand side. The question is: HOW are the sequences of decisions accomplished?
Trade Studies Address Critical Operational/
Technical Issues (COIs/CTIs)
The sequence of trade study decisions represents a basic “line of questioning” intended to facili-
tate the SE design solution of each entity.
1. What type of architectural approach enables the USER to best leverage the required system,
product, or service capabilities and levels of performance?
2. Given an architecture decision, what is the best approach to establish low risk, interoper-
able interfaces or interfaces to minimize susceptibility or vulnerability to external system
threats?
3. How should we implement the architecture, interfaces, capabilities, and levels of perform-
ance? Equipment? Hardware? Software? Humans? Or a combination of these?
4. What development approach represents a solution that minimizes cost, schedule, and
technical risk? COTS? NDI? Acquirer furnished equipment (AFE)? New development?
A combination of COTS, NDI, AFE, and new development?
5. Given the development approach, what should the composition of the HWCI or CSCI be in
terms of hardware components or software languages, as applicable?
6. For each HWCI, CSCI, or HWCI/CSCI component, what processes and methods should be
employed to design and develop the entity?
7. Once the HWCI, CSCI, or HWCI/CSCI components are developed, how should they be inte-
grated and verified to demonstrate full compliance?
Architecture Trades
Interface Trades
Hardware/Software
Trades
COTS/NDI/New
Development Trades
HW/SW Component
Composition Trades*
HW/SW Process &
Methods Trades
SYSTEM Level
SYSTEM Level
SEGMENT Level
SEGMENT Level
PRODUCT Level
PRODUCT Level
SUBSYSTEM Level
SUBSYSTEM Level
ASSEMBLY Level
ASSEMBLY Level
SUBASSEMBLY
Level
SUBASSEMBLY
Level
PART Level
PART Level
System Levels of Abstraction
Typical Trade Decisions at Every
System Level of Abstraction
HW/SW Integration
& Verification Trades
Decision Aids
• Analyses
•Prototypes
• Mockups
• Models
• Simulations
• Demonstrations
• Vendor Data
• Legacy Programs
Decision Aids
• Analyses
• Prototypes
• Mockups
• Models
• Simulations
• Demonstrations
• Vendor Data
• Legacy Programs
Data
1
2
3
4
5
6
7
Requirements
Recommendations
Requirements
Figure 52.1 Typical Trade Study Decision Sequences
Simpo PDF Merge and Split Unregistered Version -
We answer these questions through a series of technical decisions. A trade study, as an analysis of
alternatives (AoA), provides a basis for comparative evaluation of available options based on a
predefined set of decision criteria.
52.3 SEQUENCING TRADE STUDY DECISION DEPENDENCIES
Technical programs usually have a number of COIs/CTIs that must be resolved to enable progres-
sion to the next decision in the chain of decisions. If we analyze the sequences of these issues, we
discover that the process of decision making resembles a tree structure over time. Thus, the branches
of the structure represent decision dependencies as illustrated in Figure 52.2.
During the proposal phase of a program, the proposal team conducts preliminary trade studies
to rough out key design decisions and issues that require more detailed attention after Contract
Award (CA). These studies enable us to understand the COI or CTI to be resolved after CA. Addi-
tionally, thorough studies provide a level of confidence in the cost estimate, schedule, and risk—
leading to an understanding of the problem and solution spaces.
Author’s Note 52.1 Depending on the type of program/contract, a trade study tree is often
helpful to demonstrate to a customer that you have a logical decision path toward a timely system
design solution.
52.4 SYSTEM ARCHITECTURAL ELEMENT TRADE STUDIES
Once an entity’s problem and solution space(s) are understood, one of the first tasks a team has to
perform is to select an architecture. Let’s suppose you are leading a team to develop a new type of
vehicle. What are the technical decisions that have to be made? We establish a hierarchy of vehicle
architecture elements as illustrated in Figure 52.3.
676
Chapter 52 Trade Study Analysis of Alternatives
Architecture
Trades
Architecture A
Architecture A
Interface Trades
Interface Type 1
Interface Type 2
Interface Type 2
Hardware/Software
Trades
Hardware
Hardware
Software
COTS/NDI
Components
New Development
New Development
COTS/NDI/
New Development
Trades
Material X
Material X Material Y
HW/SW
Process & Methods
Trades
Method A
Method B
Method B Method C
HW/SW
Integration &
Verification Trades
I & V Approach A
I & V Approach A I & V Approach B
HW/SW Component
Composition Trades
Decision Flow Within Each System Level and Entity
Decision Flow Within Each System Level and Entity
Trade Study
Trade Study
Trade Study
Selection Decision
Architecture B Architecture C
Selection Decision
Trade Study
Trade Study
Selection Decision
Selection Decision
Trade Study
Selection Decision
Unacceptable Requirements
Unacceptable Requirements
Trade Study
1
2
3
4
5
6
7
Personnel
COTS/NDI/New
Development
Combination
Selection Decision
Figure 52.2 Typical Trade Study Decision Tree
Simpo PDF Merge and Split Unregistered Version -
52.5 Understanding the Prescribed Trade Space 677
Self-Propelled, Mobile
Vehicle System
Self-Propelled, Mobile
Vehicle System
Vehicle
Frame
Vehicle
Frame
Propulsion
System
Propulsion
System
Crew/Passenger
Compartment
Environment
Crew/Passenger
Compartment
Environment
Cargo/
Payload
Cargo/
Payload
Security
System
Security
System
Guidance,
Navigation, &
Control (GN&C)
System
Guidance,
Navigation, &
Control (GN&C)
System
Communications
System
Communications
System
Lighting
System
Lighting
System
Wheel
System
Wheel
System
Ingress/
Egress
Systems
Ingress/
Egress
Systems
Energy
Transfer
System
Energy
Transfer
System
Visual
Systems
Visual
Systems
Figure 52.3 Mobile Vehicle Trade Study Areas Example
Each of these elements involves a series of technical decisions that form the basis for subse-
quent, lower level decisions. Additionally decisions made in one element as part of the SE process
may have an impact on one or more other elements. Consider the following example:
EXAMPLE 52.1
Cargo/payload constraints influence decision factors and criterion used in the Propulsion System trades—
involving technology and power; vehicle frame trades—involving size, strength, and materials; wheel system
trades—involving type and braking; and other areas as well.
52.5 UNDERSTANDING THE PRESCRIBED TRADE SPACE
Despite the appearance that trade study efforts have the freedom to explore and evaluate options,
there are often limiting constraints. These constraints bound the area of study, investigation, or
interest. In effect the bounded area scopes what is referred to as the trade space.
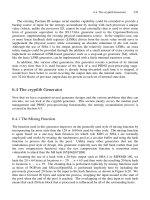
The Trade Space
We illustrate the basic trade space by the diagram in Figure 52.4. Let’s assume that the System
Performance Specification (SPS) identifies specific measures of performance (MOPs) that can be
aggregated into a minimum acceptable level of performance—by a figure of merit (FOM)—as noted
by the vertical gray line. Marketing analyses or the Acquirer’s proposal requirements indicate there
is a per unit cost ceiling as illustrated by the horizontal line. If we focus on the area bounded by
the minimum acceptable performance (vertical line), per unit cost ceiling (horizontal line), and
cost–performance curve, the bounded area represents the trade space.
Now suppose that we conduct a trade study to evaluate candidate Solutions 1, 2, 3, and 4. We
construct the cost–performance curve. To ensure a level of objectivity, we normalize the per unit
cost ceiling to the Acquirer maximum requirement. We plot cost and relative performance of each
of the candidate Solutions 1, 2, 3, and 4 on the cost–performance curve.
By inspection and comparison of plotted cost and technical performance relative to required
performance:
Simpo PDF Merge and Split Unregistered Version -
678 Chapter 52 Trade Study Analysis of Alternatives
• Solutions 1 and 4 fall outside the trade space.
• Solution 1 is cost compliant but technically noncompliant.
• Solution 4 is technically compliant but cost noncompliant.
When this occurs, the Trade Study Report (TSR) documents that Solutions 1 and 4 were consid-
ered and determined by analysis to be noncompliant with the trade space decision criteria and were
eliminated from consideration.
Following elimination of Solutions 1 and 4, Solutions 2 and 3 undergo further analysis to thor-
oughly evaluate and score other considerations such as organizational risk.
Optimal Solution Selection
The previous discussion illustrates the basic concept of a two-dimensional trade space. A trade
space, however, is multidimensional. For this reason it is more aptly described as a multidimen-
sional trade volume that encompasses technical, life cycle cost, schedule, support, and risk deci-
sion factors.
We can illustrate the trade volume using the graphic shown in Figure 52.5. To keep the diagram
simple, we constrain our discussion to a three-dimensional model representing the convolution of
technical, cost, and schedule factors. Let’s explore each dimension represented by the trade volume.
• Performance–Schedule Trade Space The graphic in the upper left-hand corner of the
diagram represents the performance vs. schedule trade space. Identifier 1 marks the location
of the selected performance versus schedule solution.
• Performance–Cost Trade Space The graphic in the upper right-hand corner includes
represents the performance–cost trade space. Identifier 2 marks the location of the selected
performance versus cost solution.
• Cost–Schedule Trade Space The graphic in the lower right-hand corner of the diagram rep-
resents the Cost–Schedule trade space. Identifier 3 marks the location of the selected cost
versus schedule solution.
Normalized Technical Performanc e
Normalized
Cost Per Unit
Trade Space
Minimum
Acceptable
Performance
Cost Per Unit Ceiling
X
= Candidate Solutions
Wh
ere:
1
0.8 1.4 1.8 2.01.0
1.0
0.3
0.5
0.8
1.
3
2
3
4
Solution 1 is Technically
Non-Compliant with
MINIMUM
Performance Criteri
a
Solution 4 is Non-Compliant
with MAXIMUM
Cost Per Unit Criteri
a
Design-to-Cost (DTC)
Level
Figure 52.4 Candidate Trade Space Zone
Simpo PDF Merge and Split Unregistered Version -
52.6 The Trade Study Process 679
If we convolve these trade spaces and their boundary constraints into a three-dimensional model,
the cube in the center of the diagram results.
The optimal solution selected is represented by the intersection of orthogonal lines in their
respective planes. Conceptually, the optimal solution would lie on a curve that represents the con-
volution of the performance–schedule, performance–cost, and cost–schedule curves. Since each
plane includes a restricted trade space, the integration of these planes into a three-dimensional
model results in a trade space volume.
52.6 THE TRADE STUDY PROCESS
Trade studies consist of highly iterative steps to analyze the issues to be resolved into a set pri-
oritized recommendations. Figure 52.6 represents a basic Trade Study Process and its process steps.
Let’s briefly examine the process through each of its steps.
Process Step 1: Define the trade study objective(s).
Process Step 2: Identify decision stakeholders.
Process Step 3: Identify trade study individual or team.
Process Step 4: Define the trade study decision factors/criteria.
Process Step 5: Charter the trade study team.
Process Step 6: Review the Trade Study Report (TSR)
Process Step 7: Select the preferred approach.
Process Step 8: Document the decision.
Performance
Cost
Schedule
Cost
Performance
Schedule
Performance
Cost
Schedule
2
3
1
Minimum
Acceptable
Performance
Maximum Acceptable
Schedule
Minimum
Acceptable
Performance
Maximum Acceptable
Cost
2
1 4
5
7
36
8
Maximum Acceptable
Schedule
Maximum
Acceptable
Cost
Trade Space
Volu me
Schedule-
Performance
Trade Space
Schedule-
Performance
Trade Space
Cost-
Performance
Trade Space
Cost-
Performance
Trade Space
Cost-
Schedule
Trade Space
Cost-
Schedule
Trade Space
Figure 52.5 Trade Space Interdependencies
Simpo PDF Merge and Split Unregistered Version -
Guidepost 52.1 Our discussion has identified the overall Trade Study Process. Now let’s focus
our attention on understanding the basic methodology that will be employed to conduct the trade
study.
52.7 ESTABLISHING THE TRADE STUDY METHODOLOGY
Objective technical and scientific investigations require a methodology for making decisions. The
methodology facilitates the development of strategy, course of action, or “roadmap” of the planned
technical approach to investigate, analyze, and evaluate the candidate solution approaches or
options. Methodologies, especially proven ones, keep the study effort on track and prevent unnec-
essary excursions that consume resources and yield no productive results.
There are numerous ways of establishing the trade study methodology. Figure 52.7 provides
an illustrative example:
Step 1: Understand the problem statement.
Step 2: Define the evaluation decision factors and criteria.
Step 3: Weight decision factors and criteria.
Step 4: Prepare utility function profiles.
Step 5: Identify candidate solutions.
Step 6: Analyze, evaluate, and score the candidate options.
Step 7: Perform sensitivity analysis.
Step 8: Prepare the Trade Study Report (TSR).
Step 9: Conduct peer/subject matter expert (SME) reviews.
Step 10: Present the TSR for approval.
680 Chapter 52 Trade Study Analysis of Alternatives
Define Trade
Study Ob
jective(s)
Define Trade
Study Objective(s)
Identify Decision
Stakehol
ders
Identify Decision
Stakeholders
Identify Trade
Study Team
Identify Trade
Study Team
Conduct Trade
Stud
y
Conduct Trade
Study
Review Trade
Study Result
s
Review Trade
Study Results
Select Approac
h
Select Approach
Document
Decision
Document
Decision
Charter Trade
Study Team
Charter Trade
Study Team
Trade Study
Decision Maker
Trade Study Team
(If applicable)
Trade
Study
Report
(TSR
)
Charter
1 2
3
6
Identify Decision
Fa
ctors/Criteria
Identify Decision
Fa
ctors/Criteria
5
4
Start
7
8
Stop
Figure 52.6 Trade Study Process
Simpo PDF Merge and Split Unregistered Version -
52.8 Trade Study Utility Functions 681
Formulate
Decision Factors
& Critieria
Formulate
Decision Factors
& Critieria
Weight Decision
Factors and
Criteria
Weight Decision
Factors and
Criteria
Prepare Utility
Functions
Prepare Utility
Functions
Identify
Candidate
Solutions
Identify
Candidate
Solutions
Evaluate
Candidate
Solutions
Evaluate
Candidate
Solutions
Perform
Sensitivity
Analysis
Checks
Perform
Sensitivity
Analysis
Checks
Prepare Trade
Study Report
(TSR)
Prepare Trade
Study Report
(TSR)
1
2 3
4
5
6
7
8
DRAFT
Trade Study
Report
(TSR)
Trade
Study
Process
Figure 52.6
Conduct SME
Peer Review(s)
FINAL
Trade Study
Report
(TSR)
9
10
Highly Iterative Highly Iterative
Highly Iterative
Understand
Problem/ Issue
Statement
Figure 52.7 Trade Study Methodology
Guidepost 52.2 At this point we have established the basic trade study methodology. On the
surface the methodology is straightforward. However, HOW do we evaluate alternatives that have
degrees of utility to the stakeholder? This brings us to a special topic, trade study functions.
52.8 TRADE STUDY UTILITY FUNCTIONS
When scoring some decision factors and criteria, the natural tendency is to do so on a linear scale
such as 1–5 or 1–10. This method assumes that the User’s value scale is linear; in many cases it
is nonlinear. In fact, some candidate options data have levels of utility. One way of addressing this
issue is to employ utility functions.
Understanding the Utility Function and Space
The trade space allows us to sort out acceptable solutions that fall within the boundary constraints
of the trade space. Note we used the term acceptable as in the context of satisfying a minimum/
maximum threshold. The reality is some solutions are, by a figure of merit (FOM), better than
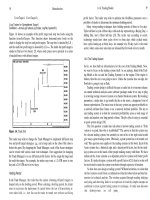
others. We need a means to express the degree of utility mathematically. Figure 52.8 provides exam-
ples of HOW Users might establish utility function profiles. To see this point better, consider the
following example:
EXAMPLE 52.4
A User requires a vehicle with a minimum speed within a mission area of 50 miles per hour (mph) under spec-
ified operating environment conditions. Mission analysis, as validated by the User, indicates that 64.0 mph is
the maximum speed required. Thus, we can state that the minimum utility to the User is 50mph and the
maximum utility is 64.0 mph.
Simpo PDF Merge and Split Unregistered Version -
Assigning the Relative Utility Value Range. Since utility represents the value profile a User
places on an attribute, we assign the minimum utility a value of 0.0 to represent the minimum per-
formance requirement—which is 50mph. We assign a utility value of 1.0 to represent the maximum
requirement—which is 64.0mph. The net result is the establishment of the utility space as indi-
cated by the shaded area in Figure 52.9.
682 Chapter 52 Trade Study Analysis of Alternatives
15 30
5
10
0
510
5
10
0
175 200
5
10
0
Braking (70 to 0 mph), feetAcceleration (0 to 60 mph)
Time
Feet
Average Fuel Economy
MPG
20 25
0.9 0.7
5
10
0
15 20
5
10
0
Cost
K Dollars
Road Handling
g
0.8
A B C
D E
Utility
Utility Utility
Utility Utility
Figure 52.8 Examples of Utility Function Profiles
Source: Adapted from NASA System Engineering “Toolbox” for Design-Oriented Engineers, Figure 2-1 “Example
utility functions”; p. 2-7.
Speed (mph)
Relative
Utility
Utility Space
Minimum Performance
Based on Minimum
Specification Requirement
Minimum Relative Utility
Based on Minimum
Specification Requirement
50
0.0
6052 54 56 58 62 644846 66
1
2
4
Maximum Relative Utility
Based on Maximum Level of
Performance Required
Maximum Level of
Performance Required
Determined by Analysis
3
0.2
0.4
0.6
0.8
1.0
Degree or
R
ange of Utility
Utility = 0.5
Utility = 0.0
Utility = 1.0
Figure 52.9 Utility Space Illustration
Simpo PDF Merge and Split Unregistered Version -
52.8 Trade Study Utility Functions 683
Determining Candidate Solution Utility. Once the utility range and space are established,
the relative utility of candidate options can be evaluated. Suppose that we have four candidate
vehicle solutions—1, 2, 3, and 4—to consider.
• Vehicle 1 has a minimum speed of 48 mph.
• Vehicle 2’s minimum speed is 50 mph—the threshold specification requirement.
• Vehicle 3’s minimum speed is 57 mph.
• Vehicle 4’s minimum speed is 65 mph.
So we assign to each vehicle the following utility values relative to the minimum specification
requirement:
1. Vehicle 1 = unacceptable and noncompliant
2. Vehicle 2 at 50 mph = utility value of 0, the minimum threshold
3. Vehicle 3 at 57 mph = utility value of 0.5
4. Vehicle 4 = exceeds the maximum threshold and therefore has a utility value of 1.0.
This approach creates several issues:
First, if Vehicle 1 has a minimum speed of 48mph, does this mean that it has a utility value
of <0.0 (i.e., disutility) or 0? The answer is no, because we assigned 0.0 to be the minimum spec-
ification requirement of 50mph which vehicle 2 meets.
Second, if Vehicle 4 exceeds the maximum speed requirement, do we assign it a utility value
of 1.0+ (i.e., >1.0), or do we maximized its utility at 1.0? The answer depends on whether vehicle
4 already exists or will be developed. You generally are not paid to overdevelop a system beyond
its required capabilities—in this case, 64mph.
Third, if we apply the utility value to the trade study scoring criteria (decision factor ¥ weight
¥ utility value), HOW do we deal with a system such as Vehicle 4 that has a utility value of 0.0
but meets the minimum specification requirement?
Utility Value Correction Approach 1
In the preceding example we started with good intentions—to find value-based decision factors via
utility functions—but have created another problem. How do we solve it? There are a couple of
solutions to correct this situation.
One approach is to simply establish a utility value of 1.0 to represent the minimum specifica-
tion requirement. This presents an issue. In the example Vehicle 1 has a minimum speed of 48mph
under specified operating conditions. If a utility value of 1.0 represents the minimum performance
requirement, Vehicle 1 will have a utility value of -0.2.
Simply applying this utility value infers acceptance as a viable option and allows it to con-
tinue to be evaluated in a trade study evaluation matrix. Our intention is to eliminate noncompli-
ant solutions—which is to remove Vehicle 1 from consideration. Thus, if a solution is unacceptable,
it should have a utility value of 0.0. This brings us to Approach 2.
Utility Value Correction Approach 2
Another utility correction approach that overcomes the problems of Correction Approach 1 involves
a hybrid digital and an analog solution. Rather than IMMERSING ourselves in the mathematical
concepts, let’s simply THINK about what we are attempting to accomplish.
The reality is that either a candidate option satisfies a minimum/maximum require-
ment or it doesn’t. The result is digital: 1 = meets requirement, and 0 = does not meet requirement.
Simpo PDF Merge and Split Unregistered Version -