Báo cáo y học: "Protein C: a potential biomarker in severe sepsis and a possible tool for monitoring treatment with drotrecogin alfa (activated)" pptx
Bạn đang xem bản rút gọn của tài liệu. Xem và tải ngay bản đầy đủ của tài liệu tại đây (328.36 KB, 11 trang )
Open Access
Available online />Page 1 of 11
(page number not for citation purposes)
Vol 12 No 2
Research
Protein C: a potential biomarker in severe sepsis and a possible
tool for monitoring treatment with drotrecogin alfa (activated)
Andrew F Shorr
1
, David R Nelson
2
, Duncan LA Wyncoll
3
, Konrad Reinhart
4
, Frank Brunkhorst
4
,
George Matthew Vail
2
and Jonathan Janes
2
1
Department of Medicine, Section of Pulmonary and Critical Care Medicine, Washington Hospital Center, Irving Street, Washington, District of
Columbia 20010, USA
2
Lilly Research Laboratories, Eli Lilly and Company, 520 S. Meridian, Indianapolis, Indiana 46285, USA
3
Department of Critical Care, Guy's and St Thomas' NHS Foundation Trust, Lambeth Palace Road, London SE1 7EH, UK
4
Department of Anesthesiology and Intensive Care, Friedrich Schiller University, Erlanger Allee, Jena 07740, Germany
Corresponding author: Andrew F Shorr,
Received: 19 Nov 2007 Revisions requested: 9 Jan 2008 Revisions received: 13 Feb 2008 Published: 4 Apr 2008
Critical Care 2008, 12:R45 (doi:10.1186/cc6854)
This article is online at: />© 2008 Shorr et al.; licensee BioMed Central Ltd.
This is an open access article distributed under the terms of the Creative Commons Attribution License ( />),
which permits unrestricted use, distribution, and reproduction in any medium, provided the original work is properly cited.
Abstract
Introduction Drotrecogin alfa (activated; DrotAA) treatment, a
96-hour infusion, reduces 28-day mortality in severe sepsis to
approximately 25%. The question remains whether a longer
infusion or higher dose could increase rate of survival. The goal
of this study was to identify a dependable, sensitive measure
with which to monitor disease progression and response in
patients during DrotAA treatment.
Methods Data on severe sepsis patients included in
PROWESS (placebo-controlled, double-blind, randomized
study of 850 DrotAA and 840 placebo individuals) and
ENHANCE (single-arm, open-label study of 2,375 DrotAA
patients) studies were analyzed. In these studies, DrotAA (24
μg/kg per hour) or placebo was infused for 96 hours and
patients were followed for 28 days. Data on six laboratory
measures and five organ dysfunctions were systematically
analyzed to identify a potential surrogate end-point for
monitoring DrotAA therapy and predicting 28-day mortality at
the end of therapy. To allow comparison across variables,
sensitivity and specificity analyses identified cut-off values for
preferred outcome, and relative risks for being above or below
cut-offs were calculated, as was the 'proportion of treatment
effect explained' (PTEE) to identify biomarkers that contribute to
benefit from DrotAA.
Results Protein C was the only variable that correlated with
outcome across all analyses. Using placebo data, a baseline
protein C under 40% was established as a useful predictor of
outcome (odds ratio 2.12). Similar odds ratios were associated
with cut-off values of other biomarkers, but the treatment benefit
associated with DrotAA was significantly greater below the cut-
off than above the cut-off only for protein C (relative risk for 28-
day mortality 0.66 versus 0.88; P = 0.04). Protein C was the
only end-of-infusion biomarker that potentially explained at least
50% of the benefit from DrotAA (PTEE 57.2%). The PTEE was
41% for cardiovascular Sequential Organ Failure Assessment
score and for d-dimer. At the end of infusion (day 4), protein C
categories (≤40%, 41% to 80%, and > 80%) remained
significantly related to mortality, regardless of treatment
assignment.
Conclusion Based on systematic analyses of 11 variables
measured in severe sepsis clinical trials, protein C was the only
variable consistently correlated with both DrotAA treatment
effect and survival. Further study is needed to determine
whether longer infusions or higher doses of DrotAA would
achieve the goal of normalizing protein C in more patients with
severe sepsis.
Introduction
Biomarkers play an important role in clinical care [1,2]. Biomar-
kers facilitate diagnosis, aid in assessing the severity of dis-
ease, and provide clinicians with surrogates that they can
follow to assess response to therapy. In a number of areas,
biomarkers are critical in the management of complex disease
DrotAA = drotrecogin alfa (activated); ENHANCE = Extended Evaluation of Recombinant Activated Protein C; IL = interleukin; IQR = interquartile
range; LOCF = last observation carried forward; PC = protein C; PROWESS = Recombinant Human Activated Protein C Worldwide Evaluation in
Severe Sepsis; PTEE = proportion of treatment effect explained; SOFA = Sequential Organ Failure Assessment.
Critical Care Vol 12 No 2 Shorr et al.
Page 2 of 11
(page number not for citation purposes)
states. For example, brain natriuretic peptide is now routinely
measured in patients suspected of having decompensated
congestive heart failure [3,4], whereas d-dimer is evaluated to
exclude the diagnosis of venous thromboembolism [5,6]. For
biomarkers to prove useful, they must be easy to measure, per-
form well as diagnostic tools, and exhibit some correlation with
outcomes. Additionally, biomarkers can serve as surrogate
markers in clinical trials. They have been incorporated into
studies with the aim being to identify patients who might be eli-
gible for certain experimental interventions and exclude those
who are unlikely to benefit from a proposed novel treatment
[7].
Severe sepsis and septic shock pose diagnostic challenges
because many of the signs and symptoms in these conditions
are nonspecific [8]. There is a pressing need to identify a
biomarker that correlates with outcomes and that stratifies
patients regarding the likelihood that they will benefit from
novel therapies such as drotrecogin alfa (activated; DrotAA).
Recently a sepsis definitions consensus conference [9] added
specific biomarkers to the list of diagnostic criteria for sepsis.
Protein C (PC) is a vitamin K dependent plasma serine pro-
tease zymogen that is converted to activated PC by the
thrombin-thrombomodulin complex. Activated PC has antico-
agulant, anti-inflammatory, cytoprotective, and antiapoptotic
activities [10-14].
PC deficiency is prevalent in severe sepsis, with studies show-
ing that more than 80% of patients with severe sepsis have a
baseline PC level below the lower limit of normal [15-18].
Unlike inflammatory cytokines, which are transiently elevated in
severe sepsis, plasma PC levels decrease early in patients
who develop severe sepsis, often before clinical symptoms
appear, and these levels remain low initially but gradually rise
in patients who recover and survive [18-21]. Numerous stud-
ies have examined the predictive value of plasma PC levels in
sepsis [22-26]. Other studies have confirmed the association
between depressed PC levels at baseline and the increased
likelihood of adverse outcomes in sepsis, including time on a
ventilator, time in the intensive care unit, development of
shock, and increased mortality [17,18,20,21,25-33]. Previ-
ously reported placebo data from the PROWESS (Recom-
binant Human Activated Protein C Worldwide Evaluation in
Severe Sepsis) trial showed that baseline PC levels and early
changes in PC were prognostic of outcome. Change in PC
levels on the first day after diagnosis of severe sepsis was
highly correlated with outcome, with a decrease during the
first days being able to differentiate eventual survivors from
nonsurvivors [34]. However, broader reliance on PC as a
biomarker in severe sepsis and septic shock requires evidence
that serial changes over multiple time points provide valuable
clinical information. Furthermore, it is necessary to demon-
strate that measurement of PC provides information and
insight not otherwise available from other biomarkers.
In order to validate the role of PC as a biomarker in severe sep-
sis and septic shock, we performed a secondary analysis of
two large clinical trials of DrotAA. We compared the explana-
tory power of PC with those of multiple other clinical measures
and biomarkers to determine the independent contribution
that serial PC measurement would make in explaining mortality
and DrotAA response.
Materials and methods
Patients
The PROWESS and ENHANCE (Extended Evaluation of
Recombinant Activated Protein C) trials were conducted
(before assignment of trial registration numbers) in accord-
ance with ethical principles that have their origin in the Decla-
ration of Helsinki and are consistent with good clinical practice
and applicable laws and regulations. The trial designs, patient
disposition, inclusion/exclusion criteria, and results were
described previously [15,35]. PROWESS was a randomized,
placebo-controlled clinical trial of DrotAA (Xigris
®
; Eli Lilly and
Company, Indianapolis, IN, USA) in adult patients with severe
sepsis. ENHANCE was an open-label, single-arm, clinical trial
of DrotAA. All investigative sites obtained approval for the
study from their institutional review board. Written informed
consent was obtained from all patients or their legal
representatives.
Biomarker evaluations
In the PROWESS trial, plasma samples were obtained at
baseline (day of randomization) and daily through to study day
7. A central laboratory (Covance Central Laboratory Services,
Indianapolis, IN, USA) performed all assays. The PC activity
assay was performed on a STA
®
coagulation analyzer using
the STA
®
-Staclot
®
Protein C kit (Diagnostica Stago, Asnieres-
Sur-Seine, France), which has a coefficient of variation of
7.5%. Protein S measurements were performed on the STA
®
coagulation analyzer using the STA
®
- Staclot
®
Protein S kit
(Diagnostica Stago). Antithrombin III activity was quantitated
using a chromogenic activity assay (Stachrome ATIII; Diagnos-
tica Stago). IL-6 antigen levels were measured by enzyme
immunoassay (Quantikine Human IL-6 HS kit; R&D Systems,
Minneapolis, MN, USA). PC measurements during the
ENHANCE trial were obtained at baseline and the end of infu-
sion, and were analyzed using the same methodology as in
PROWESS.
Sequential Organ Failure Assessment (SOFA) scores were
determined based on local laboratory data, vasopressor dos-
ages, and need for mechanical ventilation.
Statistical methods
The statistical methods were designed to examine individually
each laboratory and clinical measure for their attributes as
biomarkers. Biomarkers have been classified into types by the
National Institutes of Health Biomarker Definition Working
Group [1]. Vasan [2] adapted the National Institutes of Health
Available online />Page 3 of 11
(page number not for citation purposes)
definitions to categorize biomarkers into type 0, 1, and 2; the
definition of each type is given below. The following statistical
tests examined each type of biomarker using data from the
PROWESS trial. Data from the ENHANCE trial, in which all
patients received DrotAA, were used to explore the consist-
ency of findings; no combined analyses of the PROWESS and
ENHANCE data were performed.
Type 0 biomarker
A type 0 biomarker is, 'A marker of the natural history of a dis-
ease and correlates longitudinally with known clinical indices.'
Initial analyses determined which of six laboratory measures
and five organ dysfunctions (SOFA scores) were related at
baseline to the clinical index of 28-day mortality in the placebo
group. Based on placebo patients (n = 840), an 'optimal' cut-
off was generated that maximized the sum of sensitivity and
specificity (with each required to be at least 40%) to predict
28-day mortality. All values across the range of the receiver
operating characteristic curves were examined. Using a cut-off
for each measure allowed comparisons of odds ratios and
interactions with treatment on a consistent binary scale across
measures. In addition, these same measures at day 4 were
evaluated for the placebo patients. Significance at both time
points using the significance of χ
2
tests and 95% confidence
intervals of odds ratios would indicate longitudinal correlation
with mortality.
Type 1 biomarker
A type 1 biomarker is, 'A marker that captures the effects of a
therapeutic intervention in accordance with its mechanism of
action.' This was examined in two ways for DrotAA in PROW-
ESS. First, do more severe baseline values for the biomarker
indicate a subgroup with a greater treatment benefit? This sta-
tistical interaction between biomarker and treatment was
tested with Breslow-Day tests. The relative risks for death on
comparing DrotAA (n = 850) with placebo (n = 840) were
generated above and below cut offs. Second, biomarkers
were identified that improved during treatment. Wilcoxon rank-
sum tests were used to identify laboratory values and organ
dysfunctions that were significantly different at day 4 between
DrotAA and placebo patients. Day 4 last observation carried
forward (LOCF) values were used in these analyses, with no
imputation for death (the last observed SOFA score, not '4',
was used for patients who died during the first 4 days).
Patients with missing baseline values were excluded from
these analyses.
Surrogate end-point (type 2 biomarker)
A type 2 biomarker is, 'A marker that is intended to substitute
for a clinical endpoint; a surrogate endpoint is expected to pre-
dict clinical benefit.' To quantify the potential of surrogate
markers at the end of infusion, methods proposed by Li and
coworkers [36] were utilized using Day 4 values. These meth-
ods use logistic regression to provide the 'proportion of treat-
ment effect explained' (PTEE). PTEE has been proposed as a
measure of surrogacy for the validation of surrogate end-
points. A good surrogate marker accounts for a larger percent-
age of treatment effect. For instance, if a treatment reduces
the risk for death by 20% and improvement in a biomarker was
associated with a risk reduction of death by 10%, then the
biomarker explains 50% of the treatment effect. This was
quantified by taking the ratio of risk reduction explained solely
by the average change in a measure, and dividing by total risk
reduction associated with the average change in a measure
plus the residual treatment effect. These analyses were to
determine how much of the 28-day mortality effect was
accounted for solely by patient status on day 4. The PTEE val-
ues of the multiple variables examined are not expected to add
up to 100%, and a negative PTEE means that the treatment
resulted in a change in the variable that is in the opposite
direction than anticipated for a beneficial treatment effect.
Additional statistical methods
Additional nonparametric analyses were performed using Wil-
coxon sign-rank and Wilcoxon rank-sum tests, as appropriate.
All calculations were performed using SAS version 8.1 soft-
ware (SAS Institute Inc., Cary, NC, USA).
Results
The baseline characteristics for the PROWESS placebo and
DrotAA patient populations have been reported elsewhere
[15], as have those of the ENHANCE population [35]. How-
ever, a summary of selected baseline characteristics that are
specifically relevant to the present analyses is given in Table 1.
Type 0 biomarker: relationship to natural history of
sepsis and correlated with clinical outcome
Baseline values of six laboratory and five clinical measures
were evaluated as potential predictors of 28-day mortality. To
allow comparisons across measures, the cut-off values asso-
ciated with greater risk for mortality based on sensitivity and
specificity analyses of baseline values were determined (Table
2). The number of patients at increased risk based on the cut-
offs, although each representing a different subgroup, was
very similar across variables, representing approximately one-
third of patients. However, this does not represent the same
high-risk patients in each group. Only one patient was high risk
for all 11 markers, and only 48 (5.8%) were low risk for all of
their measures. This approach established a baseline PC level
< 40% as a useful end-point for assessing mortality risk in sep-
sis patients. The odds of dying within 28 days was twice as
high in patients with a baseline PC level < 40% as in those
with a PC level of ≥40%. Similar odds ratios were associated
with the cut-off values of the other variables, as were the areas
under the receiver operating characteristic curve, a combined
measure of sensitivity and specificity. This analysis also dem-
onstrates (as already known) the unequal effect of individual
SOFA scores, with cut-off ranging from ≥1 for renal SOFA to
≥4 for cardiovascular and respiratory SOFA.
Critical Care Vol 12 No 2 Shorr et al.
Page 4 of 11
(page number not for citation purposes)
To determine which measures exhibited a longitudinal correla-
tion with mortality, these same measures were evaluated at the
end-of-infusion period (day 4) for placebo patients. The opti-
mal cut-off values at day 4, shown in Table 3, were very similar
to those shown for baseline values in Table 2, except that the
cut-off value for IL-6 was ≥185.6 versus ≥704.6 pg/ml. With-
out adjusting for baseline values, the day 4 values for all 11
variables were associated with a statistically significant
increased risk for death at day 28.
Type 1 biomarker: therapeutic intervention in
accordance with mechanism of action
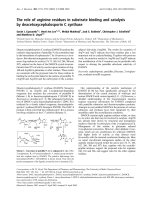
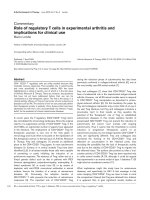
Figure 1 shows the therapeutic effect of DrotAA in patients at
lower and higher risk for death, as defined by the statistically
defined baseline cut-off for the 11 potential biomarkers shown
in Table 2. PC was the only biomarker at baseline that exhib-
ited a statistically significant difference in relative risk for death
between the lower and higher risk groups (relative risk 0.66
[DrotAA and placebo] for lower risk versus 0.88 for higher risk
patients; P = 0.04). In PROWESS, patients who had values
below the PC cut-off (< 40%) and who were administered
DrotAA exhibited a 34% reduction in risk for death (27.6%
DrotAA versus 41.8% placebo), whereas above the cut-off the
risk reduction was 12% (22.4% versus 25.3%). Mortality rates
observed in the ENHANCE trial were 33.3% for patients with
PC below the cut-off and 17.6% for those with PC above the
cut-off (data not shown).
Surrogate endipoint (type 2 biomarker): substitute for
clinical end-point by predicting clinical benefit
The next step was to determine which of the potential biomar-
kers improved during DrotAA treatment (Table 4). In PROW-
ESS, at the end of the 4-day infusion (day 4) DrotAA
significantly increased the median PC level (P < 0.0001),
increased prothrombin time (P = 0.0003) and decreased d-
dimer (P < 0.0001), and, to a lesser degree, decreased the
cardiovascular SOFA score (P = 0.01) and increased the
hepatic SOFA score (P = 0.04). Although all of these post-
baseline measures were prognostic for placebo mortality
(Table 3), the end of infusion (day 4 LOCF) level of PC and, to
a lesser degree, cardiovascular dysfunction and d-dimer
appeared to be specifically improved with DrotAA treatment.
In PROWESS, the median increase in PC activity during the
4-day infusion period was 19% (interquartile range [IQR] 3%
to 36%) for DrotAA, as compared with 8% (IQR -5% to
+25%) for placebo patients. In the same timeframe,
ENHANCE patients receiving DrotAA exhibited an 18%
increase in PC (IQR 0% to 39%). Because the negative rela-
tionship of DrotAA treatment with hepatic SOFA on day 4, we
reviewed the actual baseline and day 4 bilirubin measure-
Table 1
PROWESS and ENHANCE patient baseline characteristics
Variable PROWESS ENHANCE
Placebo (n = 840) DrotAA (n = 850) DrotAA (n = 2378)
Sex (% male [n]) 58.0 (487) 56.1 (477) 58.2 (1383)
Mean age (years [SD]) 60.6 (16.5) 60.5 (17.2) 59.1 (16.9)
Caucasian (% [n]) 82.0 (689) 81.8 (695) 90.6 (2154)
APACHE II score (mean [SD]) 25.0 (7.8) 24.6 (7.6) 22.0 (7.4)
SOFA score (mean [SD])
Cardiovascular 2.7 (1.5) 2.6 (1.5) 3.0 (1.4)
Respiratory 2.7 (1.1) 2.7 (1.0) 2.7 (1.0)
Renal 1.1 (1.1) 1.1 (1.1) 1.3 (1.2)
Hematologic 0.7 (1.0) 0.7 (0.9) 0.8 (1.0)
Hepatic 0.6 (0.9) 0.6 (0.8) 0.7 (0.9)
Protein C (median [IQR]) 50 (33 to 68) 47 (30 to 63) 45 (30 to 64)
Protein S (median [IQR]) 38 (23 to 58) 35 (33 to 57) -
Antithrombin III (median [IQR]) 60 (45 to 75) 58 (43 to 74) -
Interleukin-6 (median [IQR]) 484 (129 to 2539) 496 (153 to 2701) -
Prothrombin time (median [IQR]) 18.6 (16.4 to 21.8) 18.7 (16.6 to 22.1) -
D-dimer (median [IQR]) 4.1 (2.2 to 8.7) 4.2 (2.3 to 8.1) -
APACHE, Acute Physiology and Chronic Health Evaluation; DrotAA, drotrecogin alfa (activated); ENHANCE, Extended Evaluation of
Recombinant Activated Protein C; PROWESS, Recombinant Human Activated Protein C Worldwide Evaluation in Severe Sepsis; SD, standard
deviation; SOFA, Sequential Organ Failure Assessment; IQR, interquartile range.
Available online />Page 5 of 11
(page number not for citation purposes)
ments. Considering the 1,374 patients in PROWESS for
whom data were available regarding the change in bilirubin
from baseline at these time points (n = 692 for DrotAA and n
= 682 for placebo), there were no significant changes within
groups (P = 0.49 for DrotAA and P = 0.12 for placebo) or
between therapies (P = 0.14), with a median change of 0 and
-1 μmol/l for DrotAA and placebo, respectively.
To assess how the change helps to account for the DrotAA
treatment effect in PROWESS, the PTEE was analyzed (Table
4). The end-of-infusion (day 4 LOCF) measure of PC
accounted for 57.2% of the DrotAA treatment effect on 28-
day mortality. The change in prothrombin time and the hepatic
SOFA, while being statistically different between treatment
groups, exhibited a negative correlation with the DrotAA treat-
ment effect (namely, its direction was opposite that anticipated
for a beneficial treatment effect).
Further examination of protein C and DrotAA
interactions over time
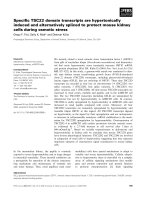
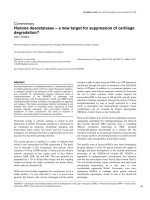
A strong link between improved PC levels and improved sur-
vival became apparent when serial PC levels were analyzed for
DrotAA treated patients and displayed by time of death or ulti-
mate survival (Figure 2a). (A similar figure for the PROWESS
placebo patients was previously reported [22].) As with the
PROWESS placebo patients, PC levels assessed at the start
of each time interval were highly predictive of outcome within
the time interval, with continued PC deficiency associated with
higher mortality. This analysis demonstrates that patients with
lower PC levels are more likely to die, and that patients who
survived to be discharged had PC levels that increased during
the DrotAA infusion to a mean of 80% by day 5. Patients who
died between days 6 and 15 had a decrease in mean PC lev-
els after day 4, suggesting that PC levels fell when DrotAA
infusion was stopped.
Based on the statistical analyses presented in Table 4, d-dimer
values also appeared to be a potential surrogate biomarker for
DrotAA therapy. However, as shown in Figure 2b, although d-
dimer decreased in all patients who received DrotAA, at the
end of the infusion the d-dimer levels immediately began to
increase in all patients and that increase was not correlated
with mortality at different time points.
Summary of results correlated with biomarker status
To aid in the interpretation of these data, the results are sum-
marized in Table 5 using categories defined in the footnote.
This summary shows that PC is the only biomarker that
consistently correlated with outcome, regardless of the time of
measurement or the analytical approach.
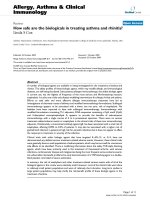
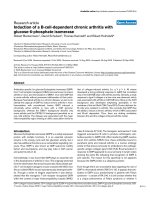
Figure 3 shows that PC levels at end of infusion also corre-
lated with outcome regardless of treatment. For this final anal-
ysis, end-of-infusion (day 4 LOCF) PC levels were categorized
by deficiency (severe ≤40%, moderate 41% to 80%, or normal
> 80%) and the categories were shown to be significantly
related to mortality regardless of treatment. DrotAA treatment
resulted in fewer patients (166 [20.8%] versus 217 [28.0%])
with severe PC deficiency (≤40%), and more patients (290
[36.3%] versus 211 [27.2%]) with normal PC levels (> 80%)
at the end of infusion compared with placebo (P < 0.0001).
The ENHANCE mortality rates based on day 4 PC categories
were consistent with the PROWESS DrotAA data. Regard-
less of treatment, mortality rates were lowest in patients with
Table 2
Relationship of baseline (start of infusion) values to 28-day mortality in PROWESS placebo patients
Baseline measure Cut-off
a
Number of patients at increased risk using cut-off (n [%]) Odds ratio (95% CI) AUC
b
Protein C (%) <40 243 (31.4%) 2.12 (1.55–2.89) 58.9%
Protein S (%) <46 239 (31.5%) 1.91 (1.38–2.64) 57.7%
Antithrombin III (%) <53 240 (31.4%) 2.32 (1.70–3.18) 60.1%
interleukin-6 (pg/ml) ≥704.6 252 (31.2%) 2.21 (1.63–2.99) 59.7%
Prothrombin time (seconds) ≥18.4 240 (31.5%) 1.89 (1.38–2.58) 57.4%
D-dimer (μg/ml) ≥4.45 241 (31.8%) 1.51 (1.11–2.05) 55.1%
Cardiovascular SOFA ≥4 259 (30.8%) 1.63 (1.21–2.18) 56.0%
Respiratory SOFA ≥4 257 (31.2%) 1.76 (1.27–2.44) 55.5%
Renal SOFA ≥1 258 (30.8%) 2.14 (1.55–2.95) 58.6%
Hematologic SOFA ≥2 259 (30.8%) 1.69 (1.20–2.38) 54.6%
Hepatic SOFA ≥2 239 (31.3%) 1.31 (0.89–1.93) 52.1%
a
Cut-off based on maximum sensitivity and specificity when both were ≥ 40% for predicting 28-day mortality. Using a cut-off for each measure
allowed comparison of odds ratios and treatment interactions on a consistent binary scale across variables.
b
Area under the receiver operating
characteristic curve (AUC) based on 28-day mortality outcome in logistic regression models with the cut-off as the univariate independent
variable; this is a combined measure of sensitivity and specificity. CI, confidence interal; PROWESS, Recombinant Human Activated Protein C
Worldwide Evaluation in Severe Sepsis; SOFA, Sequential Organ Failure Assessment.
Critical Care Vol 12 No 2 Shorr et al.
Page 6 of 11
(page number not for citation purposes)
normalized PC levels. The histograms within each PC cate-
gory appeared equal across treatments, indicating that differ-
ences between treatment groups do not exist after taking into
account the surrogate end-point. The end-of-infusion PC cat-
egory has a greater effect on mortality than differences within
a category between DrotAA and placebo treatment.
Discussion
These analyses indicate that PC can act as a surrogate end-
point in severe sepsis, regardless of the time of measurement
or treatment received. Based on a systematic statistical
assessment of six potential biomarkers and five organ dysfunc-
tion measures that were measured in a large randomized clin-
ical trial conducted in severe sepsis patients, only PC levels
were significantly correlated with 28-day mortality regardless
of statistical approach. Using statistically defined cut-offs, mul-
tiple variables at baseline were predictive of 28-day mortality
and all variables could be predictive at the end of the 4-day
infusion. Only PC improved with DrotAA treatment, was signif-
icantly correlated with the DrotAA treatment effect, and
accounted for more than 50% of its treatment effect (PTEE).
Additionally, serial changes in PC correlated well with mortal-
ity. Variations in PC also explained the majority of the treatment
effect due to DrotAA therapy.
Other biomarkers have been proposed to be useful diagnostic
markers for sepsis and the severity of sepsis [37], but those
analyzed in this study did not meet all criteria for surrogacy. D-
dimer did decrease during infusion with DrotAA and, based on
PTEE analysis, it could account for 41% of its treatment effect,
but there was no difference in relative risk between the lower
and higher risk groups. At the end of infusion the values
increased in all patients, both survivors and nonsurvivors, sug-
gesting that the DrotAA effect is not just an alteration in the
procoagulant state. Instead, based on PROWESS data, d-
Table 3
Relationship of day 4 (end of infusion) values to 28-day mortality in PROWESS placebo patients
Sample size Univariate odds ratio
Measure Cut-off
a
Higher risk Lower risk Odds ratio (95% CI) P
Protein C (%) <42 240 578 4.63 (3.35 to 6.41) <0.0001
Protein S (%) <42 297 521 3.25 (2.38 to 4.43) <0.0001
Antithrombin III (%) <60 306 512 4.17 (3.05 to 5.71) <0.0001
Interleukin-6 (pg/ml) ≥185.6 264 563 7.27 (5.23 to 10.11) <0.0001
Prothrombin time (seconds) ≥18.4 233 585 6.13 (4.40 to 8.56) <0.0001
D-dimer (μg/ml) ≥4.63 408 410 2.13 (1.57 to 2.89) <0.0001
Cardiovascular SOFA ≥3 301 539 7.32 (5.28 to 10.13) <0.0001
Respiratory SOFA ≥3 358 482 3.36 (2.48 to 4.56) <0.0001
Renal SOFA ≥1 335 505 4.82 (3.52 to 6.59) <0.0001
Hematologic SOFA ≥2 252 588 3.42 (2.50 to 4.68) <0.0001
Hepatic SOFA ≥1 256 573 2.11 (1.55 to 2.89) <0.0001
a
Cut-off was defined by the day 4 (end of infusion) value that resulted in maximum sensitivity and specificity for predicting 28-day mortality. CI,
confidence interal; PROWESS, Recombinant Human Activated Protein C Worldwide Evaluation in Severe Sepsis; SOFA, Sequential Organ
Failure Assessment.
Figure 1
Illustration of 28-day mortality RR reduction (DrotAA versus placebo) for each potential biomarker at baselineIllustration of 28-day mortality RR reduction (DrotAA versus placebo)
for each potential biomarker at baseline. The point estimates of relative
risk (RR) for death in patients at lower risk and higher risk, based on
statistically defined cut-offs (shown in Table 2), are indicated by open
ovals and solid ovals, respectively; 95% confidence intervals (CIs) are
indicated by horizontal lines. Only protein C (PC) was significantly (P <
0.05) different between the two risk groups, as indicated by the least
overlap in CIs, indicating a differential benefit. P values were deter-
mined using Breslow-Day tests. AT, antithrombin; CI, confidence inter-
val; DrotAA, drotrecogin alfa (activated); IL, interleukin; PT, prothrombin
time; SOFA, Sequential Organ Failure Assessment.
Available online />Page 7 of 11
(page number not for citation purposes)
dimer appears to be a marker that the patient received DrotAA,
not how well the patient responded to DrotAA. IL-6 levels at
baseline were predictive of patient outcome, but at the end of
infusion (day 4) the difference between DrotAA and placebo
groups was not significant and its PTEE was 0.3%. Pro-
thrombin is another biomarker that is expected to decrease as
coagulopathy improves, but instead prothrombin time
increased slightly, but consistently, in patients who received
DrotAA, resulting in a negative PTEE value (-30%). Although
DrotAA improves coagulopathy, there is also a small direct
effect of interference of activated PC with prothrombin time.
The negative PTEE obtained for hepatic SOFA (-14%) results
from a slightly higher hepatic SOFA with DrotAA than with pla-
cebo. However, there were no significant differences in
change in bilirubin from baseline to day 4. Traditionally, liver
dysfunction under conditions of shock and sepsis is consid-
ered to be biphasic, with an initial ischaemic insult (ischaemic
hepatitis) followed by jaundice (intensive care unit jaundice)
developing several days later [38,39]. Thus, the SOFA sub-
score for hepatic impairment, which is based on bilirubin
levels, is biased toward underestimation of dysfunction in the
early course of the disease.
Some have expressed skepticism toward PTEE analyses,
especially when it is applied to small individual studies,
because high PTEE values do not necessarily imply that the
surrogate end-point is an important part of the causal pathway
that leads from treatment to disease [40]. However, our analy-
ses are based on a large population (n = 1,690) and show that
PC levels not only can explain a large proportion of the DrotAA
treatment effect but also are directly related to clinical out-
come in severe sepsis.
PC meets the US National Institutes of Health's recommended
definition of a biomarker that could function as a clinical end-
point (a variable that reflects how long or how a patient feels
or functions, or how long a patient survives), as well as a sur-
rogate end-point (a biomarker, based on epidemiologic, thera-
peutic, pathophysiologic, or other scientific evidence,
intended to substitute for a clinical end-point) [40]. Surrogate
end-points can be useful in advising patients about modifica-
tions of treatment after they have reached a surrogate end-
point but have not yet reached the true clinical end-point. Our
data shows PC to be a valid surrogate, defined as a biomarker
that can explain at least 50% of the effect of an exposure or
intervention on the outcome of interest [41]. Of the biomarkers
analyzed, only PC had a PTEE greater than 50%. The PTEE for
cardiovascular SOFA was 41%. PC predicts cardiovascular
changes downstream, and so it is expected that the cardiovas-
cular SOFA would be a reasonable surrogate. However, the
reverse is not true; cardiovascular improvement does not nec-
essarily increase PC downstream, and the baseline cardiovas-
cular SOFA does not appear to predict well who will benefit
most from DrotAA treatment. Although this is somewhat coun-
terintuitive, it is what the PROWESS data have indicated.
Normalization of PC levels is critical for survival. The serial
measurements of PC show that if the PC values continue to
increase toward normalization after day 4, then survival
increases. For those patients who died between days 6 and
Table 4
Day 4 (end of infusion) values in PROWESS:individual surrogate performance score (PTEE)
Day 4 measure DrotAA patients
(mean [SD]/median)
Placebo patients
(mean [SD]/median)
P
a
Individual surrogate performance score (PTEE)
b
Protein C (%) 70.6 (36.2)/67.0 62.7 (36.9)/59.0 <0.0001 57.2%
Protein S (%) 53.3 (29.0)/52.0 53.5 (30.2)/53.0 0.95 -0.8%
c
Antithrombin III (%) 70.3 (27.0)/69.5 69.0 (28.0)/70.0 0.38 13.4%
Interleukin-6 (pg/ml) 3,649 (30,280)/75.5 4948 (33379)/79.5 0.78 0.3%
d
Prothrombin time (seconds) 18.6 (7.4)/16.7 18.5 (8.4)/16.2 0.0003 -30.4%
c, d
D-dimer (μg/ml) 4.63 (5.41)/3.12 7.13 (7.87)/4.61 <0.0001 40.5%
d
Cardiovascular SOFA 1.48 (1.60)/1.00 1.67 (1.64)/1.00 0.01 40.8%
Respiratory SOFA 2.25 (1.03)/2.00 2.30 (1.01)/2.00 0.25 12.7%
Renal SOFA 0.74 (1.12)/0.00 0.80 (1.17)/0.00 0.39 10.6%
Hematologic SOFA 0.89 (1.12)/0.00 0.92 (1.15)/0.00 0.79 5.1%
Hepatic SOFA 0.61 (0.92)/0.00 0.53 (0.89)/0.00 0.04 -13.6%
a
P value for Wilcoxon rank-sum test.
b
The performance score shows the proportion of drotrecogin alfa (activated; DrotAA) treatment effect
explained (PTEE) based on logistic regression analyses that quantify the amount of the observed treatment effect on 28-day mortality that is
attributable to the treatment effect of the individual biomarker. Because changes in these biomarkers are often interdependent (for example,
protein C and cardiovascular SOFA improvements), the performance scores are not expected to add up to 100%.
c
A negative performance score
means that the treatment adversely affected the variable.
d
For biomarkers that varied greatly between mean and median values, analysis was
based on median value. PROWESS, Recombinant Human Activated Protein C Worldwide Evaluation in Severe Sepsis; SD, standard deviation;
SOFA, Sequential Organ Failure Assessment.
Critical Care Vol 12 No 2 Shorr et al.
Page 8 of 11
(page number not for citation purposes)
15, the PC levels were increasing until after the end of drug
infusion, which raises the question of whether these patients
would have survived if the DrotAA infusion had been extended
beyond day 4. Use of PC levels to optimize therapy for
individual patients warrants further study. A series of studies
are proposed to explore the use of serial plasma PC
measurement as a biomarker that will achieve the following
objectives: aid in the identification of patients with severe sep-
sis who are most likely to benefit from DrotAA; enable the
adjustment of DrotAA therapy for individual patients (specifi-
cally, the possibility to use a higher dose and to adjust the infu-
sion duration, making it either longer or shorter as needed);
and provide guidance to the clinician regarding whether the
patient is responding to DrotAA. The first study in the series is
referred to as RESPOND (Research Evaluating Serial PC Lev-
els in Severe Sepsis Patients on DrotAA) and is currently
ongoing. It is seeking to demonstrate that 'alternative therapy'
(higher dose with variable infusion duration or variable infusion
duration only) results in a greater increase in PC levels than
'standard therapy' (the currently approved regimen of 24 μg/
kg per hour for 96 hours) and, importantly, to provide appropri-
ate safety and efficacy data to determine the most appropriate
aspects of 'alternative therapy' to incorporate into possible
future studies [42].
Limitations
This was a post hoc analysis that was limited to the potential
biomarkers measured during PROWESS. When PROWESS
was designed the prevailing assumed mechanism of action of
PC was anticoagulation, and so the laboratory measurements
in that study focused primarily on the coagulation pathway.
Many of the potential biomarkers included in our analyses do
not have prespecified clinically defined thresholds. Therefore,
to be consistent in how the variables were analyzed, statisti-
cally defined cut-offs were determined from specificity and
sensitivity analyses. The cut-offs were driven by variability
within the patient population in PROWESS and were there-
fore limited by a one-study dataset. We used ENHANCE data
in an attempt to validate our findings, but that comparison is
not ideal because ENHANCE had no placebo group and PC
was measured less frequently during the trial. Also, the areas
under the receiver operating characteristic curves for all mark-
ers tended to be at the 60% level or below. In the PROWESS
population, in which the extremes of risk for death are
excluded by inclusion and exclusion criteria, individual markers
of baseline severity have relatively low values for prognostic
measures in univariate analyses.
Finally, in an attempt to put our analyses into perspective and
to help summarize the results from the different analyses, we
arbitrarily assigned categories to the outcomes, as shown in
Table 5. This was an effort to illustrate, not quantitate, the
results.
Conclusion
Based on systematic analyses of 11 variables (six biomarkers
and five organ dysfunctions) measured in severe sepsis clini-
cal trials, PC was the only variable consistently correlated with
both DrotAA treatment effect and survival. Further study is
needed to determine whethter longer infusions or higher
doses of DrotAA would achieve the goal of normalizing PC in
more patients with severe sepsis.
Competing interests
DRN, JJ, and GMV are employees of and stockholders in Eli
Lilly and Company (Eli Lilly), the manufacturer of DrotAA. AFS
is a consultant to both Eli Lilly and Astra Zeneca regarding the
design of clinical trials for severe sepsis and septic shock.
DLAW has given paid lectures for and participated in clinical
trials, supported by Eli Lilly. KR has served as consultant and
Figure 2
PC and d-dimer levelsPC and d-dimer levels. Shown are the mean ± standard error (a) pro-
tein C (PC) and (b) d-dimer levels based on time of death. Raw values
with no imputation were included. PROWESS (Recombinant Human
Activated Protein C Worldwide Evaluation in Severe Sepsis) drotrec-
ogin alfa (activated; DrotAA) patients with baseline measures were
classified according to timing of death (n = PC/d-dimer): death ≤ 5
days after start of infusion (n = 79/86); death after 6 to 15 days (n =
81/84); and survival to day 28 and hospital discharge (n = 544/577).
The PC data were reported by Vangerow and coworkers [42] and com-
parable PC data for PROWESS placebo patients were reported by
Macias and Nelson [22].
Available online />Page 9 of 11
(page number not for citation purposes)
received payments from Eli Lilly for speaking engagements
and research. FB received payments from Eli Lilly for speaking
engagements and research.
Authors' contributions
AFS, DRN, and JJ participated in the conception and design of
the study. AFS, and DLAW participated in the clinical trials
and data collection. GMV participated in the conception of the
study. All authors contributed to the development and conduct
Table 5
Summary of results in support of biomarker status
Type 0 biomarker:
placebo baseline
value versus mortality
(see Table 2);
categorized by OR
a
Type 0 biomarker:
placebo day 4 value
versus mortality (see
Table 3); categorized
by P value
b
Type 1 biomarker:
relationship of
baseline value to
DrotAA effect (see
Figure 1); categorized
by P value
b
Surrogate (type 2
biomarker):
improvement at day 4
with DrotAA (see
Table 4); categorized
by P value
b
Surrogate (type 2
biomarker): surrogate
performance score
(see Table 4);
categorized by PTEE
c
Protein C +++ +++ ++ +++ +++
Protein S ++ +++ + - -
Antithrombin III +++ +++ - - +
Interleukin-6 +++ +++ - - -
Prothrombin time ++ +++ - +++ -
D-dimer ++ +++ - +++ ++
Cardiovascular SOFA ++ +++ - ++ ++
Respiratory SOFA ++ +++ - - +
Renal SOFA +++ +++ - - +
Hematologic SOFA ++ +++ - - +
Hepatic SOFA + +++ - + -
Shown is the categorization based on the results of each analysis. To summarize the statistical analyses, the results from each analysis were
categorized as follows.
a
Odds ratios (ORs) from Table 2: - = OR < 0; + = 0 ≤ OR < 1.5; ++ = OR 1.5 to 2.0; +++ = OR > 2.0.
b
P values from
Tables 3 and 4, and Figure 1: - = P > 0.1; + = 0.051 <P ≤ 0.1; ++ = P 0.01 to 0.05; +++ = P < 0.01.
c
Proportion of treatment effect explained
(PTEE) from Table 4: - = negative or < 5%; + = 5% to < 25%; ++ = 25% to 50%; +++ = > 50%. DrotAA, drotrecogin alfa (activated); SOFA,
Sequential Organ Failure Assessment.
Figure 3
Mortality from PROWESS and ENHANCE based on end-of-infusion PC levels by categoriesMortality from PROWESS and ENHANCE based on end-of-infusion
PC levels by categories. The protein C (PC) categories were normal (>
80%), deficient (41% to 80%), and severely deficient (< 40%). The
number in each column is the total number of patients in each category.
Patients were included if they had a baseline PC measure. Day 4 PC
was classified as end of infusion. If day 4 measurement was not availa-
ble, last observation carried forward values were used for classification.
These data were reported by Vangerow and coworkers [42].
ENHANCE, Extended Evaluation of Recombinant Activated Protein C;
PROWESS, Recombinant Human Activated Protein C Worldwide
Evaluation in Severe Sepsis.
Key messages
• Serial measurement of PC in sepsis has the potential to
act as a biomarker to predict outcome and guide ther-
apy with DrotAA.
• Based on systematic analyses of 11 variables (six
biomarkers and five organ dysfunctions) measured in
severe sepsis clinical trials, PC was the only variable
consistently correlated with both survival and DrotAA
treatment effect.
• A PC level < 40% was established as a useful predictor
of outcome at baseline and at the end of infusion.
• Normalization of PC levels is an important predictor of
survival, and DrotAA treatment results in more patients
with normal PC levels and fewer patients with severe
PC deficiency at the end of infusion compared with
placebo.
• Further study is needed to determine whether longer
infusions or higher doses of DrotAA would achieve the
goal of normalizing PC in more patients with severe
sepsis.
Critical Care Vol 12 No 2 Shorr et al.
Page 10 of 11
(page number not for citation purposes)
of analyses, and participated in drafting the manuscript. All
authors contributed to revisions and approval of the final
manuscript.
Acknowledgements
We thank Delores Graham, a contract medical writer, and David Sundin,
an Eli Lilly employee, who provided editorial service on behalf of Eli Lilly
in preparation of the manuscript, and Chuyun Huang, an Eli Lilly
employee, who provided statistical analysis support. The PROWESS
and ENHANCE studies, and the statistical analyses for this manuscript,
were funded by Eli Lilly.
References
1. NIH Biomarkers Definitions Working Group: Biomarkers and sur-
rogate endpoints: preferred definitions and conceptual
framework. Clin Pharmacol Ther 2001, 69:89-95.
2. Vasan RS: Biomarkers of cardiovascular disease: molecular
basis and practical considerations. Circulation 2006,
113:2335-2362.
3. Moe GW: B-type natriuretic peptide in heart failure. Curr Opin
Cardiol 2006, 21:208-214.
4. McKie PM, Burnett JC Jr: B-type natriuretic peptide as a biomar-
ker beyond heart failure: speculations and opportunities.
Mayo Clin Proc 2005, 80:1029-1036.
5. Qaseem A, Snow V, Barry P, Hornbake ER, Rodnick JE, Tobolic T,
Ireland B, Segal JB, Bass EB, Weiss KB, Green L, Owens DK,
Joint American Academy of Family Physicians/American College of
Physicians Panel on Deep Venous Thrombosis/Pulmonary Embo-
lism: Current diagnosis of venous thromboembolism in pri-
mary care: a clinical practice guideline from the American
Academy of Family Physicians and the American College of
Physicians. Ann Intern Med 2007, 20:454-458.
6. Grau E, Tenías JM, Soto MJ, Gutierrez MR, Lecumberri R, Pérez JL,
Tiberio G, RIETE Investigators: D-dimer levels correlate with
mortality in patients with acute pulmonary embolism: Findings
from the RIETE registry. Crit Care Med 2007, 35:1937-1941.
7. Panacek EA, Marshall JC, Albertson TE, Johnson DH, Johnson S,
MacArthur RD, Miller M, Barchuk WT, Fischkoff S, Kaul M, Teoh L,
Van Meter L, Daum L, Lemeshow S, Hicklin G, Doig C, Monoclonal
Anti-TNF: a Randomized Controlled Sepsis Study Investigators:
Efficacy and safety of the monoclonal anti-tumor necrosis fac-
tor antibody F(ab')2 fragment afelimonmab in patients with
severe sepsis and elevated interleukin-6 levels. Crit Care Med
2004, 32:2173-2182.
8. Dellinger RP, Carlet JM, Masur H, Gerlach H, Calandra T, Cohen
J, Gea-Banacloche J, Keh D, Marshall JC, Parker MM, Ramsay G,
Zimmerman JL, Vincent JL, Levy MM, Surviving Sepsis Campaign
Management Guidelines Committee: Surviving sepsis campaign
guidelines for management of severs sepsis and septic shock.
Crit Care Med 2004, 32:858-873.
9. Levy MM, Fink MP, Marshall JC, Abraham E, Angus D, Cook D,
Cohen J, Opal SM, Vincent JL, Ramsay G, SCCM/ESICM/ACCP/
ATS/SIS: 2001 SCCM/ESICM/ACCP/ATS/SIS International
Sepsis Definitions Conference. Crit Care Med 2003,
31:1250-1256.
10. Griffin JH, Fernandez JA, Gale AJ, Mosnier LO: Activated protein
C. J Thromb Haemost 2007:73-80.
11. Mosnier LO, Zlokovic BV, Griffin JH: The cytoprotective protein
C pathway. Blood 2007, 109:3161-3172.
12. Gierer P, Hoffmann JN, Mahr F, Menger MD, Mittlmeier T, Gradl G,
Vollmar B: Activated protein C reduces tissue hypoxia, inflam-
mation, and apoptosis in traumatized skeletal muscle during
endotoxemia. Crit Care Med 2007, 35:1966-1971.
13. Franscine N, Bachli EB, Blau N, Leikaurf MS, Schaffner A, Schoe-
don G: Gene expression profiling of inflamed human endothe-
lial cells and influence of activated protein C. Circulation 2004,
10:2903-2909.
14. Griffin JH, Fernández JA, Mosnier LO, Liu D, Cheng T, Guo H, Zlok-
ovic BV: The promise of protein C. Blood Cells Mol Dis 2006,
36:211-216.
15. Bernard GR, Vincent JL, Laterre PF, LaRosa SP, Dhainaut JF,
Lopez-Rodriguez A, Steingrub JS, Garber GE, Helterbrand JD, Ely
EW, Fisher CJ Jr, Recombinant human protein C Worldwide Eval-
uation in Severe Sepsis PROWESS) study group: Efficacy and
safety of recombinant activated protein C for severe sepsis. N
Engl J Med 2001, 344:699-709.
16. Sheth SB, Carvalho AC: Protein S and C alterations in acutely
ill patients. Am J Hematol 1999, 36:14-19.
17. Yan SB, Helterbrand JD, Hartman DL, Wright TJ, Bernard GD:
Low levels of protein C are associated with poor outcome in
severe sepsis. Chest 2001, 120:915-922.
18. Kinasewitz GT, Yan SB, Basson B, Comp P, Russell JA, Cariou A,
Um SL, Utterback B, Laterre PF, Dhainaut JF, PROWESS Sepsis
Study Group: Universal changes in biomarkers of coagulation
and inflammation occur in patients with severe sepsis, regard-
less of causative micro-organism. Crit Care 2004, 8:R82-R90.
19. Fourrier F, Chopin C, Goudemand J, Hendrycx S, Caron C, Rime
A, Marey A, Lestavel P: Septic shock, multiple organ failure, and
disseminated intravascular coagulation: compared patterns of
antithrombin III, Protein C and protein S deficiencies. Chest
1992, 101:816-823.
20. Lorente JA, García-Frade LJ, Landín L, de Pablo R, Torrado C,
Renes E, García-Avello A: Time course of hemostatic abnormal-
ities in sepsis and its relation to outcome.
Chest 1993,
103:1536-1542.
21. Mesters RM, Helterbrand J, Utterback BG, Yan B, Chao YB, Fern-
andez JA, Griffin JH, Hartman DL: Prognostic value of protein C
concentrations in neutropenic patients at high risk of severe
septic complications. Crit Care Med 2000, 28:2209-2216.
22. Macias WL, Nelson DR: Severe protein C deficiency predicts
early death in severe sepsis. Crit Care Med 2004:S223-S228.
23. Ely EW, Laterre PF, Angus DC, Helterbrand JD, Levy H, Dhainaut
JF, Vincent JL, Macias WL, Bernard GR, PROWESS Investigators:
Drotrecogin alfa (activated) administration across clinically
important subgroups of patients with severe sepsis. Crit Care
Med 2003, 31:12-19.
24. Peters M, Fijnvandraat K, Derkx B, Stassen M, Van Deventer SJH:
Severely reduced protein C levels predict a high mortality in
meningococcal shock [abstract]. Thromb Haemost 1993,
69:A2337.
25. Hazelzet JA, Van der Voort E, Lindemans J, Ter Heerdt PGJ, Nei-
jens HJ: Relation between cytokines and routine laboratory
data in children with septic shock and purpura. Intensive Care
Med 1994, 20:371-374.
26. Fijnvandraat K, Derkx B, Peters M, Bijlmer R, Sturk A, Prins MH, van
Deventer SJ, ten Cate JW: Coagulation activation and tissue
necrosis in meningococcal septic shock: severely reduced
protein C levels predict a high mortality. Thromb Haemost
1995, 73:15-20.
27. Brandtzaeg P, Sandset PM, Joo GB, Ovstebo R, Abildgaard U,
Kieruef P: The quantitative association of plasma endotoxin,
antithrombin, protein C, extrinsic pathway inhibitor, and fibri-
nopeptide A in systemic meningococcal disease. Thromb Res
1989, 55:459-470.
28. Philippe J, Offner F, Leroux-Roels G, Vogelaers D, Baele G: Plas-
minogen activator inhibitor-1, protein C, antithrombin III and
tissue plasminogen activator activities in the early phase of
septic shock [abstract]. Thromb Haemost 1989, 65:A1836.
29. Hesselvik JF, Malm J, Dahlback B, Blomback M: Protein C, protein
S and C4bbinding protein in severe infection and septic shock.
Thromb Haemost 1991, 65:126-129.
30. Leclerc F, Hazelzet J, Jude B, Hofhuis W, Hue V, Martinot A, Van
der Voort E: Protein C and S deficiency in severe infectious pur-
pura of children: a collaborative study of 40 cases. Intensive
Care Med 1992, 18:202-205.
31. Román J, Velasco F, Fernandez F, Fernandez M, Villalba R, Rubio
V, Torres A: Protein C, protein S, and C4b-binding protein in
neonatal severe infection and septic shock. J Perinat Med
1992, 20:111-116.
32. Piette WW, Shasby DM, Kealey GP, Olson JD: Retiform purpura
is a sign of severe acquired protein C deficiency and risk of
progression to purpura fulminans in sepsis and disseminated
intravascular coagulation [abstract]. Clin Res 1993, 41:A253.
33. Powars D, Larsen R, Johnson J, Hulbert T, Sun T, Patch MJ, Francis
R, Chan L: Epidemic meningococcemia and purpura fulminans
with induced protein C deficiency. Clin Infect Dis 1993,
17:254-261.
34. Shorr AF, Bernard GR, Dhainaut JF, Russell JR, Macias WL, Nel-
son DR, Sundin DP: Protein C concentrations in severe sepsis:
Available online />Page 11 of 11
(page number not for citation purposes)
an early directional change in plasma levels predicts outcome.
Crit Care 2006, 10:R92.
35. Vincent JL, Bernard GR, Beale R, Doig C, Putensen C, Dhainaut
JF, Artigas A, Fumagalli R, Macias W, Wright T, Wong K, Sundin
DP, Turlo MA, Janes J: Drotrecogin alfa (activated) treatment in
severe sepsis from the global open-label trial ENHANCE:
further evidence for survival and safety and implications for
early treatment. Crit Care Med 2005, 33:2266-2277.
36. Li Z, Meredith MP, Hoseyni MS: A method to assess the propor-
tion of treatment effect explained by a surrogate endpoint.
Stat Med 2001, 20:3175-3188.
37. Remick DG: Pathophysiology of sepsis. Am r J Pathol 2007,
170:1435-1444.
38. Hawker F: Liver dysfunction in critical illness. Anaesth Intensive
Care 1991, 19:165-181.
39. Geier A, Fickert P, Trauner M: Mechanisms of disease: mecha-
nisms and clinical implications of cholestasis in sepsis. Nat
Clin Pract Gastroenterol Hepatol 2006, 3:574-585.
40. De Gruttola VG, Clax P, DeMets DL, Downing GJ, Ellenberg SS,
Friedman L, Gail MH, Prentice R, Wittes J, Zeger SL: Considera-
tions in the evaluation of surrogate endpoints in clinical trials:
summary of a National Institutes of Health Workshop. Control-
led Clin Trials 2001, 22:485-502.
41. Freedman LS, Graubard BI, Schatzkin A: Statistical validation of
intermediate endpoints for chronic diseases. Stat Med 1992,
11:167-178.
42. Vangerow B, Shorr AF, Wyncoll D, Janes J, Nelson D, Reinhart K:
The Protein C pathway: implications for the design of the
RESPOND study. Crit Care 2007:S4.