Plastics Engineering 3E Episode 2 pptx
Bạn đang xem bản rút gọn của tài liệu. Xem và tải ngay bản đầy đủ của tài liệu tại đây (2.26 MB, 35 trang )
General Properties of Plastics
19
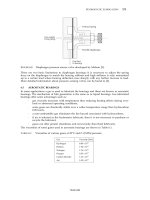
In many respects the stress-strain graph for a plastic is similar to that for a
metal
(see
Fig.
1.2).
At low strains there is an elastic region whereas at high strains there is a non-
linear relationship between stress and strain and there is a permanent element
to the strain. In the absence of any specific information for a particular plastic,
design strains should normally
be
limited to
1%.
Lower values
(-0.5%)
are
recommended for the more brittle thermoplastics such as acrylic, polystyrene
and values
of
0.2-0.3%
should be used for thermosets.
The effect of material temperature is illustrated in Fig. 1.3.
As
temperature
is increased the material becomes more flexible and
so
for a given stress the
Fig.
1.2
Qpical stress-strain graph
for
plastics
-20°C
20°C
50°C
70°C
Strain
(7")
f
Fig.
1.3
Effect
of
material temperature on stress-strain behaviour
of
plastics
20
General Properties of Plastics
material deforms more. Another important aspect to the behaviour of plastics
is the effect of strain rate. If a thermoplastic is subjected to a rapid change in
strain it appears stiffer than if the same maximum strain were applied but at a
slower rate. This is illustrated in Fig.
1.4.
I
11
OOlZ345
Strain
(“A)
Fig.
1.4
Effect
of
strain
rate
on
stress-strain
behaviour
of
plastics
It
is
important to realise also that within the range of grades that exist for a
particular plastic, there can
be
significant differences in mechanical properties.
For example, with polypropylene for each
1
kg/m3 change in density there is a
corresponding
4%
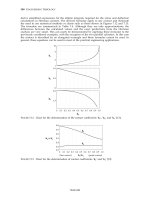
change in modulus. Fig.
1.5
illustrates the typical variation
which occurs for the different grades of
ABS.
It may be seen that very often a
grade of material selected for some specific desirable feature (e.g. high impact
strength) results in a decrease in some other property of the material (e.g.
tensile strength).
The stiffness of a plastic is expressed in terms of a modulus of elasticity.
Most values of elastic modulus quoted in technical literature represent the slope
of a tangent to the stress-strain curve at the origin (see Fig.
1.6).
This is often
referred to
as
Youngs modulus,
E,
but it should
be
remembered that for a plastic
this will not be a constant and,
as
mentioned earlier, is only useful for quality
General Properties of Plastics
21
50
High-heat grade
Medium-impact
Hig h-impact
-impact
40
Strain
(%)
Fig.
1.5
Effect
of
grade
on
mechanical properties
of
ABS
Slope
represents
tangent,
OrYoung‘s
modulus
‘4/
/k
sm
0
c’
Strain
Fig.
1.6
Tangent and secant
modulus
control purposes, not for design. Since the tangent modulus at the origin is
sometimes difficult to determine precisely, a secant modulus is often quoted to
remove any ambiguity.
A
selected strain value of, say
2%
(point
C’,
Fig.
1.6)
enables a precise point,
C,
on the stress-strain curve to
be
identified. The slope
of a line through
C
and
0
is the secant modulus. npical short-term mechanical
22
General Roperties of Plastics
properties
of
plastics are given
in
Table
1.5.
These are given for illustration
purposes. For each type of plastic there
are
many different grades and a wide
variety
of
properties are possible. The literature supplied by the manufacturers
should be consulted in specific instances.
Table 1.5
Short-term properties
of
some important plastics
Material
Tensile Flexural
%
Density strength modulus elongation
(kg/m3)
(MN/m*)
(GN/m2) at break Price*
ABS
(high
impact)
Acetal (homopolymer)
Acetal (copolymer)
Acrylic
Cellulose acetate
CAB
Modified PPO
Nylon 66
Nylon 66 (33% glass)
PEEK
PEEK (30% carbon)
PET
PET (36% glass)
Phenolic (mineral filled)
Poly amide-imide
Polycarbonate
Poly etherimide
Pol yethersulphone
Poly imide
Polypropylene
Poly sulphone
Polystyrene
Polythene
(LD)
Polythene
(HD)
rn
PVC (rigid)
PVC (flexible)
SAN
DMC (polyester)
SMC (polyester)
EPOXY
1040
1420
1410
1180
1280
1190
1 200
1060
1140
1380
1300
1400
1360
1630
1690
1400
1150
1270
1370
1420
905
1240
1050
920
950
2100
1400
1300
1080
1800
1800
38
68
70
70
30
25
70
45
70
115
62
240
75
180
55
185
65
105
84
72
33
70
40
10
32
25
50
14
72
40
70
2.2
2.8
2.6
2.9
1.7
1.3
3.0
2.3
2.8
5.1
3.8
14
3
12
8
.O
4.5
2.8
3.3
2.6
2.5
1.5
2.6
3.0
0.2
1.2
0.5
3.0
0.007
3.6
9.0
11.0
8
40
65
2
30
60
3
70
60
4
4
1.6
70
3
0.8
12
100
60
60
8
150
80
400
150
200
80
300
2
2
3
1.5
2.1
3.5
3.3
2.5
3.2
8.3
3.9
4.0
-
-
42
44
3.0
3.5
1.25
4.2
13.3
150
1
11
1.1
0.83
1.1
13.3
0.88
0.92
1.8
1.5
1.3
67
-
*On a weight basis, relative to polypropylene.
Material Selection
for
Strength
If,
in service, a material is required to have a certain strength in order to
per€orm
its function satisfactorily then a useful way to compare the structural efficiency
of
a range of materials is to calculate their strength desirability factor.
Consider a structural member which is essentially a beam subjected to
bending (Fig.
1.7).
Irrespective of the precise nature of the beam loading the
General Properties of Plastics
23
Fig.
1.7
Beam
subjected
to
bending
maximum stress,
0,
in the beam will be given by
MmaX(dl2)
-
MInaX(dl2)
(T=
-
I
bd2/12
Assuming that we are comparing different materials on the basis that the
mean length, width and loading is fixed but the beam depth
is
variable then
equation
(1.1)
may
be
written as
(T
=
/?,Id2 (1.2)
where
/?I
is
a constant.
But the weight,
w,
of the beam is given by
w
=
pbdL (1.3)
So
substituting for
d
from
(1.2)
into
(1.3)
w
=
/32p/(T”2
(1.4)
where
Bz
is
the same constant for all materials.
be
given by
Hence, if we adopt loading/weight as a desirability factor,
Df,
then
this
will
(Til2
Df
=
-
(1.5)
P
where
cry
and
p
are the strength and density values for the materials being
compared.
Similar desirability factors may
be
derived for other geometries such as
struts, columns etc. This concept is taken further later where material costs
are taken into account and Tables
1.1
1
and
1.12
give desirability factors for a
range of loading configurations and materials.
Material
Selection
for
Stiffness
If
in the service of
a
component it is the deflection, or stiffness, which is
the limiting factor rather than strength, then it is necessary to
look
for a
different desirability factor in the candidate materials. Consider the beam situ-
ation described above. This time, irrespective of the loading, the deflection,
6,
General Properties of Plastics
24
will
be
given by
6=a1
(G)
where
a1
is a constant and
W
represents the loading.
The stiffness may then be expressed as
W
where
a2
is a constant and again it is assumed that the beam width and length
are
the same in all cases.
Once again the beam weight will be given by equation (1.3)
so
substituting
for
d
from equation
(1.7)
(1.8)
Hence, the desirability factor,
Df
,
expressed as maximum stiffness for
1/3
w
=
(~3p/E
minimum weight will be given by
where
E
is the elastic modulus of the material in question and
p
is the density.
As
before a range of similar factors can be derived for other structural elements
and these are illustrated in Section 1.4.6. (Tables 1.11 and 1.12) where the
effect of material cost is also taken into account. Note also that since for
plastics the modulus,
E,
is
not a constant it
is
often necessary to use a long-
term (creep) modulus value in equation
(1.9)
rather than the short-term quality
control value usually quoted in trade literature.
Ductility.
A
load-bearing device or component must not distort
so
much
under the action of the service stresses that its function is impaired, nor must it
fail by rupture, though local yielding may be tolerable. Therefore, high modulus
and high strength, with ductility, is the desired combination
of
attributes.
However, the inherent nature
of
plastics is such that high modulus tends to
be associated with low ductility and steps that are taken to improve
the
one
cause the other to deteriorate. The major effects
are
summarised
in
Table 1.6.
Thus it may be seen that there is
an
almost inescapable rule by which increased
modulus is accompanied by decreased ductility and vice versa.
Creep
and
Recovery Behaviour.
Plastics exhibit
a
time-dependent strain
response to a constant applied stress. This behaviour is called creep.
In
a
similar fashion if the stress on a plastic is removed it exhibits a time dependent
recovery of strain back towards its original dimensions.
This
is illustrated in
General Properties of Plastics
25
Table
1.6
Balance between stiffness and ductility in thermoplastics
Effect
on
Modulus Ductility
Reduced temperature increase
decrease
Increased straining rate
increase decrease
Multiaxial
stress
field increase
decrease
Incorporation
of
plasticizer
decrease increase
Incorporation
of
rubbery phase decrease
increase
Incorporation
of
glass fibres
increase decrease
Incorporation
of
particulate filler increase
decrease
2.
As
stress is maintained,
sample
deforms
Icreeps)
viscoelostically
to
Point
B,
3.
Load is removed, and sample
Paint
C
immediately.
Viscoelastic deformation recovers
elastically
to
Elastic recowry
t
1
Viscoelastic recovery
Time
-
1.
Load
is
opplied instantaneously,
resulting in strain
A
4.
Sample recovers viscoelastically
to
Point
D
Fig.
1.8
npical Creep and recovery behaviour
of
a plastic
Fig.
1.8
and because of the importance of these phenomena in design they are
dealt with in detail in Chapter
2.
Stress
Relaxation.
Another important consequence
of
the viscoelastic nature
of plastics is that if they are subjected to a particular strain and this strain is
held constant it is found that
as
time progresses, the stress necessary to maintain
this strain decreases.
This
is termed stress relaxation and is of vital importance
in the design of gaskets, seals, springs and snap-fit assemblies. This subject
will also be considered in greater detail in the next chapter.
Creep
Rupture.
When a plastic is subjected to a constant tensile
stress
its
strain increases until a point is reached where the material fractures.
This
is
called creep rupture or, occasionally, static fatigue. It is important for designers
26
General Properties of Plastics
to be aware of this failure mode because it is a common error, amongst those
accustomed to dealing with metals, to assume that
if
the material is capable of
withstanding the applied (static) load in the short term then there need be no
further worries about it.
This
is not the case with plastics where it is necessary
to use long-term design data, particularly because some plastics which are tough
at short times tend to become embrittled at long times.
Fatigue.
Plastics are susceptible to brittle crack growth fractures
as
a result
of cyclic stresses, in much the same way as metals are. In addition, because
of their high damping and low thermal conductivity, plastics are also prone to
thermal softening if the cyclic stress or cyclic rate is high. The plastics with
the best fatigue resistance are polypropylene, ethylene-propylene copolymer
and PVDF. The fatigue failure of plastics is described in detail in Chapter
2.
Toughness.
By toughness we mean the resistance to fracture. Some plastics
are inherently very tough whereas others are inherently brittle. However, the
picture
is
not that simple because those which are nominally tough may become
embrittled due to processing conditions, chemical attack, prolonged exposure
to constant stress, etc. Where toughness is required in a particular application it
is very important therefore to check carefully the service conditions in relation
to the above type of factors. At mom temperature the toughest unreinforced
plastics include nylon
66,
LDPE, LLDPE, EVA and polyurethane structural
foam. At sub-zero temperatures it
is
necessary to consider plastics such as
ABS,
polycarbonate and EVA. The whole subject of toughness will be considered
more fully in Chapter
2.
1.4.2
Degradation
Physical
or
Chemical
Attack.
Although one of the major features which might
prompt a designer
to
consider using plastics is corrosion resistance, nevertheless
plastics are susceptible to chemical attack and degradation. As with metals, it
is
often difficult to predict the performance of a plastic in
an
unusual environment
so
it is essential to check material specifications and where possible carry out
proving trials. Clearly, in the space available here it is not possible to give
precise details on the suitability
of
every plastic in every possible environment.
Therefore
the
following sections give an indication of the general causes of
polymer degradation to alert the designer to a possible problem.
The degradation of a plastic occurs due to a breakdown
of
its
chemical
structure. It should
be
recognised that
this
breakdown
is
not necessarily caused
by concentrated acids or solvents. It can occur due
to
apparently innocuous
mediums such as water
(hydrolysis),
or oxygen
(oxidation).
Degradation of
plastics
is
also caused by heat, stress and radiation. During moulding the mat-
erial is subjected to the first two of these and
so
it is necessary to incorporate
stabilisers and antioxidants into the plastic to maintain the properties of the
material. These additives also help to delay subsequent degradation
for
an
acceptably long time.
General Properties of Plastics
27
As
regards the general behaviour of polymers, it is widely recognised that
crystalline plastics offer better environmental resistance than amorphous plas-
tics.
This
is as a direct result of the different structural morphology of these
two classes of material (see Appendix A). Therefore engineering plastics which
are
also crystalline e.g. Nylon
66
are at
an
immediate advantage because they
can offer an attractive combination of load-bearing capability and an inherent
chemical resistance. In this respect the anival of crystalline plastics such as
PEEK and polyphenylene sulfide (PPS) has set new standards in environmental
resistance, albeit at a price. At room temperature there is no known solvent for
PPS, and PEEK is only attacked by
98%
sulphuric acid.
Weathering.
This generally occurs as a result of the combined effect of
water absorption and exposure to ultra-violet radiation (u-v). Absorption of
water can have a plasticizing action on plastics which increases flexibility but
ultimately (on elimination of the water) results in embrittlement, while
u-v
causes breakdown of the bonds in the polymer chain. The result is general
deterioration of physical properties.
A
loss
of
colour or clarity (or both) may
also occur. Absorption of water reduces dimensional stability of moulded arti-
cles. Most thermoplastics, in particular cellulose derivatives, are affected, and
also polyethylene, PVC, and nylons.
Oxidation.
This is caused by contact with oxidising acids, exposure to
u-v,
prolonged application of excessive heat,
or
exposure to weathering. It results
in a deterioration of mechanical properties (embrittlement and possibly stress
cracking), increase in power factor, and loss of clarity. It affects most thermo-
plastics to varying degrees, in particular polyolefins, PVC, nylons, and cellulose
derivatives.
Environmental
Stress
Cracking
(ESC).
In some plastics, brittle cracking
occurs when the material is in contact with certain substances whilst under
stress. The stress may be externally applied in which case one would be
prompted to take precautions. However, internal or residual stresses introduced
during processing are probably the more common cause of ESC. Most organic
liquids promote ESC in plastics but in some cases the problem can be caused
by a liquid which one would not regard as
an
aggressive chemical. The classic
example of ESC is the brittle cracking of polyethylene washing-up bowls due
to the residual stresses at the moulding gate (see injection moulding, Chapter
4)
coupled with contact with the aqueous solution of washing-up liquid. Although
direct attack on the chemical structure of the plastic is not involved in ESC
the problem can be alleviated by controlling structural factors.
For
example,
the resistance of polyethylene is very dependent
on
density, crystallinity, melt
flow index
(MFI)
and molecular weight. As well as polyethylene, other plastics
which are prone to ESC are ABS and polystyrene.
The mechanism of ESC is considered to be related to penetration of the
promoting substance at surface defects which modifies the surface energy and
promotes fracture.
28
General Properties of Plastics
1.43
Wear
Resistance
and
Frictional
Properties
There is a steady rate of increase in the use of plastics in bearing applications
and in situations where there
is
sliding contact e.g. gears, piston rings, seals,
cams, etc. The advantages of plastics are low rates of wear in the absence
of
conventional lubricants, low coefficients of friction, the ability to absorb shock
and vibration and the ability to operate with low noise and power consumption.
Also when plastics have reinforcing fibres they offer high strength and load
carrying ability. Qpical reinforcements include glass and carbon fibres and
fillers include
PTFE
and molybdenum disulphide in plastics such
as
nylon,
polyethersulphone (PES), polyphenylene sulfide (PPS), polyvinylidene fluoride
(PVDF) and polyetheretherketone (PEEK).
The friction and wear of plastics are extremely complex subjects which
depend markedly on the nature of the application and the properties
of
the
material. The frictional properties of plastics differ considerably from those of
metals. Even reinforced plastics have modulus values which are much lower
than metals. Hence metalkhennoplastic friction is characterised by adhesion
and deformation which results in frictional forces that are not proportional to
load but rather to speed. Table
1.7
gives some typical coefficients of friction
for plastics.
Table
1.7
Coefficients
of
friction and relative wear rates
for
plastics
Material
Coefficient
of
friction
Relative
Static Dynamic wear rate
Nylon
0.2 0.28
33
Nylodglass
0.24 0.3 1 13
N y lodcarbon
0.1 0.11 1
Polycarbonate
0.31 0.38
420
Polycarbonate/glass
0.18
0.20
5
Polybutylene terephthalate (PBT)
0.19 0.25
35
PBT/glass
0.11 0.12 2
Polyphenylene sulfide (PPS)
0.3
0.24
90
PPS/glass
0.15 0.17 19
PPS/carbon
0.16 0.15
13
Acetal
0.2 0.21
-
m
0.04
0.05
-
The wear rate of plastics is governed by several mechanisms. The primary
one is adhesive wear which
is
characterised by fine particles
of
polymer being
removed from the surface. This
is
a small-scale effect and is a common
occurrence in bearings which are performing satisfactorily. However, the other
mechanism
is
more serious and occurs when the plastic becomes overheated
to the extent where large troughs of melted plastic are removed. Table
1.7
General Properties of Plastics
29
shows typical primary wear rates for different plastics, the mechanism of wear
is complex the relative wear rates may change depending on specific circum-
stances.
In linear bearing applications the suitability of a plastic is usually determined
from its PV rating. This is the product of P (the bearing load divided by the
projected bearing area) and
V
(the linear shaft velocity). Fig.
1.9
shows the
limiting PV lines for a range of plastics
-
combinations of P and
V
above
the lines are not permitted. The PV ratings may
be
increased if the bearing
is
lubricated or the mode
of
operation is intermittent. The PV rating will be
decreased if the operating temperature is increased. Correction factors for these
variations may
be
obtained from materialhearing manufacturers. The plastics
with the best resistance to wear
are
ultra high molecular weight polyethylene
(used in hip joint replacements) and
PTFE
lubricated versions of nylon, acetal
and PBT.
It
is not recommended to use the same plastic for both mating surfaces
in applications such
as
gear wheels.
Rubbing
velocity,
(V(ds)
Fig.
1.9
Qpical
P-V
ratings
for
plastics
rubbing
on
steel
30
General
Properties
of
Plastics
L4,4
Special
Properties
Thermal
Properties.
Before
considering
conventional
thermal
properties
such
as
conductivity
it
is
appropriate
to
consider
briefly
the
effect
of
temperature
on
the
mechanical
properties
of
plastics.
It
was
stated
earlier
that
the
properties
of
plastics
are
markedly
temperature
dependent.
This
is
as
a
result
of
their
molecular
structure.
Consider
first
an
amorphous
plastic
in
which
the
molecular
chains
have
a
random
configuration.
Inside
the
material,
even
though
it
is
not
possible
to
view
them,
we
know
that
the
molecules
are
in
a
state
of
continual
motion.
As
the
material
is
heated
up
the
molecules
receive
more
energy
and
there
is
an
increase
in
their
relative
movement.
This
makes
the
material
more
flexible.
Conversely
if
the
material
is
cooled
down
then
molecular
mobility
decreases
and
the
material
becomes
stiffer.
With
plastics
there
is
a
certain
temperature,
called
the
glass
tramition
temperature,
Tg9
below
which
the
material
behaves
like
glass
Le+
it
is
hard
and
rigid.
As
can
be
seen
from
Table
lm8
the
value
for
Tg
for
a
particular
plastic
is
not
necessarily
a
low
temperature.
This
immediately
helps
to
explain
some
of
the
differences
which
we
observe
in
plastics.
For
example,
at
room
tempera+
ture
polystyrene
and
acrylic
are
below
their
respective
Ts
values
and
hence
we
observe
these
materials
in
their
glassy
state
Note,
however,
that
in
contrast,
at
room
temperature,
polyethylene
is
above
its
glass
transition
temperature
and
so
we
observe
a
very
flexible
materialm
When
cooled
below
its
Tg
it
then
becomes
a
hard,
brittle.
solid,
Plastics
can
have
several
transitions.
The
main
Tg
is
called
the
glass-rubber
transition
and
signifies
a
change
from
a
flexible,
tough
material
to
a
glassy
state
in
which
the
material
exhibits
stiff-
ness,
low
creep
and
toughness
although
with
a
sensitivity
to
notches.
At
lower
temperatures
there
is
then
a
secondary
transition
characterised
by
a
change
to
a
hard,
rigid,
brittle
statet
It
should
be
noted
that
although
Table
1.8
gives
specific
values
of
Tg
for
different
polymers,
in
reality
the
glass-transition
temperature
is
not
a
material
constant,
As
with
many
other
properties
of
polymers
it
will
depend
on
the
testing
conditions
used
to
obtain
it.
In
the
so-called
crystalline
plastics
the
structure
consists
of
both
crystalline
(ordered)
regions
and
amorphous
(random)
regions.
When
these
materials
are
heated
there
is
again
increased
molecular
mobility
but
the
materials
remain
relatively
stiff
due
to
the
higher
forces
between
the
closely
packed
molecules.
When
the
crystalline
plastics
have
their
temperature
reduced
they
exhibit
a
glass
transition
temperature
associated
with
the
amorphous
regions.
At
room
temperature
polypropylene,
for
example,
is
quite
rigid
and
tough,
not
because
it
is
below
its
T,
but
because
of
the
strong
forces
between
the
molecules
in
the
crystalline
regions.
When
it
is
cooled
below
-10°C
it
becomes
brittle
because
the
amorphous
regions
go
below
their
Tg'
In
the
past
a
major
limitation
to
the
use
of
plastics
materials
in
the
engi-
neering
sector
has
been
temperature.
This
limitation
arises
not
only
due
to
the
General
Properties
of
Plastics
31
Table
1.8
TLP
icd
Thermd
properties
of
materials
Material
Thermal
Glass
Specific
Thermal
Coeff
.
of
diffusivity
transition
Max.
Density
heat
conductivity
therm
exp
(m2/s)
Temp,
operating,
(kg/m3)
Wkg
K)
(WIM)
(ClmlmpC)
IO-'
TJC)
Temp
("C)
ABS
Acetal
(homopolymer)
Acetal
(copdymer)
Acrylic
Cellulose
acetate
CAB
EPOXY
Modified
PPO
Nylon
66
Nylon
66
(33%
glass)
PEEK
PEEK
(30%
carbon)
PET
PET
(36%
glass)
Phenolic
(glass
filled)
Poly
amide-imide
Polycarbonate
Polyester
Pol
yetherimide
Poi
yethersulphone
Polyimide
Polyphenylene
sulfide
Polypropylene
Polysulphone
Polystyrene
Polythene
(LD)
Polythene
(HP)
PTFE
PVC
(igid)
PVC
(flexible)
SAN
DMC
(plyester)
SMC
(polyester)
Polystyrene
foam
PU
foam
Stainless
steel
Nickel
chrome
alloy
Zinc
1040
1420
1410
1180
1280
1190
1200
1060
1
I40
1380
1300
1400
1360
1630
1700
1400
1150
1200
1270
1370
1420
1340
905
1240
1050
920
950
2100
1400
1300
1080
1800
1800
32
32
7855
7950
7135
8940
I
.3
1.5
I
.5
1.5
16
1.6
0.8
1.7
1,6
-
-
1
.o
-
-
1.2
1.2
-
-
-
-
2.0
1.3
1.3
2.2
2.2
1
.o
0.9
1
.$
1.3
-
-
-
-
0,49
0.39
0.39
-r
0.25
0.2
0.2
0.2
0.15
0.14
0.23
0.22
0.24
0.52
-
-
0.2
0.5
0.25
Ob2
0.2
0.22
1.18
-
-
-
0.20
0.15
0.24
0.25
0.25
0.16
0.14
0.17
0.2
0.2
0.032
0.032
90
12
111
400
-
90
80
95
70
100
100
70
60
90
30
48
14
90
40
18
36
65
100
56
55
45
49
€00
56
80
200
120
140
70
140
70
20
20
YL
10
14
39
16
1.7
0.7
0.72
1.09
1.04
27
-
-
+
Ul
1
&33
1.47
0.65
0-6
1.17
1.57
0.7
0.7
0.81
115
-85
-85
105
1c
-
-
4
56
I43
75
M
Iy
d
-
260
149
200
230
40
85
-
10
180
100
-120
-120
-1
13
80
80
115
-
-
-
-
-
-
7
lrrr
70
85
90
50
60
60
130
120
90
100
204
255
110
150
185
220
125
170
180
260
150
10
170
50
50
55
250
50
50
60
130
130
-
-
-
800
900
-
-
reduction
in
mechanical
properties
at
high
temperatures,
including
increased
propensity
to
creep,
but
also
due
to
limitations
on
the
continuous
working
temperature
causing
permanent
damage
to
the
material
as
a
result
of
thermal
and
oxidative
degradation.
Significant
gains
in
property
retentiun
at
high
temper-
atures
with
crystalline
polymers
have
been
derived
fmrn
the
incorporation
of
32 General Properties of Plastics
fibrous reinforcement, but the development of new polymer matrices is the key
to further escalation of the useful temperature range.
Table 1.8 indicates the service temperatures which can
be
used with a range
of plastics. It may be seen that there are now commercial grades of unreinforced
plastics rated for continuous use at temperatures in excess of 200°C. When glass
or carbon fibres
are
used the service temperatures can approach 300°C.
The other principal thermal properties of plastics which
are
relevant to design
are
thermal conductivity and coefficient of thermal expansion. Compared with
most materials, plastics offer very low values of thermal conductivity, partic-
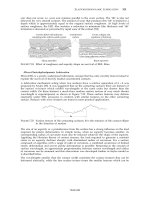
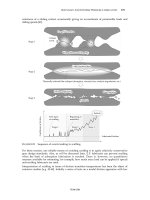
ularly if they are foamed. Fig. 1.10 shows comparisons between the thermal
conductivity of a selection of metals, plastics and building materials. In contrast
to their low conductivity, plastics have high coefficients
of
expansion when
compared with metals. This is illustrated in Fig. 1.1 1 and Table 1.8 gives fuller
information on
the
thermal properties of plastics and metals.
25mm
Wyurelhanc
4Omm
Pdystyrrw
LSmn
Hlreral
d
50mm
Cork
65mn
Fibnbmd
1LOm
softrrmd
3Barm
Concrpl~
blocks
Equivalent thickness
of
common
building and insulatm materials
required
to achieve the
same
degree
of
insulaiion
Fig.
1.10
Comparative Thermal conductivities
for
a
range
of
materials
Electrical
Properties
Traditionally plastics have established themselves in
applications which require electrical insulation.
PTFE
and polyethylene
are
among the best insulating materials available. The material properties which
are
particularly relevant to electrical insulation are
dielectric strength, resistance
and
tracking.
The insulating property of any insulator will break down in a sufficiently
strong electric field. The dielectric strength is defined
as
the electric strength
(V/m) which an insulating material can withstand. For plastics the dielectric
strength can vary from
1
to
loo0
MV/m. Materials may
be
compared on the
basis of their relative permittivity (or dielectric constant). This is the ratio
of
the permittivity of the material to the permittivity of a vacuum. The ability of
a
General Properties of Plastics
33
250
$150
0
-
a
El
100
€
B
Fig.
1.1
1
lsrpical thermal
propexties
of
plastics
material to resist the flow of electricity is determined by its volume resistivity,
measured in
ohm
m. Insulators are defined
as
having volume resistivities greater
than about
104
ohm
m. Plastics are well above
this,
with values ranging from
about
108
to
10l6
ohm
m. These compare with a value
of
about ohm m for
copper. Although plastics are good insulators, local breakdown may occur due
to tracking.
This
is the name given to the formation of a conducting path (arc)
across the surface of the polymer. It can be caused by surface contamination
(for example dust and moisture) and is characterised by the development of
carbonised destruction of the surface carrying the arc. Plastics differ greatly
in their propensity to tracking
-
PTFE,
acetal, acrylic and PP/PE copolymers
offer very good resistance.
It is interesting to note that although the electrical insulation properties of
plastics have generally been regarded
as
one of their major advantages,
in
recent
years there has been a lot of research into the possibility of conducting plastics.
This
has been recognised
as
an
exciting development area for plastics because
electrical conduction if it could be achieved would offer advantages in designing
against the build up of static electricity and in shielding of computers, etc from
electro-magnetic interference
(EM).
There have been two approaches
-
coating
or compounding. In the former the surface of the plastic is treated with a
conductive coating (e.g. carbon or metal) whereas in the second, fillers such
as
brass, aluminium or steel are incorporated into the plastic. It is important
that the filler has a high aspect ratio (1ength:diameter) and
so
fibres or flakes of
metal
are
used. There has also been some work done using glass fibres which
are
coated with a metal before being incorporated into the plastic. Since the
fibre aspect ratio is critical in the performance of conductive plastics there can
34
General Properties of Plastics
be problems due to breaking up of fibres during processing. In
this
regard ther-
mosetting plastics have an advantage because their simpler processing methods
cause less damage to the fibres. Conductive grades of
DMC
are now available
with resistivities as low
as
7
x
ohm m.
Optical
Properties.
The optical properties
of
a plastic which are important
are refraction, transparency, gloss and light transfer. The reader
is
referred to
BS
4618:1972 for precise details on these terms. Table 1.9 gives data on the optical
properties of a selection of plastics. Some plastics may be optically clear (e.g.
acrylic, cellulosics and ionomers) whereas others may be made transparent.
These include epoxy, polycarbonate, polyethylene, polypropylene, polystyrene,
polysulphone and PVC.
Table 1.9
Typical properties of plastics
Refractive Light Dispersive
Material index
transmission
power
Acrylic
1.49 92 58
Polycarbonate
1.59 89 30-35
Polystyrene
1.59
88
31
CAB
1.49
85
-
36
SAN
1.57
-
-
Nylon
66
1.54
0
Flammability.
The fire hazard associated with plastics has always been
difficult to assess and numerous tests have been devised which attempt to
grade materials as regards flammability by standard small scale methods under
controlled but necessarily artificial conditions. Descriptions of plastics as
self-
extinguishing,
slow
burning,
$re
retardant
etc. have been employed to describe
their behaviour under such standard test conditions, but could never
be
regarded
as
predictions of the performance of the material in real fire situations, the
nature and scale
of
which can vary
so
much.
Currently there is a move away from descriptions such as
jre-retardant
or
self-extinguishing
because these could imply to uninformed users that the
material would not bum. The most common terminology for describing the
flammability characteristics
of
plastics is currently the
Critical
Oxygen Index
(COI).
This
is defined as the minimum concentration of oxygen, expressed as
volume per cent, in a mixture of oxygen and nitrogen that will just support
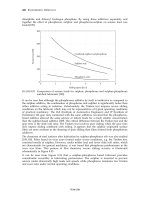
combustion under the conditions of test. Since
air
contains 21% oxygen, plastics
having a COI of greater than
0.21
are regarded
as
self-extinguishing. In practice
a higher threshold (say 0.27) is advisable to allow for unforeseen factors in a
particular fire hazard situation. Fig. 1.12 shows the typical COI values for a
range of plastics.
General Properties of Plastics
35
COI
-
Fig.
1.12
Oxygen
Index
Values
for
Plastics
Permeability.
The low density of plastics is an advantage in many situations
but the relatively loose packing of the molecules means that gases and liquids
can permeate through the plastic.
This
can be important in many applications
such
as
packaging or fuel
tanks.
It
is not possible to generalise about the
performance of plastics relative to each other or in respect to the performance
of a specific plastic in contact with different liquids and gases.
Some plastics
are
poor at offering resistance to the passage of fluids through
them whereas others are excellent. Their relative performance may
be
quantified
in terms of a permeation constant,
k,
given by
(1.10)
where
Q
=
volume of fluid passing through the plastic
d
=
thickness of plastic
A
=
exposed area
t
=
time
p
=
pressure difference across surfaces of plastic.
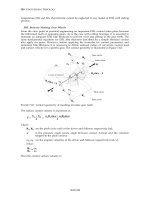
The main fluids of interest with plastics are oxygen and water vapour (for
packaging applications) and
C02
(for carbonated
drinks
applications). Fig. 1.13
and Fig.
1.14
illustrate the type
of
behaviour exhibited by a range of plastics.
In
some cases it is necessary to use multiple layers of plastics because no single
plastic offers the combination of price, permeation resistance, printability, etc.
required for the application. When multi-layers are used, an overall permeation
constant for the composite wall may
be
obtained from
(1.11)
1.4.5
Processing
A
key decision in designing with plastics is the processing method employed.
The designer must have a thorough knowledge of processing methods because
36
General Properties of Plastics
tl
1 1 1
I
Cellophane CA
-
PC
-
-
Oxygen
permeability (cc-25 pm/m2-24 h-atm)
Permeability data
for
a range
of
plastics Fig.
1.13
u)
EVOH
v
2)
3
loo-
-
a
ZY
L
10-
a
9
m
E
P
0
a
Nylon
1
10
100
lo00
10000
1OOOOO
tl
c
C02 permeability (cc-25 pdm2-24 h-atm)
Fig.
1.14
Permeability data
for
a range
of
plastics
plastics
are
unique in design terms in that they offer a wider choice of conver-
sion techniques than are available for any other material.
A
simple container
for example could be made by injection moulding, blow moulding or rotational
moulding; light fittings could be thermoformed or injection moulded. In this
brief introduction to designing with plastics it
is
not possible to do justice to the
General
Roperties
of
Plastics
37
range
of
processing
methods
available
for
plastics.
Therefore
Chapter
4
will
be
devoted
to
processing.
This
describes
the
suitability
of
particular
plastics
for
each
moulding
method
and
considers
the
limitations
which
these
place
on
the
designer.
L4,6
Costs
It
is
a
popular
misconception
that
plastics
are
cheap
materials.
They
are
not.
On
a
weight
basis
most
plastics
are
more
expensive
than
steel
and
only
slightly
less
expensive
than
aluminium.
Prices
for
plastics
can
range
from
about
;JE600
per
tonne
for
polypropylene
to
abut
€25,000
per
tonne
for
carbon
fibre
reinforced
PEEK.
Table
1.5
compares
the
costs
of
a
range
of
plastics.
However,
it
should
always
be
remembered
that
it
is
bad
design
practice
to
select
materials
on
the
basis
of
cost
per
unit
weight.
In
the
mass
production
industries,
in
particular,
the
raw
material
cost
is
of
relatively
little
importance.
It
is
the
in-position
cost
which
is
all
important.
The
in-position
cost
of
a
component
is
the
sum
of
several
independent
factors
i.c
raw
material
costs,
fabrication
costs
and
performance
costs.
It
is
in
the
second
two
of
these
cost
components
that,
in
relation
to
other
mate-
rials,
plastics
can
offer
particular
advantages.
Fabrication
costs
include
power,
labour,
consumables,
etc
and
Table
1.10
shows
that,
in
terms
of
the
oveniH
energy
consumption,
plastics
come
out
much
better
than
metals.
Performance
costs
relate
to
servicing,
warranty
claims,
etc.
On
this
basis
plastics
can
be
very
attractive
to
industries
manufacturing
consumer
products
because
they
can
offer
advantages
such
as
colour
fastness,
resilience,
toughness,
corrosion
resistance
and
uniform
quality
-
all
features
which
help
to
ensure
a
reliable
product.
However,
in
general
these
fabrication
and
performance
advantages
are
common
to
all
plastics
and
so
a
decision
has
to
be
made
in
regard
to
which
plastic
would
be
best
for
a
particular
application.
Rather
than
compare
the
basic
raw
material
costs
it
is
better
to
use
a
cost
index
on
the
basis
of
the
cost
to
achieve
a
certain
perforname.
Consider
again
the
material
selection
procedures
illustrated
in
Section
1.4.1
in
relation
to
strength
and
stiffness.
Selection
for
Strength
at
Minimum
Cost
If
the
cost
of
a
material
is
C
per
unit
weight
then
from
equation
(1.3)
the
cost
of
the
beam
considered
in
the
analysis
would
be
(1.12)
Substituting
for
d
from
(1.2)
then
the
cost
of
the
beam
on
a
strength
basis
would
be
Cb
83
PC
(1.13)
38
General Roperties of Plastics
Table
1.10
The energy required
to
manufacture
and process a range
of
materials at
typical
design
thickness
1.9
1.3
1.3
1.3
0.8
2.0
2.0
3.3
5.3
2.0
2.0
1.8
1.8
2.7
2.4
2.0
3.2
2.5
1.9
2.0
Design Energy
Jlm2
x
lo6
-mm
Material thickness
0
Magnesium
Aluminium sheet
Zinc
die casting
Aluminium casting
Steel
Acetal
Modified
PPO
S
MC
Rgid polyurethane foam
Wycurbmate
Acrylic
Nylon
6
Nylon
66
LOPE
HDPE
Polystyrene
RRlM polyurethane
Polypropylene
ABS
PVC
Feedstodc
Fuel
0
Process
where
83
is a constant, which will
be
the same for all materials. Therefore we
can define a cost factor,
Cf,
where
Cf
=
(5)
(1.14)
which should
be
minimised in order to achieve the best combination of price
and performance. Alternatively we may take the reciprocal of
Cf
to
get
a
desirability factor,
Df
,
Df
=
(g)
(1.15)
and this may be compared to
Df
given by equation (1.5).
Selection
for
Stiffness
at
Minimum
Cost
Using equation
(1.7)
and an analysis similar to above it may be shown that on
the basis of stiffness and cost, the desirability factor,
Df,
is given by
Df
=
(s)
(1.16)
General Properties of Plastics
39
Table 1.1 1
Desirability factors for some common loading configurations
Component
Desirability factor,
Df
Strength basis Stiffness basis
Rectangular
beam
with
fixed
width
a;/=/pc
E113/pC
EIPC
Struts
or
ties
UYIPC
Thin
wall cylinders under pressure
aYlPC
Thin
wall
shafts in tension
rmlPC
GIPC
-
Long rods in compression (buckling)
-
E112/pC
Table 1.12
Desirability factors for a range
of
materials
Proof
or
fracture
Density,
p
stress
n
Modulus
E112
~113
E
P P P P
-
*Y
-
Material
kg/m3 (MN/m
2'
)
E
(GN/m2)
(x10-3)
(x10-3)
(xIo-~)
Aluminium (pure)
Aluminium alloy
Stainless steel
Titanium
alloy
Spruce
GRP
(80%
unidirectional
glass
in
polyester)
CFRP
(60%
unidirectional
fibres
in
epoxy)
Nylon
66
ABS
Polycarbonate
PEEK
(+
30%
C)
2700
2810
7855
4420
450
2000
1500
1140
Io40
1
I50
1450
90
500
980
900
35
1240
1050
70
35
60
215
70
71
I85
107
9
48
189
0.78*
1.2*
2.0*
15.5
0.033
0.178
0.125
0.204
0.078
0.62
0.7
0.061
0.034
0.052
0.19
0.026
0.025
0.024
0.024
0.020
0.024
0.126
6.8
x
17.4
x
1
I
.5
0.01
1
3.51
7.95
4.0
6.78
13.15
17.6
21.6
8.34
5.68
6.73
10.1
3.12 1.53
3.0
I
.47
1.73 0.73
2.34 1.07
6.67 4.62
3.46 1.82
9.16 3.82
0.77 0.81
1.05 1.02
1.23
1.09
2.7
I
.72
*
1500
h
creep modules
Tables
1.11
and
1.12
give desirability factors for configurations other than
the
beam
analysed above and typical numerical values
of
these factors for a
range
of
materials.
Bibliography
Waterman,
N.A.
The Selection and Use
of
Engineering Materials,
Design Council, London
(1979)
Crane, F.A.C.
and
Charles,
J.A.
Selection and Use
of
Engineering Materials
Buttenvorths,
London
(
1984)
40
General
Properties
of
Plastics
Crawford,
R.J.
Plastics and Rubber-Engineering Design
and
Application,
MEP,
London (1985)
Powell,
P.C.
Engineering with Polymers,
Chapman and Hall, London (1984)
Hall, C.
Polymer Materials,
Macmillan, London (1981)
Birley, A.W. and Scott, M.J.
Plustic Materials: ProDem'es and ADdications.
Leonard Hall.
Gkgow (1982)
mans (1996)
Jenkins (vol2), North-Holland Publ. Co., London (192)
Amsterdam (1981)
New York (1982)
Benham, P.P. Crawford, R.J. and Armstrong, C.G
Mechanics
of
Engineering Materials,
Long-
Lancaster,
J.K.
Friction and Wear
of
Plastics,
Chapter 14 in Polymer Science
edited
by A.D.
Bartenev,
G.M.
and Lavrentev,
V.V.
Friction and Wear in Polymers,
Elsevier Science hbl. Co.,
Schwartz,
S.S.
and
Goodman,
S.H.
Plastics Materials and Processes,
Van Nostrand Reinhold,
Blythe, A.R.
Electrical Properties
of
Polymers,
Cambridge Univ. Press (1980)
Van Krevelen,
D.W.
Properties
of
Polymers
2nd Edition, Elsevier, Amsterdam (1976)
Mills, N.
Plastics,
Edward Arnold, London (1986)
Kemmish, D.J.
High
performance engineering plastics,
RAPRA Review Reports,
8,
2 (1995)
Oswald, T.A. and Menges,
G.
Materials Science
of
Polymers for Engineers,
Hanser, Munich
Birley, A.W. Haworth B. and Batchelor,
J.
Physics
of
Plastics,
Hanser, Munich (1992)
Belofsky, H.
Plastics: Product Design
und
Process Engineering,
Hanser, Munich (1995)
Gruenwald,
G.
Plastics: How Structure Determines Properties,
Hanser, Munich (1992)
Dominghaus, H.
Plastics for Engineers,
Hanser, New York (1993)
Chanier, J.M.
Polymeric Materials and Processing,
Hanser, New York
(1990)
Progelhof, R.C. and Throne,
J.L.
Polymer Engineering Principles,
Hanser, New York (1993)
(1995)
CHAPTER
2
-
Mechanical
Behaviour
of
Plastics
2J
Introduction
In
Chapter
1
the
general
mechanical
properties
of
plastics
were
introduced.
In
order
to
facilitate
comparisons
with
the
behaviour
of
other
classes
of
materi-
als
the
approach
taken
was
tu
refer
to
standard
methods
of
data
presentation,
such
as
stress-strain
graphs,
etc.
However,
it
is
important
to
note
that
when
one
becomes
involved
in
engineering
design
with
plastics,
such
graphs
are
of
limited
value.
The
reason
is
that
they
are
the
results
of
relatively
short-
terrn
tests
and
so
heir
use
is
restricted
to
quality
control
and,
perhaps,
the
initial
sorting
of
materials
in
terms
of
stiffness,
strength
etc.
Designs
based
on,
say,
the
modulus
obtained
from
a
short-term
test
would
not
predict
accurately
the
long-term
behaviour
of
plastics
because
they
are
viscoelastic
materials.
This
viscoelasticity
means
that
quantities
such
as
modulus,
strength,
ductility
and
coefficient
of
fiction
are
sensitive
to
straining
rate,
elapsed
time,
loading
history,
temperature,
etc.
It
will
also
be
shown
later
that
the
manufacturing
method
used
for
the
plastic
product
can
create
changes
in
the
structure
of
the
material
which
have
a
pronounced
effect
on
properties.
The
behaviour
of
the
moulded
product
may
therefore
be
different
from
the
behaviour
of
a
moulded
test-piece
of
the
same
material.
The
time-dependent
change
in
the
dimensions
of
a
plastic
article
when
subjected
to
a
constant
stress
is
called
creep.
As
a
result
of
this
phenomenon
the
modulus
of
a
plastic
is
not
a
constant,
but
provided
its
variation
is
known
then
the
creep
behaviour
of
plastics
can
be
allowed
for
using
accurate
and
well
established
design
procedures
Metals
also
display
time
dependent
properties
at
high
temperatures
so
that
designers
of
turbine
blades,
for
example,
have
to
allow
for
creep
and
guard
against
creep
rupture.
At
room
temperature
the
creep
behaviour
of
metals
is
negligible
and
so
design
procedures
are
simpler
in
that
41
42 Mechanical Behaviour of Plastics
the modulus may be regarded as a constant. In contrast, thermoplastics at room
temperature behave in a similar fashion to metals at high temperatures
so
that
design procedures for relatively ordinary load-bearing applications must always
take into account the viscoelastic behaviour of plastics.
For most traditional materials, the objective of the design method is to deter-
mine stress values which will not cause fracture. However, for plastics it is more
likely that excessive deformation will be the limiting factor in the selection of
working stresses. Therefore this chapter looks specifically at the deformation
behaviour of plastics and fracture will be treated separately in the next chapter.
2.2
Viscoelastic Behaviour
of
Plastics
For a component subjected to a uniaxial force, the engineering stress,
(T,
in the
material is the applied force (tensile or compressive) divided by the original
cross-sectional area. The engineering strain,
E,
in the material is the extension
(or reduction in length) divided by the original length. In a perfectly elastic
(Hookean) material the stress,
(T,
is directly proportional to be strain,
E,
and
the relationship may be written, for uniaxial stress and strain, as
(2.1)
where the constant is referred to as the modulus of the material.
In a perfectly viscous (Newtonian) fluid the shear stress,
t
is directly propor-
tional to the rate of strain
(dy/dt
or
p)
and the relationship may be written
as
(2.2)
where the constant in this case is referred to
as
the
viscosity
of the fluid.
Polymeric materials exhibit mechanical properties which come somewhere
between these
two
ideal cases and hence they are termed
viscoelastic.
In a
viscoelastic material the stress is a function of strain and time and
so
may be
described by an equation of the form
(T
=
constant
x
E
t
=
constant
x
i.
(J
=
f(E,
t)
(2.3)
This type of response is referred to
as
non-linear viscoelastic but as it is not
amenable to simple analysis it is often reduced to the form
0
=
E.
f(t)
(2.4)
This equation is
the
basis of linear viscoelasticity and simply indicates that,
in a tensile test for example, for a fixed value of elapsed time, the stress will
be directly proportional to the strain. The different types of response described
are shown schematically in Fig. 2.1.
The most characteristic features of viscoelastic materials are that they exhibit
a time dependent strain response to a constant stress
(creep)
and a time depen-
dent stress response to a constant strain
(relaxation).
In addition when
the
Mechanical Behaviour of Plastics
43
Strain
0
Fig.
2.1
Stress-strain behaviour
of
elastic
and
viscoelastic materials at
two
values
of
elapsed
time,
t
applied stress is removed the materials have the ability to
recover
slowly over
a period of time. These effects can also
be
observed in metals but the difference
is that in plastics they occur at room temperature whereas in metals they only
occur at very high temperatures.
2.3
Short-Term Testing
of
Plastics
The simple tensile test is probably the most popular method for character-
ising metals and
so
it is not surprising that it is also widely used for plastics.
However, for plastics the tensile test needs to
be
performed very carefully
and the results
of
the single test should only
be
used
as
a means of quality
control
-
not as design data. This is because, with plastics it is possible to
obtain quite different results from the same material simply by changing the
test conditions. Fig.
2.2
shows that at high extension rates
(>1
ds)
unplas-
ticised
PVC
is almost brittle with
a
relatively high modulus and strength. At
low extension rates
(<0.05
mm/s)
the same material exhibits a lower modulus
and strength but its ductility
is
now very high. Therefore a single tensile test
could
be
quite misleading if the results were used in design formulae but the
test conditions were not similar to the service conditions.