Báo cáo y học: " Therapeutic targets for HIV-1 infection in the host proteome" pot
Bạn đang xem bản rút gọn của tài liệu. Xem và tải ngay bản đầy đủ của tài liệu tại đây (1.32 MB, 23 trang )
BioMed Central
Page 1 of 23
(page number not for citation purposes)
Retrovirology
Open Access
Research
Therapeutic targets for HIV-1 infection in the host proteome
Winnie S Liang
†2
, Anil Maddukuri
†1
, Tanya M Teslovich
3
, Cynthia de la
Fuente
1
, Emmanuel Agbottah
1
, Shabnam Dadgar
1
, Kylene Kehn
1
,
Sampsa Hautaniemi
4
, Anne Pumfery
1
, Dietrich A Stephan*
2
and
Fatah Kashanchi*
1,5
Address:
1
Department of Biochemistry and Molecular Biology, George Washington University School of Medicine, Washington, DC 20037, USA,
2
Neurogenomics Division, Translational Genomics Research Institute, Phoenix, AZ 85004, USA,
3
Institute for Genetic Medicine, Johns Hopkins
Medical School, Baltimore, MD 21205, USA,
4
Institute of Signal Processing, Tampere University of Technology, PO Box 553, 33101, Tampere,
Finland and
5
The Institute for Genomic Research, TIGR, Rockville, MD 20850, USA
Email: Winnie S Liang - ; Anil Maddukuri - ; Tanya M Teslovich - ; Cynthia de la
Fuente - ; Emmanuel Agbottah - ; Shabnam Dadgar - ;
Kylene Kehn - ; Sampsa Hautaniemi - ; Anne Pumfery - ;
Dietrich A Stephan* - ; Fatah Kashanchi* -
* Corresponding authors †Equal contributors
Abstract
Background: Despite the success of HAART, patients often stop treatment due to the inception
of side effects. Furthermore, viral resistance often develops, making one or more of the drugs
ineffective. Identification of novel targets for therapy that may not develop resistance is sorely
needed. Therefore, to identify cellular proteins that may be up-regulated in HIV infection and play
a role in infection, we analyzed the effects of Tat on cellular gene expression during various phases
of the cell cycle.
Results: SOM and k-means clustering analyses revealed a dramatic alteration in transcriptional
activity at the G1/S checkpoint. Tat regulates the expression of a variety of gene ontologies,
including DNA-binding proteins, receptors, and membrane proteins. Using siRNA to knock down
expression of several gene targets, we show that an Oct1/2 binding protein, an HIV Rev binding
protein, cyclin A, and PPGB, a cathepsin that binds NA, are important for viral replication following
induction from latency and de novo infection of PBMCs.
Conclusion: Based on exhaustive and stringent data analysis, we have compiled a list of gene
products that may serve as potential therapeutic targets for the inhibition of HIV-1 replication.
Several genes have been established as important for HIV-1 infection and replication, including
Pou2AF1 (OBF-1), complement factor H related 3, CD4 receptor, ICAM-1, NA, and cyclin A1.
There were also several genes whose role in relation to HIV-1 infection have not been established
and may also be novel and efficacious therapeutic targets and thus necessitate further study.
Importantly, targeting certain cellular protein kinases, receptors, membrane proteins, and/or
cytokines/chemokines may result in adverse effects. If there is the presence of two or more
proteins with similar functions, where only one protein is critical for HIV-1 transcription, and thus,
targeted, we may decrease the chance of developing treatments with negative side effects.
Published: 21 March 2005
Retrovirology 2005, 2:20 doi:10.1186/1742-4690-2-20
Received: 10 February 2005
Accepted: 21 March 2005
This article is available from: />© 2005 Liang et al; licensee BioMed Central Ltd.
This is an Open Access article distributed under the terms of the Creative Commons Attribution License ( />),
which permits unrestricted use, distribution, and reproduction in any medium, provided the original work is properly cited.
Retrovirology 2005, 2:20 />Page 2 of 23
(page number not for citation purposes)
Background
With the rapid emergence of the HIV-1 and AIDS pan-
demic, tremendous effort has been directed towards
development of effective treatments and vaccines. Cur-
rently, HAART is the only therapeutic option available for
seropositive and symptomatic individuals, and is com-
prised of targeted inhibitors of HIV-1 reverse transcriptase
(NNRTIs and NRTIs) and/or protease (PI) and the newly
FDA approved gp41-inhibitor Fuzeon/T20 [1]. Though
HAART is effective in prolonging life, its use, coupled with
other factors, engenders rapid development of multiple
drug-resistant strains. Therefore, the comprehensive eluci-
dation of HIV-1-mediated effects on host cellular net-
works is urgently needed for rational therapeutic targets.
HIV-1 infection, pathogenesis, and AIDS development are
largely due to the various retroviral structural, regulatory,
and accessory proteins, but more importantly due to effi-
cient 'hijacking' of cell regulatory machineries, including
the differential expression of receptors, transcription,
mRNA processing, and translation factors. While there has
been much research on the effects of viral proteins on host
cellular pathways, HIV-1 Tat appears to be the most criti-
cal for viral transcription and replication.
HIV-1 Tat is absolutely required for productive, high titer
viral replication. Though its sequence and a number of its
functions have been uncovered, there is still much to learn
about its replication-driven and pathogenic mechanisms,
including the identification and characterization of Tat-
regulated cellular genes. With the advent of microarray
technologies, it is now possible to assay the entire human
genome for the effects of a single gene product, viral infec-
tion, or drug treatment. Many laboratories have previ-
ously demonstrated the effects of Tat on cell cycle-
regulated transcription [2-4]. The finding that Tat activates
gene expression at both the G
1
(TAR-dependent) and G
2
(TAR-independent) phases of the cell cycle demonstrates
a concerted effort by Tat to take full advantage of cell cycle
regulatory checkpoints. These findings prompted us to
explore the effects of constitutive Tat expression on the
expression profile of 1,200 host cellular genes in HIV-1
infected unsynchronized cells [5]. We observed that while
the majority of cellular genes were down-regulated, espe-
cially those with intrinsic receptor tyrosine kinase activity,
numerous S phase and translation-associated genes were
up-regulated. These findings and the fact that inducing a
G
1
/S block on infected cells dramatically reduces viral
transcription and progeny formation [6-8], prompted us
to follow and elucidate the effects of Tat on the host tran-
scriptional profile throughout the entire cell cycle.
Here, we report the HIV-1 Tat-mediated effects on the host
expression profile relative to the cell cycle. We first per-
formed microarray experiments in unsynchronized Tat-
expressing cells compared to empty vector-transfected
cells. We subsequently performed similar experiments in
synchronized cells at the G
1
/S and G
2
/M phase bounda-
ries. Cells were then collected at 0 h, 3 h, 6 h, and 9 h post-
release per treatment corresponding to a specific cell cycle
stage, and cytoplasmic RNA was isolated for microarray
analysis. After microarray analysis using the Affymetrix
U95Av2 gene chip, we found a wide variety of gene ontol-
ogies that were affected by Tat through cell cycle progres-
sion. We confirmed that Tat differentially regulates the
expression of a variety of genes at different phases of the
cell cycle, with an overall inhibition of the cellular tran-
scription profile. Using siRNA technology to 'knock-
down' protein expression, we screened several of these
genes as possible therapeutic targets for inhibition of HIV-
1 replication. We generated a comprehensive list of Tat-
induced genes at each cell cycle phase, particularly the G
1
/
S phase transition, and expanded the list of Tat-regulated
cellular proteins and potential therapeutic targets.
Results and Discussion
Microarray design and analysis
To understand which cellular genes were affected by Tat,
we analyzed the transcription profile of ~12,000 gene
transcripts using the Affymetrix U95Av2 gene chip. Cells
were either transfected with the eTat plasmid or a pCep4
control vector. We chose to perform experimental and
control conditions in duplicate to account for inter-chip
variability. Figure 1A illustrates the cross-validity of the
duplicate synchronized cell cycle experiments run for the
eTat samples. The scatter plot graph logarithmically plots
the probe set signal intensity values from the first experi-
ment against those from the second experiment (average
R
2
value = 0.912). Yellow spots represent gene probes with
absent or marginal calls and the blue spots correspond to
probes with present and marginal calls. Blue spots show
less correlation and the yellow spots indicate the lowest
level of correlation. Red spots represent those probes that
displayed present calls in both experiments and thus dem-
onstrate the highest level of correlation. The fold change
lines indicate two-fold, three-fold, and ten-fold changes.
Figure 1A shows the correlation of signal and detection
values between the two experiments for each probe set, as
well as the reliability of one dataset compared to its repli-
cate. Similar results were observed for this analysis
between the duplicate control pCep4 samples (data not
shown). Though previous microarray experiments per-
formed by us and others have used total nuclear and cyto-
plasmic RNA, we chose to isolate only cytoplasmic RNA
because nuclear RNA would include RNAs that have been
improperly spliced, or uncapped, and may have contain
inappropriate poly-A tails, while cytoplasmic RNAs would
yield almost a complete RNA population that has been
properly processed prior to nuclear export and transla-
tion. As seen in Figure 1B, the RNA samples for both
Retrovirology 2005, 2:20 />Page 3 of 23
(page number not for citation purposes)
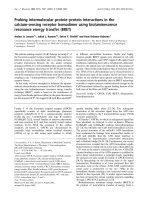
Cross-validity of Tat samples and RNA isolationFigure 1
Cross-validity of Tat samples and RNA isolation. (A) Cross-validity of the duplicate Tat samples analyzed. With a total
of 32 gene chips, we analyzed the reliability of the gene chip samples relative to their respective replicate. The scatter graph
logarithmically plots the signal intensity values of probe sets for one sample against those for a sample replicate. Each graph
point indicates a common probe set between the two data sets and the value is determined by the intersection of the x and y
values for that probe set. 2-fold, 3-fold, and 10-fold change lines are defined by the following equations: y = 2x and y = 1/2x, y
= 3x and y = 1/3x, y = 10x and y = 1/10x, y = 30x and y = 1/30x. Yellow spots represent probes with absent-absent, absent-
marginal, marginal-absent, and marginal-marginal detection calls on sample replicates. Blue spots represent those with absent-
present, present-absent, marginal-present, and present-marginal calls, while red spots represent probe sets with present-
present detection calls. (B) Cytoplasmic RNA was isolated from all experimental and corresponding control samples, and quan-
titated by UV spectrophotometric analysis; 3 µg was run on a 1% agarose gel for visual inspection. (C) IP/Westerns for Tat
protein. Lanes 1–3 are from eTat extracts and Lanes 4–6 are from control pCep4 cells; unsynchronized cells are shown in
Lanes 1 and 4.
A)
B)
C)
Tat
123456
IP/WB
Unsyn.
HU
NOCO
Unsyn.
HU
NOCO
eTat pCEp4
Retrovirology 2005, 2:20 />Page 4 of 23
(page number not for citation purposes)
experiments show good RNA integrity with defined 18S
and 28S bands.
We first studied the effects of constitutive Tat expression
on the host cell transcription profile in unsynchronized
cells and then relative to the cell cycle phases. Initially, a
heterogenous cell population of Tat-expressing cells was
compared to one expressing the pCep4 vector to create a
global Tat-induced transcription profile. In the latter
experiment, samples were treated with either hydroxyurea
(Hu) or nocodazole (Noco) for 18 h to obtain either a G
1
/
S or G
2
/M block, respectively. Cells blocked with Hu were
60% at G
1
, 35% at S, and 5% at the G
2
/M phase, while
cells blocked with Noco were 6% at G
1
, 24% at S, and
70% at the G
2
/M phase (data not shown). Following cell
cycle arrest, cells were washed and released in complete
media. The 0 h time point following Hu treatment is rep-
resentative of the G
1
/S phase of the cell cycle, while the 3
h, 6 h, and 9 h time points correspond to the early S, late
S, and G
2
phases, respectively. Noco, a G
2
/M phase
blocker, was added to the cell populations and the cells
were likewise released. Samples were taken at the 0 h, 3 h,
6 h, and 9 h time points to obtain cells in the M and early,
middle, and late G
1
phases, respectively. Immunoprecipi-
tation and western blot analysis of tat protein were also
carried out to verify the presence of tat in the unsynchro-
nized and synchronized Tat-expressing cells and those
expressing the pCep4 vector (Figure 1C). Thus, we
obtained and analyzed the HIV-1 Tat-induced transcrip-
tion profile at every cell cycle stage. All cell cycle phase
populations were confirmed using FACS analysis as previ-
ously shown [2].
Gene expression analysis in unsynchronized Tat-
expressing cells
We analyzed the differential gene expression of a Tat-
expressing cell population relative to that of a control
population. This microarray analysis consisted of looking
at ~12,000 genes in unsynchronized cells to ascertain the
global effect of HIV-1 Tat-mediated transcriptional regula-
tion on the host cell genome. Overall, we observed Tat-
induced/-repressed differential expression of 649 genes
(~5% of genes screened) belonging to a wide variety of
gene ontologies (Figure 2A). Figure 2B depicts gene ontol-
ogies for genes showing increased/decreased expression
between the eTat and pCep4 samples. A few genes were
represented as belonging to a variety of classifications and
were placed into multiple categories. We observed the
greatest effect (~3%) of Tat on genes encoding for cellular
enzymes; secretory, metabolic, and apoptotic pathways;
and RNA binding, DNA binding, cytoskeletal, protein
synthesis, and receptor proteins, while the other gene
ontologies were less affected by Tat expression. We also
observed that ~60% of the Tat affected genes were down-
regulated. These findings are consistent with the previ-
ously published results by us and other laboratories
[5,9,10].
HIV-1 Tat-induced transcription profile
Using a two-fold threshold to constrain our gene lists to
those genes only significantly induced by Tat, we observed
many genes that were expressed during all cell cycle
phases, with fewer genes that were exclusive to only one
cell cycle phase. This can be seen in both the self-organiz-
ing maps (SOMs) and k-means analysis graphs [Figures 4
and 3, respectively & Additional Files 5, 6, and 7]. In the 3
sets of SOMs generated using three separate filtering rules,
we observed many genes that were relatively consistent in
their expression patterns through most cell cycle phases.
This was also evident in the k-means graphs that contain
gene clusters whose expression was relatively linear [see
Additional File 7: sets 1, 10, 11, and 14]. In the k-means
analysis, the y-axis represents the normalized intensity
values for the genes analyzed and the x-axis contains two
sets of eight time points for each condition. K-means clus-
tering allows for the elucidation of those genes with simi-
lar temporal expression profiles. As shown in [Additional
File 7], the various graphs correspond to separate clusters
of genes whose expression is similar in Tat-expressing cells
relative to cell cycle progression.
Based on the k-means clustering methods, we observed a
coordinated up-regulation of 228 genes during the G
1
/S
phase transition in set 14 (Figure 3B) and 54 genes in set
12 (Figure 3A). On the other hand, set 5 (Figure 3C) dis-
plays genes whose expression peaks at different time
points in the cell cycle, but are specifically down-regulated
at the G
1
/S boundary. Set 12 (Figure 3A) was very similar
to the results seen with the G
1
/S SOM (Figure 4), in which
genes were up-regulated at the G
1
/S phase and continued
to be highly expressed until the G
2
phase. Set 12 illustrates
the increased expression of various cathepsins (L, L2, Z,
PPGB), receptors (EGFR, lamin B, poliovirus), solute/ion
carrier transporters, and MHC molecules (HLA-C, HLA-A,
GRP58).
In set 14 (Figure 3B), genes whose expression peaked at
the G
1
/S phase transition were observed, though a greater
number of genes relative to set 12 with similar expression
patterns and functions were found. For example, we
observed up-regulation of apoptosis regulators (UDP-
galactose ceramide glucosyltransferase, BAX, BAX inhibi-
tor 1, TRAIL receptor 2, thioredoxin peroxidase, CD47,
API5-like 1), receptors/adhesion proteins (CCRL2, LIFR,
EGFR, FGFR1, syndecan 4, syndecan 1, IL-4R, IL-13R, lym-
photoxin B receptor), signaling mediators (Grb2, AKAP1,
IRAK1, CaM-kinase II, calcineurin), and proteins involved
in transcriptional regulation (BAF60C, NFI/C, ATF6).
Interestingly, 26 genes in this cluster were related to the
ER-Golgi protein transport pathway, suggesting a
Retrovirology 2005, 2:20 />Page 5 of 23
(page number not for citation purposes)
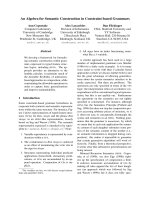
Gene ontologies present on the human U95Av2 chip and those specifically induced by TatFigure 2
Gene ontologies present on the human U95Av2 chip and those specifically induced by Tat. (A) The U95Av2 gene
chip was surveyed to determine the ontology of genes represented on the chip, as well as the corresponding number of genes
belonging to each category. The percentages next to each classification correspond to the percentage of genes affected by Tat.
(B) HIV-1 Tat-induced/repressed genes in an unsynchronized HeLa-eTat cell population. The number of genes induced/
repressed by Tat, as well as the various classifications, is shown.
A)
B)
Retrovirology 2005, 2:20 />Page 6 of 23
(page number not for citation purposes)
dependence on efficient protein processing and intracel-
lular transport. These findings suggest an increase in Tat-
induced receptor-mediated signaling and transcription,
and most importantly, the increased expression of mem-
brane proteins and antigens involved in promoting HIV-1
replication and immune evasion.
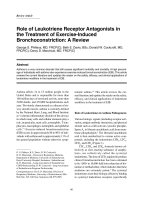
K-Means clustering analysis of Tat-induced genesFigure 3
K-Means clustering analysis of Tat-induced genes. The temporal differential gene expression in Tat cells was compared
to respective control samples and analyzed using the k-means clustering algorithm. The coordinated expression profiles are
representative of the 32 chips analyzed (16 eTat and 16 pCep4). The y-axis represents the log scale of the normalized intensity
of the genes shown (data was normalized against the corresponding control samples). The x-axis corresponds to the various
cell cycle phases: 1) M phase, 2) early G
1
, 3) middle G
1
, 4) late G
1
, 5) G
1
/S, 6) early S, 7) late S, and 8) G
2
. Fifteen clusters were
found based on the parameters used [see Additional File 7] and three are shown in 3A-C. Figure 3A shows altered genes at the
G1/S for cathepsins, and various cellular receptors, while Figure 3B shows a close-up of apoptotic regulated genes, signal trans-
duction and transcription factors. Figure 3C shows genes that dramatically oscillate at every stages of cell cycle in Tat express-
ing cells, including ribosome and actin/cytoskeleton genes.
This set mostly includes
ribosomal subunit genes as
well as genes encoding beta-
actin, beta-5-tubulin, &
myosin light polypeptide
Increased expression of genes
including those encoding cathepsins
L, L2, & Z, PPGB, EFGR, lamin B,
poliovirus, leptin, MHC molecules,
& solute/ion carrier transporters
Increased expression of genes
including BAX, BAX inhibitor 1,
TRAIL receptor 2, CD9, EGFR,
syndecan 4, signaling mediators
,
& genes involved in trans-
criptional regulation
(A) (B)
(C)
Retrovirology 2005, 2:20 />Page 7 of 23
(page number not for citation purposes)
On the other hand, set 5 (Figure 3C) shows 20 genes
whose expressions peaked at late G
1
, early S, and then
again at G
2
, while their expressions were lowest at early
G
1
. This set contains primarily ribosomal subunit genes.
We previously observed very similar results in our micro-
array experiment using Tat-expressing H9 cells [5], where
we saw a significant up-regulation of numerous ribosomal
subunit genes and translation initiation factors. The dra-
matic temporal expression of the ribosomal subunits for
the 40S and 60S components in early S, as seen in set 5,
may be indicative of a critical coupling of transcription
and translation for efficient viral RNA production.
Tat-mediated gene expression during G
1
/S phase
Using a complementary technique for unsupervised clus-
tering, we looked at those genes that were induced by
HIV-1 Tat during the late G
1
phase and the G
1
/S phase
transition since our previous findings indicated that these
cell cycle phases were starting points for transcription of
the HIV-1 long terminal repeat (LTR) and activated viral
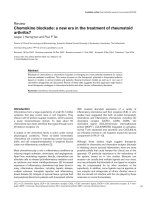
Temporal SOM analysis of HIV-1 Tat-induced cellular genes in synchronized Tat cellsFigure 4
Temporal SOM analysis of HIV-1 Tat-induced cellular genes in synchronized Tat cells. 3 separate filters were
applied to remove genes that did not display at least a 1.5, 2, or 3-fold change at each time point analyzed in the 16 eTat chips
(see Methods); each filter produced a discrete dataset that was applied to SOM analysis. The third and most restrictive dataset
is shown here. Genes that were significantly up (red) and down-regulated (blue) are shown. The U-matrix identifies which
genes are similar to each other in terms of expression profile (blue) separated by a "boundary" (red). This SOM graph contains
17 rows and 6 columns of neurons, represented as coordinates. The arrows adjacent to the G
1
/S SOM indicate those genes
significantly up-regulated during this transition and S phase, and those that show decreased expression in the G
1
phase.
Retrovirology 2005, 2:20 />Page 8 of 23
(page number not for citation purposes)
Table 1: SOM and K-means Analysis of Tat-upregulated genes at the G
1
/S phase.
a
Gene Ontology Accession # Gene Title Gene Symbol Unigene ID
Transcription/ D83782 SREBP cleavage-activating protein SCAP Hs.437096
DNA binding AC004770 fatty acid desaturase 3 FADS3 Hs.21765
Enzymes Y08685 serine palmitoyltransferase, long chain base subunit 1 SPTLC1 Hs.90458
D50840 UDP-glucose ceramide glucosyltransferase UGCG Hs.432605
AF038961 mannose-P-dolichol utilization defect 1 MPDU1 Hs.95582
U67368 exostoses (multiple) 2 EXT2 Hs.75334
M22488 bone morphogenetic protein 1 BMP1 Hs.1274
AF002668 degenerative spermatocyte homolog, lipid desaturase (Drosophila) DEGS Hs.299878
AB016247 sterol-C5-desaturase-like SC5DL Hs.287749
X15525 acid phosphatase 2, lysosomal ACP2 Hs.75589
D13643 24-dehydrocholesterol reductase DHCR24 Hs.75616
AF020543 palmitoyl-protein thioesterase 2 PPT2 Hs.332138
AL050118 fatty acid desaturase 2 FADS2 Hs.388164
M16424 beta-hexosaminidase A (alpha polypeptide) HEXA Hs.411157
L13972 sialyltransferase 4A (beta-galactoside alpha-2,3-sialyltransferase) SIAT4A Hs.356036
Membrane/ D79206 syndecan 4 (amphiglycan, ryudocan) SDC4 Hs.252189
Antigens M90683 HLA-G histocompatibility antigen, class I, G HLA-G Hs.512152
X58536 major histocompatibility complex, class I, C & B HLA-C, B Hs.77961
AF068227 ceroid-lipofuscinosis, neuronal 5 CLN5 Hs.30213
U72515 putative protein similar to nessy (Drosophila) C3F Hs.530552
X85116 stomatin STOM Hs.439776
Z26317 desmoglein 2 DSG2 Hs.412597
S90469 P450 (cytochrome) oxidoreductase POR Hs.354056
Receptors/
Ligands
U97519 podocalyxin-like PODXL Hs.16426
AI263885 interleukin 27 receptor, alpha IL27RA Hs.132781
U60805 oncostatin M receptor OSMR Hs.238648
M63959 low density lipoprotein receptor-related protein associated protein 1 LRPAP1 Hs.75140
L25931 lamin B receptor LBR Hs.435166
X00588 epidermal growth factor receptor EGFR Hs.77432
M25915 clusterin CLU Hs.436657
X87949 heat shock 70 kDa protein 5 (glucose-regulated protein, 78 kDa) HSPA5 Hs.310769
Proteases AF032906 cathepsin Z CTSZ Hs.252549
AB001928 cathepsin L2 CTSL2 Hs.87417
Y00264 Amyloid beta (A4) precursor protein APP Hs.177486
Protein
transport/
Chaperone
D83174 serine (or cysteine) proteinase inhibitor, clade H, member 1 SERPINH1 Hs.241579
Z49835 glucose regulated protein, 58 kDa GRP58 Hs.110029
X97335 A kinase (PRKA) anchor protein 1 AKAP1 Hs.78921
X90872 gp25L2 protein HSGP25L2G Hs.279929
D49489 thioredoxin domain containing 7 (protein disulfide isomerase) TXNDC7 Hs.212102
AF013759 calumenin CALU Hs.7753
AL008726 protective protein for beta-galactosidase (galactosialidosis) PPGB Hs.118126
Z50022 pituitary tumor-transforming 1 interacting protein PTTG1IP Hs.369026
AA487755 FK506 binding protein 9, 63 kDa FKBP9 Hs.497972
Ion channel/
transporter
U81800 solute carrier family 16, member 3 SLC16A3 Hs.386678
M23114 ATPase, Ca++ transporting, cardiac muscle, slow twitch 2 ATP2A2 Hs.374535
J04027 ATPase, Ca++ transporting, plasma membrane 1 ATP2B1 Hs.20952
Retrovirology 2005, 2:20 />Page 9 of 23
(page number not for citation purposes)
transcription [2]. The SOM analysis makes it easier to vis-
ualize the dramatic cell cycle effects of Tat on the total
gene dataset. In this analysis, red areas indicate up-regu-
lated genes, while blue indicates down-regulated genes,
and yellow represents minor effects on gene expression.
The U-matrix allows visualization of those clusters in the
SOM that show significant expression changes. Each hex-
agon or neuron corresponds to a group of genes with sim-
ilar expression patterns. We performed 3 filters to generate
SOMs, with the last filter being the most restrictive (Figure
4). The most restrictive list includes genes that show a 3-
fold increase or decrease in expression between the exper-
imental and control samples at each time point. For this
particular SOM, genes were removed if their average signal
ratio fell between 0.333 and 3.0 across all time points
tested and displayed absent calls at any time point.
Using the SOM analysis from the third filter (Figure 4), we
observed a similar transcription profile throughout the G
1
phase, with a marked difference at the G
1
/S transition.
This is seen with the dramatic induction of those genes
represented in the red and dark red neurons at the bottom
right portion of the G
1
/S SOM. Repression of genes on the
left side of the G
1
component plane, when cells enter the
G
1
/S transition, was also observed. Interestingly, the G
1
/S
profile remained relatively constant through the S phase,
while upon entering G
2
, there was an overall reduction in
Tat-mediated gene activation. This can be seen with the
greater percentage of blue neurons at the G
2
phase con-
comitant with a reduction of dark red neurons. We gener-
ated a list of genes up-regulated at the G
1
/S transition that
were seen in both k-means and SOM clustering analyses
(Table 1). Bolded genes are those that have already been
shown to be involved in HIV-1 infection. It is important
to note that there were a significant number of genes that
were identified as similarly dysregulated by using both the
k-means and SOM analyses across all time points.
Numerous signaling receptors were shown to be up-regu-
lated upon Tat expression. The oncostatin M receptor is
normally bound by the IL-6 cytokine family member and
is increased in HIV-1 infection [11]. Interestingly, oncos-
tatin M has been shown to stimulate the production of
immature and mature T cells in the lymph nodes of trans-
genic mice [12]. It has also been shown that cdk9, a com-
ponent of pTEFb, can also bind gp130, which is a
common subunit recognized by the IL-6 cytokine family
[13]. Expression of the 4-1BBL cytokine, a T-cell co-stimu-
latory molecule (i.e. induces IL-2 production and T-cell
proliferation) that is involved in the antigen presentation
process and generation of a CTL response was also
increased [14,15].
Similarly, we observed the up-regulation of LFA-3, ICAM-
1, and other membrane proteins and receptors. These
membrane proteins serve as additional activation signals
and molecules involved in the transmission of free virus
to bystander, uninfected cells [16-18]. Interestingly, a
recent report illustrates the ability of soluble ICAM
(sICAM) to promote infection of resting cells and cell
cycle progression after initiating B and T cell interactions
[19]. Syndecan 4 was also up-regulated by Tat at the G
1
/S
phase. Syndecans are a type of heparan sulfate proteogly-
can (HSPG) that is able to efficiently attach to HIV-1 viri-
ons, protect them from the extracellular environment, and
efficiently transmit the captured virions to permissive cells
[20]. We also observed the up-regulation of the CXCR4
co-receptor that is critical for infection by X4 HIV-1
strains. Likewise, the SDF receptor 1 had increased expres-
sion. SDF-1 is the ligand for the CXCR4 co-receptor and
can block HIV-1 infection via co-receptor binding. There-
fore, the expression of the SDF receptor 1 could serve as an
alternate binding site for SDF-1, allowing CXCR4 to be
available for HIV-1 gp120/gp41-binding. Fractalkine, the
ligand for the CX3CR1 receptor, has been shown to be
important in the adhesion, chemoattraction, and activa-
tion of leukocytes [21], was also up-regulated by Tat
expression. Overall, these proteins serve to increase the
efficiency of HIV-1 infection, transmission to other cells,
activation of T cells, and the recruitment of circulating leu-
kocytes to infection sites.
A critical feature of HIV-1 infection is its ability to evade
host immune responses and subsequently create a state of
AL049929 ATPase, H+ transporting, lysosomal accessory protein 2 ATP6AP2 Hs.183434
AL096737 solute carrier family 5, member 6 SLC5A6 Hs.435735
Unknown/Other AF052159 protein tyrosine phosphatase-like, member b PTPLB Hs.5957
D14658 KIAA0102 gene product KIAA0102 Hs.87095
AI867349 nicastrin-like protein NICALIN Hs.24983
AL031228 solute carrier family 39 (zinc transporter), member 7 SLC39A7 Hs.66776
X57398 nodal modulator 1, 2, 3 NOMO1, 2, 3 Hs.429975
a
Bolded genes indicate those genes upregulated at the G1/S transition (found using both SOM and k-means analyses)
Table 1: SOM and K-means Analysis of Tat-upregulated genes at the G
1
/S phase.
a
(Continued)
Retrovirology 2005, 2:20 />Page 10 of 23
(page number not for citation purposes)
immunodeficiency. Previous studies have shown the abil-
ity of HIV-1 Nef to decrease the expression of CD4, HLA-
A, and HLA-B, while having no effect on HLA-C or HLA-
D, which allows for host cell survival and permits
productive viral progeny formation prior to immune rec-
ognition and eventual apoptosis [22,23]. HLA-A and
HLA-B allow for efficient CD8
+
cytotoxic T lymphocyte
(CTL) detection. Since it has been demonstrated that
HLA-C and HLA-E are needed for protection from natural
killer (NK) cell-mediated death [23], the up-regulation of
HLA-C by Tat suggests similar host cell survival-directed
functions for both Tat and Nef. Interestingly, HLA-G has
been shown to be up-regulated in both monocytes and T
lymphocytes of seropositive individuals, though its rela-
tion to infection and pathogenesis remains to be deter-
mined [24].
Collectively, SOM and k-means analyses catalog a set of
genes representative of a close interplay between promot-
ing and inhibiting factors induced by Tat. These findings,
coupled with the up-regulation of signaling receptors
involved in cell growth and survival, illustrate an intrinsic
ability of HIV-1 Tat in regulating immune evasion, viral
transmission, cell cycle progression and subsequent apop-
tosis. Importantly, these results delineate a variety of cel-
lular gene products, both previously characterized with
respect to HIV-1 and those uncharacterized, to be directly
or indirectly induced by Tat expression. A plausible
notion is that during activated transcription, HIV-1
hijacks the host cell machineries to promote its own rep-
lication, while concurrently directing a certain minimal
level of cell survival until the virus reaches its critical point
of progeny formation and subsequent virus-induced cell
cycle block and apoptosis at the G
2
phase.
siRNA-mediated validation of cellular HIV-1 therapeutic
targets
Using siRNAs targeted at several Tat-induced host cellular
gene products, we examined the significance of our syn-
chronized microarray data on a few genes we thought
were critical for productive viral progeny formation. Based
on the 32 arrays (16 eTat and 16 pCep4) in this study, we
generated a list of Tat-induced genes that included those
genes displaying two or more present calls on the eTat
chips (present on at least 2 of 16 chips) while having 16
absent calls in the control pCep4 chips. We hypothesized
that genes which were consistently (at various cell cycle
phases) induced/repressed by Tat and were absent from
the control pCep4 chips, would be the most important
and specific for the Tat-mediated effects on the viral life
cycle or host cell cycle progression. We also identified
genes that displayed at least four and at least eight present
calls across all 16 eTat chips and displayed all absent calls
across all 16 pCep4 chips [see Additional File 4 and Meth-
ods]. Finally, the two present call gene list was screened
against the Hu95 microarray data indexed at the Chil-
dren's National Medical Center (CNMC) in Washington,
D.C. This analysis was executed to identify those genes
only induced by Tat, while never induced in a myriad of
other human genetic diseases and tissues whose data is
hosted at CNMC. Those genes that were 100% absent or
50.1% to 99.9% absent across all the Hu95 data in the
database were compiled and listed (Table 2). This list of
genes has potential to be very specific cellular therapeutic
targets.
Based on a literature search of our initial list of dysregu-
lated genes (from the K-means, SOMs, and present call
gene list analyses) and from the CNMC screen, we have a
comprehensive list of potential targets. Through the
exhaustive literature search, we looked for genes that were
previously characterized as necessary for HIV-1 replica-
tion and/or progeny formation and identified HIV-1 Rev
Table 2: Tat-upregulated genes not induced in other genetic diseases profiled.
Accession # Fold Change Gene Name
D13243 1.9 Pyruvate kinase L
Z49194 4.1 Pou2AF1 (OBF-1)
AF072099 3.1 LILRB4
U61836 0.2 SMOX
J00117 10.8 CGB
X02612 2.2 Cytochrome P(1)-450 (CYP1A1)
Y12851 0.8 P2X7 receptor
AI349593 0.6 Similar to hemoglobin epsilon chain
AF055007 3.9 MARCH-III
AB002449 3.9 Hypothetical gene
AA203545 1.9 Unknown
Retrovirology 2005, 2:20 />Page 11 of 23
(page number not for citation purposes)
binding protein 2, Pou2AF1 (OBF-1), cyclin A1, PPGB,
EXT2, and HEXA for further analysis. The HIV-1 Rev bind-
ing protein 2 has been characterized as having high hom-
ology to the S. cerevisiae Krr1p protein, which is a
nucleolar protein, and has been shown to be critical for
18S rRNA synthesis and subsequent 40S ribosome synthe-
sis and cell viability [25-27]. Therefore, ablation of the
HIV-1 Rev binding protein 2 should theoretically inhibit
virus replication and possibly direct infected cells towards
apoptosis. The HIV-1 LTR contains four potential binding
sites for the Oct-1 transcription factor and Oct-1 has been
shown to interact with Tat [28]. OBF-1 interacts with Oct-
1 and Oct-2, acting as a B lymphocyte-specific
transcriptional coactivator of B cell activation and matura-
tion, as well as induction of immunoglobulins. It is also
activated in T cells upon TCR signaling [29]. Recently,
OBF-1 was found to up-regulate CCR5 co-receptor surface
expression and fusion to the Env protein of R5 strains, the
predominant strain found during initial infection [29].
Therefore, we predict that this factor is repressed upon the
onset of AIDS, which is usually correlated with a R5 to X4
HIV-1 strain switch. Cyclin A1, which binds and regulates
cdk2 and cdk1, was also chosen for targeted inhibition
since it is important during the S and G
2
phases of the cell
cycle, both of which are important for the viral life cycle
[5,30]. Cyclin A1 has also been shown to bind Rb family
members, the p21/waf1 family of endogenous cdk inhib-
itors, as well as the E2F-1 transcription factor, all of which
are important in the regulation of cell cycle progression
and HIV-1 progeny formation [4,6,31-34].
Based on the importance of viral attachment, entry, and
membrane fusion in the course of infection, we also chose
to inhibit expression of the PPGB protein, which forms a
heterotrimeric complex with the lysosomal enzymes β-
galactosidase and neuraminidase (NA). Though there
have been no reports on the contribution of PPGB in HIV-
1 infection, a number of reports have illustrated the
importance of NA in increasing the efficiency of viral
binding and entry [35,36]. NA is a sialidase that exposes
sites on the HIV-1 gp120 surface protein, enabling greater
interaction between gp120 and the CD4/co-receptor com-
plex, which consequently increases syncytium formation
and single-round infection by both X4 and R5 HIV-1 iso-
lates. These findings coupled with the importance of
HSPGs, illustrate the importance of membrane proteins
and their modifications on both viral attachment and
entry processes. Cellular proteins involved in the fusion
and entry processes of infection may play a greater role in
extracellular Tat-mediated effects, such as bystander cell
infection.
The EXT2 and HEXA gene products were also targeted
since they displayed present calls in at least half of the eTat
chips and showed no induction in the pCep4 chips [see
Additional File 4]. EXT2 is a putative tumor suppressor
with glycosyltransferase activity that is involved in the
chain elongation step of heparan sulfate biosynthesis
[37]. HEXA is involved in ganglioside GM2 degradation
and is a member of a subfamily of glycosyl hydrolases
[38]. It has been established that GM2 levels are signifi-
cantly increased in HIV-1 infection, as is seen both in vitro
and in vivo from seropositive individuals [39,40]. Surpris-
ingly, both groups showed that anti-GM2 IgM antibodies
caused complement-mediated cytolysis of infected cells.
We propose that inhibiting HEXA would increase the lev-
els of circulating GM2 in vivo, thereby creating a more pro-
nounced level of infected cell cytolysis.
Using HIV-1 latently infected OM 10.1 T cells, which con-
tain a single copy of silent full length wild type infectious
provirus, we transfected 10 µg of each siRNA (2 for each
representative gene) into cells. After 48 hrs, TNF-α was
added for 2 hours to induce the latent virus and normal
cell cycle progression. Samples were collected at 72 hrs
post-TNF-α treatment and subjected to p24 Gag ELISA
and western blot analysis. Cells that were not transfected
with any siRNA were used as the negative control sample,
while cdk2 and cdk9-targeted siRNAs served as positive
controls. As seen in Figure 5A, the majority of siRNAs
demonstrated some efficacy in inhibiting p24 expression.
Ablation of EXT2 had a moderate effect (~2 fold reduc-
tion), while the HEXA siRNA had a negligible effect (<1
fold reduction). While the cdk2- and cdk9-mediated inhi-
bition of HIV-1 replication was expected [41,42], the
potency of the other siRNAs were very dramatic. Interest-
ingly, the most effective siRNAs were involved in cell cycle
progression and/or transcription (cdk2, cdk9, cyclin A1,
and OBF-1), RNA pathways (HIV-1 Rev binding protein
2), or membrane protein modification (PPGB). While
EXT2 has been shown to be important in heparan sulfate
synthesis, HSPGs are most important for cells that do not
express large amounts of CD4, such as macrophages [20].
Thus, EXT2 degradation should only affect infection and
replication in cells devoid of CD4.
We also performed series of western blots to measure the
efficiency of inhibition from each of siRNAs tested. As
shown in Figure 5B most siRNA treatments dropped the
protein level by more than 90%, except for the HEXA
gene. None of siRNAs inhibited actin gene expression or
PARP degradation (an indicator of active apoptosis),
implying that the siRNA targets were not toxic in these
transient experiments. We finally performed simple FACS
analysis using PI staining and saw no apparent cell cycle
or apoptotic effects (Figure 6). Although, we have never
been able to inhibit HEXA translation completely in
OM10.1 cells (or three other infected cell lines), data on
HEXA indicates that even a 50% drop in protein levels
Retrovirology 2005, 2:20 />Page 12 of 23
(page number not for citation purposes)
maybe sufficient to increase GM2 levels, thereby increas-
ing a more pronounced rate of viral production.
Next, we performed a similar set of experiments in PBMCs
infected with a HIV-1 field isolate and treatment with var-
ious siRNAs. Activated PBMCs were first treated with 10
µg of each siRNA for 48 hours and subsequently infected
with a field HIV-1 isolate (UG/92/029 Uganda strain, sub-
type A envelope). Supernatants were collected every six
days for Gag p24 assay. Results in Figure 7A indicate that
Representative siRNA-directed inhibition of HIV-1 replicationFigure 5
Representative siRNA-directed inhibition of HIV-1 replication. (A) Using two candidate siRNAs per gene shown, each
siRNA was transfected into HIV-1 latently infected OM-10.1 cells at mid log phase of growth. Following transfection, viral acti-
vation, and treatment, supernatants were collected and analyzed for p24 Gag expression by ELISA. The white crossed bars
represent the first set of experiments, while the black bars represent the second run performed in an identical manner. (B) For
Western blots, protein samples (one hundred micrograms of each extract) were separated on SDS-PAGE and then transferred
to an Immobilon-P (polyvinylidene difluoride; Millipore) membrane and blocked with 5% fat-free milk (in TNE50/0.1% Nonidet
P-40). Membranes were incubated overnight with various primary antibodies, and reactive complexes were developed with
protein G-labeled
125
I and visualized with a PhosphorImager scanner (Amersham Biosciences).
A)
No siRNA
cyclin A1
p24 expression (pg/mL)
cdk2
cdk9
OBF-1
HIV-1 Rev-BP2
PPGB
EXT2
HEXA
100
200
300
400
500
600
_
Experiment 1
Experiment 2
Actin
HEXA
PARP
HEXA siRNA
cyclin A
siRNA
cyclin A OBF-1
cdk9 siRNA
cdk2 siRNA
cdk2
OBF-1 siRNA
cdk9
Rev-BP2 siRNA PPGB siRNA
Rev-BP2
EXT2
EXT2 siRNA
PPGB
ActinActin Actin
Actin
Actin
Actin Actin
12
12
12
12 12 1 2 1 2 1 2
B)
PARP
PARP
PARP
PARP
PARP
PARP
PARP
Retrovirology 2005, 2:20 />Page 13 of 23
(page number not for citation purposes)
siRNA's against cdk9, cdk2, HEXA, and Rev-BP2 were the
most potent inhibitors, followed by siRNAs against cyclin
A, OBF-1 and PPGB, and the least amount of inhibition
with EXT-2 siRNA. Control experiments using antibody
staining against CD4 on activated PBMCs treated with
each siRNA for 48 hours prior to HIV-1 infection showed
no appreciable differences, except a minor drop with cdk2
siRNA (~5%) in CD4 levels (Figure 7B), and a PI staining
of the same cells also showed no significant apoptosis
except for a minor drop with cyclin A siRNA (~5%, Figure
7C), implying that the siRNA treatment in general did not
significantly alter the expression of CD4 levels prior to
FACS analysis of PI stained OM10.1 cellsFigure 6
FACS analysis of PI stained OM10.1 cells. The stained cells were analyzed for red fluorescence (FL2) on a FACScan (Bec-
ton Dickinson, San Jose, CA), and cell distribution in the G
1
, S, and G
2
/M phases of the cell cycle was calculated from the result-
ing DNA histogram with Cell FIT software, based on a rectangular S-phase model. A sub-G1 population was considered as an
apoptotic population.
Channels (FL2-H)
0 20 40 60 80 100 120
Channels (FL2-H)
0 20 40 60 80 100 120
Untreated cdk2 siRNA cdk9 siRNA
G1: 55.22%
S: 8.36%
G2/M: 6.42%
Apoptosis: 0.04%
G1: 57.92%
S: 4.73%
G2/M: 7.34%
Apoptosis: 0.00%
G1: 55.27%
S: 36.53%
G2/M: 7.21%
Apoptosis: 0.00%
Channels (FL2-H)
0 20 40 60 80 100 120
Channels (FL2-H)
0 20 40 60 80 100 120
Channels (FL2-H)
0 20 40 60 80 100 120
Cyclin A siRNA
EXT 2 siRNA
OBF-1 siRNA
G1: 58.19%
S: 35.56%
G2/M: 6.25%
Apoptosis: 0.00%
G1: 8.20%
S: 6.36%
G2/M: 5.44%
Apoptosis: 0.13%
G1: 57.64%
S: 4.98%
G2/M: 7.39%
Apoptosis: 0.00%
Channels (FL2-H)
0 20 40 60 80 100 120
Channels (FL2-H)
0 20 40 60 80 100 120
Channels (FL2-H)
0 20 40 60 80 100 120
G1: 54.52%
S: 7.15%
G2/M: 8.33%
Apoptosis: 0.00%
G1: 59.06%
S: 4.13%
G2/M: 6.81%
Apoptosis: 0.00%
G1: 55.43%
S: 7.46%
G2/M: 7.11%
Apoptosis: 0.12%
PPGB siRNA
Rev BP2 siRNA HEXA siRNA
Channels (FL2-
0 20 40 60 80 100 120
Retrovirology 2005, 2:20 />Page 14 of 23
(page number not for citation purposes)
viral infection. Collectively, these results are somewhat
similar to the latent OM10.1 treatments and imply that
these genes could be a potential target in both cell lines
and primary infections.
Finally, we asked whether the identified gene lists from
our siRNA experiments were specific to HIV-1 transcrip-
tion or could they also inhibit other viral activated tran-
scriptions. We therefore performed CAT assays with either
HIV-LTR-CAT and its activator Tat (as positive controls,
Figure 8, Lanes 1–3) or HTLV-LTR-CAT and its positive
activator Tax (Figure 8, lanes 4–14). Results in Figure 8
show that HIV-1 activated Tat can be suppressed with
cdk2, however none of the siRNA treatments inhibited
HTLV-1 Tax activated transcription except cdk9 siRNA.
This result is somewhat expected since cdk9 is known to
be involved in general transcription elongation, and is
consistent with a recent report indicating that Tax might
have a role in transcription elongation [43,44].
Conclusion
Potential therapeutic targets of HIV-1 Tat-induced cellular
genes
We believe that our current results are by no means the
ultimate list of genes altered by HIV-1 Tat. Some of the
limitations of our experiments include: constant presence
of Tat in cells as compared to possible transient expression
of Tat in HIV-1 infected cells, possible indirect effect of Tat
on gene expression, and lack of using various Tat clades
(i.e., from clades B, E, and C), which may have a different
rate and set of activated genes in vivo. However, we believe
the current study is an ongoing attempt to narrow down
which cellular genes are critical in Tat regulation and
therefore define a minimal set of potential targets for
therapy.
Based on exhaustive and stringent data analysis, we have
compiled a list of gene products that may serve as poten-
tial therapeutic targets for the inhibition of HIV-1
replication (Table 1 and 2). Table 1 specifies Tat-induced
cellular genes at the G
1
/S transition, while Table 2 lists
those genes that were observed to be up-regulated by Tat
while displaying no induction in the myriad of genetic
diseases and diverse tissues and cell types screened at
CNMC. As observed in both tables and the initial screen-
ing of genes displaying at least two present calls, several
genes have been established as important for HIV-1
infection and replication, including OBF-1 [29,45],
complement factor H related 3 [46], CD4 receptor, ICAM-
1 [18], NA [35,36], and cyclin A1 [8,47].
There were also several genes that have not been pub-
lished in relation to HIV-1 infection and may also be
novel and efficacious therapeutics. These include FGFR
and EGFR, the latter of which has been targeted against
various cancers and inhibits cancer-associated angiogen-
esis and subsequent metastasis [48]. Concerning HIV-1
infection and replication, some potentially important
proteins that have not been previously characterized with
respect to HIV-1 and thus necessitate further study, seem
to be the CAP-binding protein complex interacting pro-
tein, tropomyosin 2 beta, BTG3, the IL-10R, PPGB, and
cathepsins Z and L2 [see Additional File 4 and Tables 1
&2]. Though not established, the CAP-binding protein
complex is most likely involved in translation processes.
Tropomyosin 2 beta was found to interact with FRP1,
which is important in the regulation of HIV-1 virus-medi-
ated cell fusion and possibly syncytium formation [49].
Also, therapeutics against individual gene products or a
cocktail containing inhibitors for ICAM-1, LFA-3, DC-
SIGN, all syndecan isoforms, PPGB, clusterin and other
adhesion/membrane proteins important in viral trans-
mission may, alone or in combination with Fuzeon/T20,
significantly abrogate the infection of circulating lym-
phocytes and other cells that are able to support viral
infection and replication.
Recently a report by Krishnan and Zeichner described
experiments associated with changes in cellular gene
expression that accompany the reactivation of the lytic
viral cycle in cell lines chronically infected with HIV-1.
They found that several genes exhibited altered expression
in the chronically infected cells compared to the unin-
fected parental cells prior to induction into lytic replica-
tion including genes encoding proteasomes, histone
deacetylases, and many transcription factors [50].
Although it is difficult for us to compare our results with
Krishnan and Zeichner due to difference in cell types,
presence of all HIV-1 ORFs as compared to our study
where there was only Tat present, and the difference in cell
cycle stages, however, we did a general comparison and
found some overlap between our list of dysregulated
genes and theirs – this overlap includes genes coding for
splicing factors, proteasomes, and heat shock proteins. We
compared our SOM and k-means analyses (Table 1) from
which we found genes that displayed differential expres-
sion at the G1/S phase and found three intersecting genes
as well as some genes that are very closely related to genes
listed in the Krishnan table (e.g. genes coding for a differ-
ent subunit of a protein); these genes are listed in Table 3.
The first part of Table 3 contains three genes that fell in
both our SOM and k-means analyses and the Krishnan
table (bold genes) and the genes from our SOM and k-
means analyses that are closely related to genes in the
Krishnan table. Collectively, the list of common genes
indicates the involvement of HIV-1 Tat in splicing,
transport of RNA, an acceleration of cell cycle stages. All of
these genes fall into pathways that have previously been
reported to be regulated by Tat, including stabilization of
critical transcription units (i.e., Hsp70 stabilization of
Retrovirology 2005, 2:20 />Page 15 of 23
(page number not for citation purposes)
Effect of representative siRNA treatment in PBMC field isolate HIV-1 infectionFigure 7
Effect of representative siRNA treatment in PBMC field isolate HIV-1 infection. Approximately 5 × 10
6
Phytohe-
magglutinin-activated PBMC were kept in culture for two days prior to infection. PBMC were first treated for 48 hrs with 10
µg of the various siRNAs and then infected with SI (UG/92/029 Uganda strain, subtype A envelope, 5 ng of p24 gag antigen)
strain of HIV-1 obtained from the National Institutes of Health (NIH) AIDS Research and Reference Reagent Program. After 8
h of infection, cells were washed and fresh media was added. Samples were collected every sixth day and stored at -20°C for
p24 gag enzyme-linked immunosorbent assay (ELISA). Media from infected cell lines was centrifuged to pellet the cells and
supernatants were collected and diluted to 1:100 to 1:1,000 in RPMI 1640 prior to analysis. Supernatants from the infected
PBMC were collected and used directly for the p24 antigen assay. The p24 gag antigen level was analyzed using the HIVAG-1
Monoclonal Antibody Kit (Abbott Laboratories, Diagnostics Division). (B) PBMCs stimulated with PHA were treated with
appropriate siRNA prior to HIV infection and stained for presence of surface CD4 on activated cells. Prior to infection, 1/5 of
the samples were processed for CD4 and PI staining. Cells were then collected and washed twice with PBS containing FCS and
NaN
3
. Cells were stained on ice for with human tri-color-labeled anti-CD4 (Catalog Laboratories) at a 1:10 dilution. Stained
cells were next washed two times in PBS containing FCS and NaN
3
and fixed in paraformaldehyde followed by analysis by
FACS. (C) FACS analysis of PI stained cells from panel B. Sub-G1 population was scored as apoptotic population in each siRNA
treated cell.
0
2
4
6
8
10
12
14
16
no siRN cdk2
siRN
c
y
clin A
siRN
cdk9
siRN
BH
siRN
Rev-BP
siRN
PP -B
siRN
EXT-2
siRN
OB -1
siRN
%
A
po
pt
0
2
4
6
8
10
12
14
16
no siRN cdk2
siRN
c
y
clin A
siRN
cdk9
siRN
HEXA
siRN
Rev-BP
siRN
PP -B
siRN
EXT-2
siRN
OB -1
siRN
%
A
po
pt
C)
0
2
4
6
8
10
12
14
16
no siRN cdk2
siRN
c
y
clin A
siRN
cdk9
siRN
BH
siRN
Rev-BP
siRN
PP -B
siRN
EXT-2
siRN
OB -1
siRN
%
A
po
pt
0
2
4
6
8
10
12
14
16
no siRNA cdk2
siRNA
cyclin A
siRNA
cdk9
siRNA
HEXA
siRNA
Rev BP2
siRNA
PPGB
siRNA
EXT-2
siRNA
OBF-1
siRNA
% Apoptosis
PBMC (HIV-1 UG/92/029 Uganda strain)
0
500
1000
1500
2000
2500
3000
3500
0
Days Post Infection
p24 (pg/ml)
No siRNA
cyclin A siRNA
cdk2 siRNA
cdk9 siRNA
OBF-1 siRNA
Rev-BP2 siRNA
PPGB siRNA
EXT2 siRNA
HEXA siRNA
6121821
A)
no siRNA
cyclin A siRNA
cdk9 siRNA
HEXA siRNA
Rev-BP2 siRNA
PPGB siRNA
EXT-2 siRNA
OBF-1 siRNA
FL3 (CD4)
#ofEvents
B)
cdk2 siRNA
Retrovirology 2005, 2:20 />Page 16 of 23
(page number not for citation purposes)
CAT assays with HIV-LTR-CAT and its activator Tat, and HTLV-LTR-CAT and its positive activator TaxFigure 8
CAT assays with HIV-LTR-CAT and its activator Tat, and HTLV-LTR-CAT and its positive activator Tax. Lym-
phocyte (CEM, 12D7) cells were grown to mid log phase and were processed for electroporation according to a procedure
published previously [52]. The cells were washed with phosphate-buffered saline and resuspended in RPMI 1640. They were
next transfected with reporter constructs (HIV-LTR-CAT or HTLV-LTR-CAT; 3 ug of each), their respective activators (Tat
or Tax; 4 ug each) or with various siRNAs (10 ug each). Lanes 1–3 serve as positive controls for basal, activated transcription
and effect of cdk2 siRNA on inhibition of HIV-1 LTR. Lanes 4–14 are basal, activated transcription and effect of various siRNAs
on HTLV- LTR-CAT. Only cdk9 siRNA showed an appreciable amount of suppression on Tax activated HTLV-LTR (lane 8).
CAT % conversations are listed below the diagram.
1 2 6 7 8 9 10 11 12
1
3
14435
%
++
+-HIV LTR CAT
-+ +-
-
+
++
+
++++++-+
Tat
HTLV-1 LTR CAT
Tax
-
-
+
++
+
+++++-
-
+
-
24% 99%
47% 15% 99% 99% 99% 40% 98% 99%
99%
99%
99% 99%
+ cdk2 siRNA
+ cyclin A siRNA
+ cdk2 siRNA
+ cdk9 siRNA
+ OBF-1 siRNA
+ Rev-BP2 siRNA
+ PPG-B siRNA
+ EXT-2 siRNA
+ HEXA siRNA
+
Scrambled
siRNA
Retrovirology 2005, 2:20 />Page 17 of 23
(page number not for citation purposes)
Cdk9/cyclin T1 complex), splicing and nuclear transport
(i.e., the SR protein ASF/SF2; Tat-SF1), translation (5'-ter-
minal TAR recognition by eukaryotic translation initiation
factor 2), and degradation of critical factors needed for cell
cycle progression using the proteosome pathway (i.e.,
analogous to HPV E6 binding to p53 and its degradation
resulting in loss of check point, ubiquitin/proteasome
degradation of IkappaB(alpha) and release of active
NFkB, or CD4 glycoprotein degradation through the ubiq-
uitin/proteasome pathway). Therefore these results imply
that Tat regulates these apparently discrete pathways, at
least in case of pre-mRNA processing, where transcription
initiation/early elongation complex directly controls
every aspect of subsequent pre-mRNA processing includ-
ing capping at the 5' end, intron recognition and removal
by splicing, the 3' end cleavage and polyadenylation, and
release of the mature mRNA from the site of transcription
and export to the cytoplasm for translation [51].
While some of these proteins have available inhibitors,
the majority of the potential cellular targets for HIV-1
therapeutics do not have known specific inhibitors. Thus,
much effort must be allocated for the elucidation and
design of specific inhibitors, concurrent with the growing
plausibility of siRNA-based therapeutics. Another impor-
tant factor in designing inhibitors for cellular targets, as
shown with potential cancer therapeutics, is the necessity
to target cellular gene products with redundant functions.
If a certain cellular protein kinase, receptor, membrane
protein, or cytokine/chemokine is inhibited, it may have
adverse effects that make the drug impractical for clinical
trials and use. However, the presence of two or more pro-
teins with similar functions, with only one being critical
for HIV-1 and thus targeted, may allow for the decreased
possibility of side effects. This is especially true for target-
ing redundant molecules (i.e., cdk2), where they are non-
essential during mammalian development and are likely
replaced by other kinases. Similarly, once specific inhibi-
tors are elucidated, a major resulting challenge is generat-
ing a combinatorial therapeutic regimen that is effective
in sub-lethal doses (submicromolar or nanomolar range).
Methods
Cell culture
HeLa CD4
+
cells containing either an epitope-tagged (the
influenza epitope at the C terminus of Tat 1–86) eTat plas-
mid or the parental control vector pCep4 were used [2].
All cells were cultured in RPMI 1640 containing 10% fetal
bovine serum, 1% streptomycin/penicillin, and 1% L-
glutamine (Quality Biological) at 37°C in 5% CO
2
.
Cytoplasmic RNA isolation
Cells were centrifuged at 4°C, 3000 rpm for 10 min.,
quickly washed with D-PBS without Ca
2+
/Mg
2+
, and
centrifuged twice. Pelleted cells were immediately frozen
at -80°C until all time points were collected. Cytoplasmic
RNA was isolated utilizing the RNeasy Mini Kit (Qiagen,
Valencia, CA) according to manufacturer's directions with
the addition of 1 mM dithiothreitol in Buffer RLN. Iso-
lated RNA was quantitated by UV spectrophotometric
analysis and 3 µg of RNA was visualized on a non-dena-
turing 1% agarose TAE gel for quality and quantity
control.
Lymphocyte Transfection
Lymphocyte (CEM, 12D7) cells were grown to mid log
phase and were processed for electroporation according to
a procedure published previously [52]. The cells were cen-
trifuged and then washed with phosphate-buffered saline
without Mg2+ or Ca2+ twice and resuspended in RPMI
Table 3: A set of common genes regulated by Tat in both Tat expressing cells and HIV-1 infected cells.
Probe Set ID Accession # Gene Description
34083_at AA311181 splicing factor, arginine/serine-rich 9
35323_at U78525 eukaryotic translation initiation factor 3, subunit 9 (eta, 116 kD)
31858_at X07315 nuclear transport factor 2
32165_at L41887 splicing factor, arginine/serine-rich 7 (35 kD)
32556_at X64044 U2 (RNU2) small nuclear RNA auxiliary factor 2
33372_at AI189226 RAB31, member RAS oncogene family
39628_at AI671547 RAB9A, member RAS oncogene family
2029_at N36267 Rho GTPase activating protein 5
35255_at AF098799 RAN binding protein 7
1191_s_at AB003102 proteasome (prosome, macropain) 26S subunit, non-ATPase, 11
1192_at AB003103 proteasome (prosome, macropain) 26S subunit, non-ATPase, 12
37350_at AL031177 proteasome (prosome, macropain) 26S subunit, non-ATPase, 10
1104_s_at M11717 heat shock 70 kD protein 1A
36614_at X87949 heat shock 70 kD protein 5 (glucose-regulated protein, 78 kD)
35467_g_at W73046 DnaJ (Hsp40) homolog, subfamily B, member 12
Retrovirology 2005, 2:20 />Page 18 of 23
(page number not for citation purposes)
1640 at 4 × 10
5
cell/0.25 ml. The CEM cells (0.25 ml) were
transfected with the plasmid DNAs of HIV-LTR-CAT or
HTLV-LTR-CAT (3 ug of each) either alone or in combina-
tion with Tat or Tax (4ug each). 10 µg of the various siR-
NAs were also mixed in with reporter and/or appropriate
transactivator prior to electroporation. The mixture of
cells, plasmid DNAs, and siRNAs were then transferred to
a cuvette and electroporated with fast charge rate, at 230
V, and capacitance of 800 microfarads. Cells were then
plated in 10 ml of complete RPMI 1640 medium for 18 h
prior to harvest and CAT assay. For CAT assays, standard
reaction was performed by adding the cofactor coenzyme
A to a microcentrifuge tube containing cell extract and
radiolabeled chloramphenicol, in a final volume of 50 µl
and incubated at 37°C for 1 h. The reaction mixture was
then extracted with ethyl acetate. It was then separated by
TLC on silica gel plates (Baker-flex silica gel TLC plates)
using the chloroform:methanol (19:1) solvent system.
The resolved reaction products were then detected by
exposing the plate to a PhosphorImager cassette.
Immunoprecipitation/Western Blot Analysis
Immunoprecipitations of tat protein were performed as
described previously [2]. Cellular protein (100 µg) was
mixed with monoclonal 12CA5 antibody (2.5 µg) for 2 h
at 4°C. Protein A + G agarose beads (5 µl; Calbiochem,
Inc.) were added and incubated at 4°C for another 2 h.
The immunoprecipitated complex was then spun down
and washed with buffer D containing 500 mM KCl (three
times; 1 ml each). Samples were eluted with HA- peptide
for 4 hrs at 37 C on a rotator, and eluted complexes were
separated on a 4–20% SDS-polyacrylamide gel electro-
phoresis gel, and Western blot analysis was performed
with anti-Tat monoclonal antibody. Antigen/antibody
complexes were detected with
125
I Protein G.
CD4 staining of human cells
Human PBMCs stimulated with PHA were treated with
appropriate siRNA prior to HIV infection. Activated
PBMCs were first treated with 10 µg of each siRNA for 48
hours and subsequently infected with a field HIV-1 isolate
(UG/92/029 Uganda strain, subtype A envelope, 5 ng of
p24 gag antigen) [53]. Prior to infection, 1/5 of the sam-
ples were processed for CD4 and PI staining. Cells were
then collected and washed twice with PBS containing 5%
FCS and 0.05% NaN
3
. Cells were stained on ice for 30
minutes with human tri-color-labeled anti-CD4 (Catalog
Laboratories) at a 1:10 dilution. Stained cells were next
washed two times in PBS containing 5% FCS and 0.05%
NaN
3
and fixed in 1% paraformaldehyde followed by
analysis by FACS.
Cell cycle analysis
The eTat and pCep4 cells were either blocked with hydrox-
yurea (G
1
/S blocker, 2 mM) or nocodazole (G
2
/M blocker,
50 ng/ml). Cells were washed with PBS and released with
complete medium. Samples were collected every 3 hrs and
cytoplasmic RNA was isolated. Single-color flow cytomet-
ric analysis of DNA content (PI staining) was performed
on both cell types [2]. Stained cells (including OM10.1)
were analyzed for red fluorescence (FL2) on a FACScan
(Becton Dickinson, San Jose, CA), and cell distribution in
the G
1
, S, and G
2
/M phases of the cell cycle was calculated
from the resulting DNA histogram with Cell FIT software,
based on a rectangular S-phase model.
PBMC infection
Phytohemagglutinin-activated PBMC were kept in culture
for two days prior to each infection. Isolation and
treatment of PBMC were performed by following the
guidelines of the Centers for Disease Control. Approxi-
mately 5 × 10
6
PBMC were first treated for 48 hrs with 10
µg of the various siRNAs and then infected with SI (UG/
92/029 Uganda strain, subtype A envelope, 5 ng of p24
gag antigen) strain of HIV-1 obtained from the National
Institutes of Health (NIH) AIDS Research and Reference
Reagent Program. After 8 h of infection, cells were washed
and fresh media was added. Samples were collected every
sixth day and stored at -20°C for p24 gag enzyme-linked
immunosorbent assay (ELISA). For HIV-1 p24 ELISA,
media from infected cell lines was centrifuged to pellet the
cells and supernatants were collected and diluted to 1:100
to 1:1,000 in RPMI 1640 prior to analysis. Supernatants
from the infected PBMC were collected and used directly
for the p24 antigen assay. The p24 gag antigen level was
analyzed using the HIVAG-1 Monoclonal Antibody Kit
(Abbott Laboratories, Diagnostics Division).
siRNA analysis
siRNA sequences were designed using the Oligoengine
Workstation
and were pur-
chased from Qiagen-Xeragon. Candidate sequences were
chosen based on general siRNA design criteria, including
a %GC content between 45–55 % and avoiding more
than three consecutive guanosines. Selected target
sequences were also BLASTed http://
www.ncbi.nlm.nih.gov/BLAST/ with a standard nucleo-
tide-nucleotide BLAST to ensure they were not homolo-
gous to other genes. Each candidate siRNA was generated
from the 5' end and consisted of 19 nucleotides with a
d(TT) overhang.
The following genes were chosen for siRNA analysis with
the GenBank accession numbers in brackets: HIV-1 Rev-
binding protein 2 [U00943], Pou2AF1 (OBF1) [Z49194],
cyclin A1 [U66838], PPGB [NM_000308], cdk2
[AF512553], cdk9 [AF517840], EXT2 [U67368], and
HEXA [M16424]. 2 candidate siRNAs were chosen for
each of the 8 genes to ensure protein expression silencing.
For each duplex siRNA, the first sequence represents the
Retrovirology 2005, 2:20 />Page 19 of 23
(page number not for citation purposes)
sense sequence ("s"), and the second, the antisense
sequence ("as"):
HIV-1 Rev-binding protein 2
1. s: GGUCCAAUGGCUGAAACUG,
as: CAGUUUCAGCCAUUGGACC
2. s: ACAGUCAUGCUGCCUUCGA,
as: UCGAAGGCAGCAUGACUGU
Pou2AF1 (OBF-1)
1. s: GAGGAUAGCGACGCCUAUG,
as: CAUAGGCGUCGCUAUCCUC
2. s: UGUCACGACAAGAAGCUCC,
as: GGAGCUUCUUGUCGUGACA
Cyclin A1
1. s: ACUGCAGCUCGUAGGAACA,
as: UGUUCCUACGAGCUGCAGU
2. s: GUAGACACCGGCACACUCA,
as: UGAGUGUGCCGGUGUCUAC
PPGB
1. s: CUAAUGACACUGAGGUCGC,
as: GCGACCUCAGUGUCAUUAG
2. s: UGCGUGACCAAUCUUCAGG,
as: CCUGAAGAUUGGUCACGCA
Cdk2
1. s: AUCCGCCUGGACACUGAGA,
as: UCUCAGUGUCCAGGCGGAU
2. s: UCCUCCUGGGCUGCAAAUA,
as: UAUUUGCAGCCCAGGAGGA
Cdk9
1. s: CCACGACUUCUUCUGGUCC,
as: GGACCAGAAGAAGUCGUGG
2. s: CCGCUGCAAGGGUAGUAUA,
as: UAUACUACCCUUGCAGCGG
EXT2
1. s: GCACCUCGAGCUAUGCAAC,
as: GUUGCAUAGCUCGAGGUGC
2. s: CUCCGUCUUUGGCCUGACA,
as: UGUCAGGCCAAAGACGGAG
HEXA
1. s: CCUGGUCACAAAAGAGCCU,
as: AGGCUCUUUUGUGACCAGG
2. s: GUGUGAAUGGCGUUAGGGU,
as: ACCCUAACGCCAUUCACAC
HIV-1 latently infected OM-10.1 T lymphocytes were
treated with 10 µg of the various siRNAs listed above for
48 hrs prior to TNF-α treatment. siRNAs were electropo-
rated into OM-10.1 cells at 5 × 10
6
(mid log phase of
growth) cells/ml. 48 hrs later cells were treated with TNF-
α (5 µg/ml for 2 hrs) to induce viral transcription and
progeny formation, washed, and complete media was
added to cells. Samples were collected at 72 hrs post-TNF-
α treatment for presence of HIV-1 p24 Gag by ELISA. Pres-
ence of p24 Gag in the supernatant is indicative of mature
infectious virion particles released from HIV-1 infected
cells.
Expression profiling
Six µg of cytoplasmic RNA from each sample were con-
verted to double-stranded cDNA using the Superscript
Choice System kit and T7-(dT)24 primer (100 pmol/µL)
(Invitrogen). The cDNA was cleaned and purified using
phenol/chloroform extraction and ethanol precipitation.
The cDNA was then used to perform in vitro transcription
using the BioArray HighYield RNA Transcript Labeling Kit
(T7) (Enzo, Farmingdale, NY). The biotin-labeled cRNA
was cleaned using the RNeasy Mini Kit (Qiagen) and was
quantified by spectrophotometric analysis and analyzed
on a 1% agarose TAE gel. The biotin-labeled cRNA was
then randomly fragmented to ~35–200 base pairs by
metal-induced hydrolysis using a fragmentation buffer
according to the Affymetrix Eukaryotic Target Hybridiza-
tion protocol. The Human U95Av2 microarrays (Affyme-
trix) were washed, primed, and stained on the Affymetrix
Fluidics Station 400 following the Affymetrix protocol.
cRNA was first detected through a primary scan with phy-
coerythrin-streptavidin staining and then amplified with a
second stain using biotin-labeled anti-streptavidin anti-
body and a subsequent phycoerythrin-streptavidin stain.
The emitted fluorescence was scanned using the Hewlett-
Packard G2500A Gene Array Scanner, and the intensities
were extracted from the chips using Microarray Suite 4.0
(MAS4.0) software. All raw chip data was scaled in
MAS4.0 to 800 to normalize signal intensities for inter-
array comparisons. A statistical algorithm in MAS4.0
assigns present, marginal, and absent calls based on probe
pair intensities where one probe is a perfect match of a ref-
erence sequence and the other is a mismatch probe that
has a single base change at the 13th position within the
25-base oligonucleotide reference sequence.
Quality Control
Report files generated by MAS4.0 were reviewed to ensure
all quality control standards were met – these include per-
centage of present calls, presence of spike controls, signal
scaling factors per chip, and the GAPDH 3'/5' ratios. All
Retrovirology 2005, 2:20 />Page 20 of 23
(page number not for citation purposes)
raw data files containing the signal and detection values
for each probe set and supplemental data files are posted
on a Translational Genomics (TGen) data site, http://
www.tgen.org/research/index.cfm?pageid=142, as well as
on the Gene Expression Omnibus (GEO) online reposi-
tory /> as identified by
GEO accession number [see Additional File 1].
Data analysis
Comparative analyses were performed in MAS4.0
between replicate samples to determine gene expression
behavior changes between every sample set; calls assigned
by MAS4.0 can be either increase, marginally increase,
decrease, marginally decrease, or no change.
Comprehensive microarray data analysis was performed
using GeneSpring software (v4.2; Silicon Genetics, Red-
wood City, CA). Using the synchronized cell cycle data, a
gene list was generated by filtering for genes that had (1)
a minimum of 2 present calls (detection as determined by
MAS4.0) out of a total of 32 calls (1 call per chip), (2) a
maximum p-value of 0.05 where, in this case, the p-value
represents the probability that the signal intensity for a
gene is due to chance alone, and (3) a greater than 2-fold
expression change between control pCep4 samples and
respective eTat samples. To divide the genes in this list
into groups based on similar expression patterns through
the cell cycle, k-means clustering (of 15 clusters as selected
based on Genespring's expressed validity value) was
applied and gene lists for each cluster were consolidated
[see Additional Files 3 and 7].
A complementary analysis was also performed using
SOMs [54]. The input gene list for this analysis was gener-
ated using several filters against the entire list of probe
sets, which represent the gene transcripts on the U95Av2
array: (1) filter for at least 2 present calls, (2) any probe
sets that generated an absent call across all cell cycle time
points were eliminated, (3) any probe sets that did not
have three out of four marginal increase or increase calls,
or marginal decrease or decrease calls in at least one of the
eight cell cycle time points, were removed (based on com-
parative analyses generated by MAS4.0) to control for rep-
licate consistency. The signal log ratio of each gene in the
resulting list was calculated (using the two replicate eTat
samples and 2 replicate pCep4 samples per time point for
each gene):
Three sets of gene lists were created based on 3 separate fil-
tering rules:
(1) 0.666 < ratio < 1.500
(2) 0.500 < ratio < 2.000
(3) 0.333 < ratio < 3.000
For a single rule, if a gene had average signal ratios at every
time point that fell within the specified boundary, the
gene was removed from the list. Separate gene lists were
generated for each rule. For the first rule, 464 genes were
removed and 2330 genes were used for clustering; the sec-
ond rule, 1644 genes were removed and 1150 were used
for analysis; and for the third rule, 2415 genes were elim-
inated and 379 were used for clustering. The gene ratios in
each of the three lists were log transformed (natural base),
median centered, applied to separate SOMs, and visual-
ized using the U-matrix and component planes represen-
tation [for each SOM see Additional Files 5 and 6, and
Figure 4, respectively] [54,55]. The algorithm incorporates
a batch learning algorithm with Euclidean distance, and
all computations were performed using MATLAB (The
MathWorks) with the SOM-toolbox with parameters set
to defaults as described [56]. Defined groups of neurons
that displayed expression differences from one time point
to the next in the component planes representation, as
well as clusters appearing in the U-matrix were noted.
Neurons in the same position across the component
planes contain the same genes; thus, coloring of the neu-
rons allows for direct interpretation of the differences in
expression levels between time points. Gene lists corre-
sponding to the first and third filters were consolidated
[see 1].
The original gene list of synchronized sample data was
also filtered for those genes that had all absent calls in the
control cells and at least 2 present calls in the experimen-
tal cells. The resulting gene list was surveyed against 540
Affymetrix Hu95 chips whose data is hosted at the Chil-
dren's National Medical Center (CNMC) in Washington,
D.C.
. These human
data include all control and experimental data produced
from the study of different genetic diseases in a variety of
human tissues and cultured cells. Those genes from our
gene lists that were 100% absent or 50.1% to 99.9%
absent across all Hu95 data in the database were compiled
and noted to provide an estimate of the drug target
specificity.
Gene classification/ontologies
Genes were classified as functionally relevant to HIV-1
after exhaustive literature review of publications indexed
on the Entrez PubMed website. Affymetrix probe set iden-
tifiers from the increasing and decreasing expression lists
were queried on the Affymetrix website http://
www.affymetrix.com using the NetAffx analysis tool to
determine gene names and functions. The genes in the
resulting lists were classified into ontologies to show the
average signal ratio =
average of 2 raw signal values for thee experimental samples
average of 2 raw signal values for
the control samples
Retrovirology 2005, 2:20 />Page 21 of 23
(page number not for citation purposes)
genes having increased or decreased expression (organ-
ized based on their respective functions). For the gene
ontology for the entire human U95Av2 genechip, ontol-
ogy lists specific to the classifications available on Gene-
spring v5.0.3 were first obtained. The remaining
classifications were queried on the Affymetrix website
with the NetAffx tool />sis/index.affx.
Abbreviations
HIV-human immunodeficiency virus
PBMC-peripheral blood mononuclear cells
HAART-highly active retroviral therapy
NNRTI-non-nucleoside reverse transcriptase inhibitor
NRTI-nucleoside reverse transcriptase inhibitor
TAR-transactivation response
Hu-hydroxyurea
Noco-nocodazole
CNMC-Children's National Medical Center
NA-neuraminidase
FGFR-fibroblast growth factor receptor
EGFR-epidermal growth factor receptor
ELISA-enzyme-linked immunosorbent assay
Competing Interests
The author(s) declare that they have no competing
interests.
Authors' Contributions
WSL performed the data analyses and helped to draft the
manuscript. AM, and EA performed the siRNA experi-
ments, coordinated data analysis, and helped to draft the
manuscript. TT performed the expression profiling proto-
col on all samples. CdlF isolated RNA and contributed to
the expression profiling experiment. KK, CdlF, and SD
helped with the gene expression profiling, westerns, and
FACS. SH ran the self-organizing map analyses. AP pro-
vided some of the supervision for the manuscript and sup-
port for the Kashanchi lab members. DAS coordinated the
expression profiling and analytical methodology. FK par-
ticipated in the design, coordination, and validation of
the study. DAS and FK funded the studies. All authors
have read and approved the manuscript.
Additional material
Acknowledgements
This work was supported by grants from the George Washington Univer-
sity REF funds to A. Vertes and F. Kashanchi, NIH grants AI44357, AI43894
and 13969 to F.K, and grant 1U24NS043571-01 for the NINDS/NIMH
Microarray Consortium. A.M. and W.S.L. contributed equally to this work.
F.K. and D.A.S. share senior authorship on this work.
References
1. Baldwin CE, Sanders RW, Berkhout B: Inhibiting hiv-1 entry with
fusion inhibitors. Curr Med Chem 2003, 10:1633-1642.
Additional File 1
GEO accession numbers for each sample
Click here for file
[ />4690-2-20-S1.xls]
Additional File 2
Self-organizing map (SOM) gene lists for the first and third filters (two
Excel worksheets, "HIV_SOM_Filt_1a" & "HIV_SOM_Filt_3a")
Click here for file
[ />4690-2-20-S2.xls]
Additional File 3
K-means clustering gene lists (three Excel worksheets, "set1–5," "set6–
10," "set11–15")
Click here for file
[ />4690-2-20-S3.xls]
Additional File 4
Gene lists filtered for all absent in pCep4 samples and at least 2 present
calls in eTat samples (Excel worksheet, "2P"), 4 present calls in eTat sam-
ples (Excel worksheet, "4P"), and 8 present calls in eTat samples (Excel
spreadsheet, "8P")
Click here for file
[ />4690-2-20-S4.xls]
Additional File 5
Self-organizing map (SOM) for filter 1 (refer to Methods)
Click here for file
[ />4690-2-20-S5.jpeg]
Additional File 6
Self-organizing map (SOM) for filter 2 (refer to Methods)
Click here for file
[ />4690-2-20-S6.jpeg]
Additional File 7
K-means clustering (15 graphs and corresponding close-ups shown)
Click here for file
[ />4690-2-20-S7.ppt]
Retrovirology 2005, 2:20 />Page 22 of 23
(page number not for citation purposes)
2. Kashanchi F, Agbottah ET, Pise-Masison CA, Mahieux R, Duvall J,
Kumar A, Brady JN: Cell cycle-regulated transcription by the
human immunodeficiency virus type 1 tat transactivator. J
Virol 2000, 74:652-660.
3. Kundu M, Sharma S, De Luca A, Giordano A, Rappaport J, Khalili K,
Amini S: Hiv-1 tat elongates the g1 phase and indirectly pro-
motes hiv-1 gene expression in cells of glial origin. J Biol Chem
1998, 273:8130-8136.
4. Ambrosino C, Palmieri C, Puca A, Trimboli F, Schiavone M, Olimpico
F, Ruocco MR, di Leva F, Toriello M, Quinto I, Venuta S, Scala G:
Physical and functional interaction of hiv-1 tat with e2f-4, a
transcriptional regulator of mammalian cell cycle. J Biol Chem
2002, 277:31448-31458.
5. de la Fuente C, Santiago F, Deng L, Eadie C, Zilberman I, Kehn K, Mad-
dukuri A, Baylor S, Wu K, Lee C, Pumfery A, Kashanchi F: Gene
expression profile of hiv-1 tat expressing cells: A close inter-
play between proliferative and differentiation signals. BMC
Biochem 2002, 3:14.
6. Clark E, Santiago F, Deng L, Chong S, de La Fuente C, Wang L, Fu P,
Stein D, Denny T, Lanka V, Mozafari F, Okamoto T, Kashanchi F: Loss
of g(1)/s checkpoint in human immunodeficiency virus type
1-infected cells is associated with a lack of cyclin-dependent
kinase inhibitor p21/waf1. J Virol 2000, 74:5040-5052.
7. de la Fuente C, Wang L, Wang D, Deng L, Wu K, Li H, Stein LD,
Denny T, Coffman F, Kehn K, Baylor S, Maddukuri A, Pumfery A,
Kashanchi F: Paradoxical effects of a stress signal on pro- and
anti-apoptotic machinery in htlv-1 tax expressing cells. Mol
Cell Biochem 2003, 245:99-113.
8. Wang D, de la Fuente C, Deng L, Wang L, Zilberman I, Eadie C, Hea-
ley M, Stein D, Denny T, Harrison LE, Meijer L, Kashanchi F: Inhibi-
tion of human immunodeficiency virus type 1 transcription
by chemical cyclin-dependent kinase inhibitors. J Virol 2001,
75:7266-7279.
9. Corbeil J, Sheeter D, Genini D, Rought S, Leoni L, Du P, Ferguson M,
Masys DR, Welsh JB, Fink JL, Sasik R, Huang D, Drenkow J, Richman
DD, Gingeras T: Temporal gene regulation during hiv-1 infec-
tion of human cd4+ t cells. Genome Res 2001, 11:1198-1204.
10. van 't Wout AB, Lehrman GK, Mikheeva SA, O'Keeffe GC, Katze MG,
Bumgarner RE, Geiss GK, Mullins JI: Cellular gene expression
upon human immunodeficiency virus type 1 infection of
cd4(+)-t-cell lines. J Virol 2003, 77:1392-1402.
11. Ensoli F, Fiorelli V, DeCristofaro M, Santini Muratori D, Novi A, Van-
nelli B, Thiele CJ, Luzi G, Aiuti F: Inflammatory cytokines and hiv-
1-associated neurodegeneration: Oncostatin-m produced by
mononuclear cells from hiv-1-infected individuals induces
apoptosis of primary neurons. J Immunol 1999, 162:6268-6277.
12. Clegg CH, Rulffes JT, Wallace PM, Haugen HS: Regulation of an
extrathymic t-cell development pathway by oncostatin m.
Nature 1996, 384:261-263.
13. Falco GD, Neri LM, Falco MD, Bellan C, Yu Z, Luca AD, Leoncini L,
Giordano A: Cdk9, a member of the cdc2-like family of
kinases, binds to gp130, the receptor of the il-6 family of
cytokines. Oncogene 2002, 21:7464-7470.
14. Alderson MR, Smith CA, Tough TW, Davis-Smith T, Armitage RJ, Falk
B, Roux E, Baker E, Sutherland GR, Din WS: Molecular and biolog-
ical characterization of human 4-1bb and its ligand. Eur J
Immunol 1994, 24:2219-2227.
15. DeBenedette MA, Chu NR, Pollok KE, Hurtado J, Wade WF, Kwon
BS, Watts TH: Role of 4-1bb ligand in costimulation of t lym-
phocyte growth and its upregulation on m12 b lymphomas
by camp. J Exp Med 1995, 181:985-992.
16. Shankar P, Schlom J, Hodge JW: Enhanced activation of rhesus t
cells by vectors encoding a triad of costimulatory molecules
(b7-1, icam-1, lfa-3). Vaccine 2001, 20:744-755.
17. Kim JJ, Tsai A, Nottingham LK, Morrison L, Cunning DM, Oh J, Lee
DJ, Dang K, Dentchev T, Chalian AA, Agadjanyan MG, Weiner DB:
Intracellular adhesion molecule-1 modulates beta-chemok-
ines and directly costimulates t cells in vivo. J Clin Invest 1999,
103:869-877.
18. Bounou S, Leclerc JE, Tremblay MJ: Presence of host icam-1 in
laboratory and clinical strains of human immunodeficiency
virus type 1 increases virus infectivity and cd4(+)-t-cell deple-
tion in human lymphoid tissue, a major site of replication in
vivo. J Virol 2002, 76:1004-1014.
19. Swingler S, Brichacek B, Jacque JM, Ulich C, Zhou J, Stevenson M:
Hiv-1 nef intersects the macrophage cd40l signalling path-
way to promote resting-cell infection. Nature 2003,
424:213-219.
20. Bobardt MD, Saphire AC, Hung HC, Yu X, Van der Schueren B,
Zhang Z, David G, Gallay PA: Syndecan captures, protects, and
transmits hiv to t lymphocytes. Immunity 2003, 18:27-39.
21. Cotter R, Williams C, Ryan L, Erichsen D, Lopez A, Peng H, Zheng J:
Fractalkine (cx3cl1) and brain inflammation: Implications
for hiv-1-associated dementia. J Neurovirol 2002, 8:585-598.
22. Stumptner-Cuvelette P, Morchoisne S, Dugast M, Le Gall S, Raposo
G, Schwartz O, Benaroch P: Hiv-1 nef impairs mhc class ii anti-
gen presentation and surface expression. Proc Natl Acad Sci U S
A 2001, 98:12144-12149.
23. Cohen GB, Gandhi RT, Davis DM, Mandelboim O, Chen BK,
Strominger JL, Baltimore D: The selective downregulation of
class i major histocompatibility complex proteins by hiv-1
protects hiv-infected cells from nk cells. Immunity 1999,
10:661-671.
24. Lozano JM, Gonzalez R, Kindelan JM, Rouas-Freiss N, Caballos R,
Dausset J, Carosella ED, Pena J: Monocytes and t lymphocytes in
hiv-1-positive patients express hla-g molecule. Aids 2002,
16:347-351.
25. Gromadka R, Rytka J: The krr1 gene encodes a protein required
for 18s rrna synthesis and 40s ribosomal subunit assembly in
saccharomyces cerevisiae. Acta Biochim Pol 2000, 47:993-1005.
26. Sasaki T, Toh EA, Kikuchi Y: Yeast krr1p physically and function-
ally interacts with a novel essential kri1p, and both proteins
are required for 40s ribosome biogenesis in the nucleolus.
Mol Cell Biol 2000, 20:7971-7979.
27. Chan HY, Brogna S, O'Kane CJ: Dribble, the drosophila krr1p
homologue, is involved in rrna processing. Mol Biol Cell 2001,
12:1409-1419.
28. Liu YZ, Latchman DS: The octamer-binding proteins oct-1 and
oct-2 repress the hiv long terminal repeat promoter and its
transactivation by tat. Biochem J 1997, 322(Pt 1):155-158.
29. Moriuchi M, Moriuchi H: Octamer transcription factors up-reg-
ulate the expression of ccr5, a coreceptor for hiv-1 entry. J
Biol Chem 2001, 276:8639-8642.
30. Chowdhury IH, Wang XF, Landau NR, Robb ML, Polonis VR, Birx DL,
Kim JH: Hiv-1 vpr activates cell cycle inhibitor p21/waf1/cip1:
a potential mechanism of g2/m cell cycle arrest. Virology 2003,
305:371-377.
31. Yang R, Muller C, Huynh V, Fung YK, Yee AS, Koeffler HP: Functions
of cyclin a1 in the cell cycle and its interactions with tran-
scription factor e2f-1 and the rb family of proteins. Mol Cell Biol
1999, 19:2400-2407.
32. Prasad MV, Shanmugam G: Retinoblastoma gene inhibits trans-
activation of hiv-ltr linked gene expression upon co-transfec-
tion in he la cells. Biochem Mol Biol Int 1993, 29:57-62.
33. Hall M, Bates S, Peters G: Evidence for different modes of action
of cyclin-dependent kinase inhibitors: p15 and p16 bind to
kinases, p21 and p27 bind to cyclins. Oncogene 1995,
11:1581-1588.
34. Clarke B, Chetty R: Cell cycle aberrations in the pathogenesis
of squamous cell carcinoma of the uterine cervix. Gynecol
Oncol 2001, 82:238-246.
35. Sun J, Barbeau B, Sato S, Tremblay MJ: Neuraminidase from a bac-
terial source enhances both hiv-1-mediated syncytium for-
mation and the virus binding/entry process. Virology 2001,
284:26-36.
36. Hart ML, Saifuddin M, Spear GT: Glycosylation inhibitors and
neuraminidase enhance human immunodeficiency virus
type 1 binding and neutralization by mannose-binding lectin.
J Gen Virol 2003, 84:353-360.
37. Morimoto K, Shimizu T, Furukawa K, Morio H, Kurosawa H, Shiras-
awa T: Transgenic expression of the ext2 gene in developing
chondrocytes enhances the synthesis of heparan sulfate and
bone formation in mice. Biochem Biophys Res Commun 2002,
292:999-1009.
38. Werth N, Schuette CG, Wilkening G, Lemm T, Sandhoff K: Degra-
dation of membrane-bound ganglioside gm2 by beta -hex-
osaminidase a. stimulation by gm2 activator protein and
lysosomal lipids. J Biol Chem 2001, 276:12685-12690.
39. Wu X, Okada N, Momota H, Irie RF, Okada H: Complement-
mediated anti-hiv-1 effect induced by human igm mono-
clonal antibody against ganglioside gm2. J Immunol 1999,
162:533-539.
Publish with BioMed Central and every
scientist can read your work free of charge
"BioMed Central will be the most significant development for
disseminating the results of biomedical research in our lifetime."
Sir Paul Nurse, Cancer Research UK
Your research papers will be:
available free of charge to the entire biomedical community
peer reviewed and published immediately upon acceptance
cited in PubMed and archived on PubMed Central
yours — you keep the copyright
Submit your manuscript here:
/>BioMedcentral
Retrovirology 2005, 2:20 />Page 23 of 23
(page number not for citation purposes)
40. Okada N, Wu X, Mizokami M, Irie RF, Okada H: Human igm mon-
oclonal antibody to ganglioside gm2 and complement sup-
press virus propagation in ex vivo cultures of lymphocytes
from hiv-1 infected patients. Microbiol Immunol 1999, 43:723-727.
41. de la Fuente C, Maddukuri A, Kehn K, Baylor SY, Deng L, Pumfery A,
Kashanchi F: Pharmacological cyclin-dependent kinase inhibi-
tors as hiv-1 antiviral therpaeutics. Current HIV Research 2003,
1:131-152.
42. Schang LM, Bantly A, Knockaert M, Shaheen F, Meijer L, Malim MH,
Gray NS, Schaffer PA: Pharmacological cyclin-dependent
kinase inhibitors inhibit replication of wild-type and drug-
resistant strains of herpes simplex virus and human immun-
odeficiency virus type 1 by targeting cellular, not viral,
proteins. J Virol 2002, 76:7874-7882.
43. Ching YP, Chun AC, Chin KT, Zhang ZQ, Jeang KT, Jin DY: Specific
TATAA and bZIP requirements suggest that HTLV-I Tax
has transcriptional activity subsequent to the assembly of an
initiation complex. Retrovirology 2004, 1:18.
44. De La Fuente C, Kashanchi F: The expanding role of Tax in
transcription. Retrovirology 2004, 1:19.
45. Liu YZ, Lania L, Latchman DS: Functional interaction between
the hiv-1 tat transactivator and the inhibitory domain of the
oct-2 cellular transcription factor. Aids 1996, 10:1323-1329.
46. Stoiber H, Pinter C, Siccardi AG, Clivio A, Dierich MP: Efficient
destruction of human immunodeficiency virus in human
serum by inhibiting the protective action of complement fac-
tor h and decay accelerating factor (daf, cd55). J Exp Med 1996,
183:307-310.
47. Sieg SF, Harding CV, Lederman MM: Hiv-1 infection impairs cell
cycle progression of cd4(+) t cells without affecting early
activation responses. J Clin Invest 2001, 108:757-764.
48. Matsuo M, Sakurai H, Saiki I: Zd a selective epidermal growth
factor receptor tyrosine kinase inhibitor, shows antimeta-
static activity using a hepatocellular carcinoma model. Mol
Cancer Ther 1839, 2:557-561.
49. Suga S, Tsurudome M, Ito M, Ohgimoto S, Tabata N, Nishio M,
Kawano M, Komada H, Sakurai M, Ito Y: Human immunodefi-
ciency virus type-1 envelope glycoprotein gp120 induces
expression of fusion regulatory protein (frp)-1/cd98 on cd4+
t cells: A possible regulatory mechanism of hiv-induced syn-
cytium formation. Med Microbiol Immunol (Berl) 1997, 185:237-243.
50. Krishnan V, Zeichner SL: Host cell gene expression during
human immunodeficiency virus type 1 latency and reactiva-
tion and effects of targeting genes tha are differentially
expressed in viral latency. J Virol 2004, 78:9458-73.
51. Maniatis T, Reed R: An extensive network of coupling among
gene expression machines. Nature 2002, 416:499-506. Review
52. Furia B, Deng L, Wu K, Baylor S, Kehn K, Li H, Donnelly R, Coleman
T, Kashanchi F: Enhancement of nuclear factor-kappa B
acetylation by coactivator p300 and hiv-1 tat proteins. J Biol
Chem 2002, 277:4973-80.
53. Agbottah E, de La Fuente C, Nekhai S, Barnett A, Gianella-Borradori
A, Pumfery A, Kashanchi F: Antiviral activity of cyc202 in hiv-1-
infected cells. J Biol Chem 2005, 280:3029-42.
54. Kohonen T: Self-organizing maps. 3rd edition. Heidelberg:
Springer-Verlag; 2001.
55. Hautaniemi S, Yli-Harja O, Astola J, Kauraniemi P, Kallioniemi A, Wolf
M, Ruiz J, Mousses S, Kallioniemi O: Analysis and visualization of
gene expression microarray data in human cancer using self-
organizing maps. Machine Learning 2003, 52:45-66.
56. Vesanto J, Himberg J, Alhoniemi E, Parhankangas J: Som toolbox for
matlab 5. In Book Som toolbox for matlab 5 (Editor ed) 5th edition. Hel-
sinki University of Technology; 2000:A57.