Báo cáo y học: " Determination of the relative amounts of Gag and Pol proteins in foamy virus particles" doc
Bạn đang xem bản rút gọn của tài liệu. Xem và tải ngay bản đầy đủ của tài liệu tại đây (350.2 KB, 7 trang )
BioMed Central
Page 1 of 7
(page number not for citation purposes)
Retrovirology
Open Access
Short report
Determination of the relative amounts of Gag and Pol proteins in
foamy virus particles
Marc Cartellieri
1,2
, Wolfram Rudolph
1
, Ottmar Herchenröder
1
,
Dirk Lindemann
1
and Axel Rethwilm*
2
Address:
1
Institut für Virologie, Medizinische Fakultät, Technische, Universität Dresden, Germany and
2
Institut für Virologie und Immunbiologie,
Universität Würzburg, Germany
Email: Marc Cartellieri - ; Wolfram Rudolph - ;
Ottmar Herchenröder - ; Dirk Lindemann - ;
Axel Rethwilm* -
* Corresponding author
Abstract
We determined the relative ratios of Gag and Pol molecules in highly purified virions of
spumaretroviruses or foamy viruses (FVs) using monoclonal antibodies and bacterially expressed
reference proteins. We found that the cleaved p68
Gag
moiety dominates in infectious FVs.
Furthermore, approximate mean ratios in FV are 16:1 (pr71
Gag
plus p68
Gag
:p85
RT
),12:1
(p68
Gag
:p85
RT
), and 10:1 (pr71
Gag
plus p68
Gag
:p40
IN
). Thus, the results indicate that FVs have found
a way to incorporate approximately as much Pol protein into their capsids as orthoretroviruses,
despite a completely different Pol expression strategy.
One of the central features of Spumaretrovirinae, which dis-
tinguishes them from Orthoretrovirinae, is the expression
of a Pol precursor protein independently of the Gag pro-
tein from a spliced mRNA [1-3]. This mechanism of Pol
generation raises several interesting questions: (i) How is
Pol expression regulated? (ii) How is the Pol protein
incorporated into the virion? (iii) And how much Pol pro-
tein is actually present in infectious viruses? While ques-
tion one has, to our knowledge, not been investigated yet,
answers to question two are emerging [4,5]. Here we tried
to address question three.
Theoretical lines of argument favor the view that only a
few molecules of Pol may be incorporated into a FV parti-
cle. The reverse transcriptase (RT) is the main enzymatic
subunit of the Pol precursor [6]. This enzyme has been
shown to be of much higher processivity than orthoretro-
viral RTs [7,8]. Therefore, it was argued that FVs probably
encapsidate less of their highly active Pol protein com-
pared to orthoretroviruses [7,8]. Following this line of
argument, it is noteworthy that the FV protease (PR) is
contained within the 85 kD Pol subunit, which also bears
the RT/RNaseH [6]. However, in contrast to orthoretrovi-
ruses, the FV PR cleaves the cognate Gag protein only once
prior to or during budding [6]. Therefore, FV may need
less amounts of PR enzyme than orthoretroviruses.
Furthermore, experiments aimed to elucidate the mecha-
nism of Pol protein particle incorporation (the above
raised question two) indicated that Pol interacts with spe-
cific sequences on the (pre-) genomic RNA and that RNA
serves as a bridging molecule between Gag (capsid) and
Pol [4,5]. Two distinct elements on the RNA have been
identified, which probably facilitate this interaction [4].
Published: 08 July 2005
Retrovirology 2005, 2:44 doi:10.1186/1742-4690-2-44
Received: 18 April 2005
Accepted: 08 July 2005
This article is available from: />© 2005 Cartellieri et al; licensee BioMed Central Ltd.
This is an Open Access article distributed under the terms of the Creative Commons Attribution License ( />),
which permits unrestricted use, distribution, and reproduction in any medium, provided the original work is properly cited.
Retrovirology 2005, 2:44 />Page 2 of 7
(page number not for citation purposes)
This can be regarded as another argument in support of
only trace amounts of encapsidated Pol protein.
Here we wanted to investigate the approximate relative
ratio of Pol to Gag molecules in infectious virions on a
biochemical level to get an estimate of the FV particle
composition using the prototypic FV (PFV) as a model.
We did not attempt to determine absolute numbers of
Gag and Pol molecules per particle.
Prokaryotic expression and purification of viral proteins
The cloning strategy [9,10] and the purified recombinant
proteins are depicted in Fig. 1. pETgag2 was made by
digestion of pETgagl [11] with AdeI, T4 DNA polymerase
treatment, and recutting with NdeI. A 1.9 kb gag gene (aa
1–625 of 648 aa) was inserted into pET22b (Novagen) in-
frame to the C-terminal histidine tag after SacI, T4 DNA
polymerase, and NdeI treatment. The PFV pol domain
encoding the 85 kD PR, RT, and RNaseH subunits was
amplified with primers #1217 (5'tc cacata
tgaatcctcttcagct-
gttacagccgc) and #1414 (5'tattacactcga
gcacataacttccttg),
which bear NdeI and XhoI restriction sites (underlined).
pETpol2 was made from pET22b and the amplimer using
these enzymes. The integrase (IN; aa 751–1143) construct
pETpol3 was made alike with #1219 (5'gttatgtgca
tatgtg-
taataccaaaaaacc) and #1413(5'tgcgctctcgag
atttttttccaaatg).
All plasmids were sequenced in their FV parts to verify cor-
rect insertions and to exclude PCR artifacts.
BL21(DE3)pLys (Novagen) served as a host strain for
recombinant proteins. Expression was induced with 1
mM isopropyl-β-D-thiogalactopyranoside. The proteins
were purified on Ni
2+
-chelate columns under denaturing
conditions with 6 M urea. After renaturation in dialysis
buffer (150 mM NaCl, 1 mM EDTA pH 5,0, 20 mM Tric-
HCL pH 7,5) the amounts of purified proteins in the
eluted fractions were determined by a BCA assay (Pierce).
Proteins were subjected to sodium-dodecyl-sulfate-con-
taining 7.5% polyacrylamide gel electrophoresis (SDS-
PAGE) and Coomassie-blue stain. The purity was ana-
lyzed by digital imaging (Phoretix 1D Advanced Version
4.01).
Pol protein is abundant in cells lytically infected with FV
We first estimated the amount of Pol proteins present in
FV infected cells. In addition, we determined the sensitiv-
ity of the MABs in detecting Gag and Pol protein species.
A cellular lysate was prepared from BHK-21 cells lytically
infected with PFV, which was obtained by transfection of
293T cells with the pcHSRV2 infectious molecular clone
by calcium phosphate coprecipitation [12]. Proteins in
the lysates were analysed with the Gag and Pol hybrido-
mas SGG1 (recognizing Gag), 15E10 (PR/RT/RnaseH),
and 3E11 (IN) [11,13] in an immunoblot along with
defined amounts of recombinant Gag and Pol proteins
purified from bacteria. As shown in Fig. 2, the MAB 3E11
has a detection limit of approx. 10 ng of IN protein
expressed in bacteria, while the RT (15E10) and Gag
(SGG1) MABs were able to detect 20 ng and 40 ng of the
respective proteins from bacteria. This experiment further
revealed that the method to detect FV Gag and Pol by the
ECLplus reagent (Amersham-Pharmacia) was in a linear
range from 10 to more than 100 ng of recombinant pro-
tein (Fig. 2 and data not shown). The IgG concentrations
of the hybridomas used in this particular experiment were
determined, following a published protocol (Mouse-IgG-
ELISA, Roche), to be 3.2µg/ml (3E11), 10.5 µg/ml
(15E10), and 10.1 µg/ml (SGG1). In conclusion, the IN
MAB was at least 12 times more sensitive than the Gag
MAB and approx. 6.5 times more than the RT antibody.
Due to the presence of five Gag and Pol molecule species
of different molecular weights (pr71
Gag
, p68
Gag
, pr127
Po1
,
p85
RT
, and p40
IN
) it was not possible to calculate exactly
the respective molecule numbers present in infected cells.
However, the comparison of the intensity of the lanes cor-
responding to Gag (pr71/p68) and Pol (pr127/p85/p40)
proteins, which were detected by the MABs in the lysates,
indicated that high amounts of Pol are expressed upon
lytic infection in BHK-21 cells. This correlates well with
the published amount of pol-specific mRNA, reported to
equal the full-length or gag-specific mRNA in the bovine
FV system [14]. The ease, with which Pol proteins can be
detected in FV infected cells is indicative of their relatively
high expression level compared to Gag. This finding ques-
tions the theoretical assumption of only trace amounts of
Pol in FV particles. Obviously, FV utilizes distinct ways to
avoid overloading infected cells with Pol protein. High
cellular loads of retroviral Pol proteins can be associated
with cell toxicity [15]. Although not necessary to incorpo-
rate high amounts of RT in FV particles, this abundance of
FV Pol proteins in infected cells may have other yet undis-
covered reasons in FV biology.
Determination of the Pol protein amounts relative to Gag
in FV particles
We generated highly purified virus by consecutive centrif-
ugation through a sucrose cushion and a linear gradient
made of iodixanol. BHK-21 cells were infected with the
supernatant from transfected 293T cells and cell-free virus
was harvested when productive infection was ongoing,
usually after 3–5 days. The supernatant was clarified from
cellular debris by low-speed centrifugation and filtered
through a 0.45µm pore-size filter (Sartorius). Virus was
concentrated by centrifugation through a 20% sucrose
cushion in TNE buffer (20 mM TRIS-HC1, pH 7.5, 150
mM NaC1, 1 mM EDTA) in a SW28 rotor (Beckman) at
25,000 rpm, 4°C for 1 hr. The sediment was resolved in
Dulbecco's minimal essential medium (DMEM) and
placed on a 2 ml 10–40% continuous iodixanol
Retrovirology 2005, 2:44 />Page 3 of 7
(page number not for citation purposes)
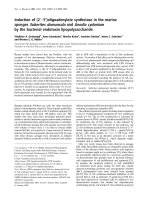
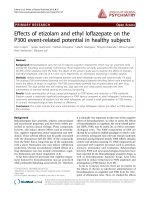
Bacterial expression of PFV gag and pol genesFigure 1
Bacterial expression of PFV gag and pol genes. (A) Strategy to insert the gag and pol open reading frames into the bacterial
expression vector pET22b. The FV gene fragments are placed in frame to a C-terminal histidine (HIS) tag. (RBS), prokaryotic
ribosomal binding site. (B) Coomassie stain of recombinant proteins which were purified via the C-terminal HIS-tag over Ni
2+
-
chelate matrices. Two examples per protein are shown.
Retrovirology 2005, 2:44 />Page 4 of 7
(page number not for citation purposes)
(OptiPrep from Axis-Shield) gradient for further virus
purification. The gradient was cast in a gradient mixer
(SG30 from Hoefer) the day before use. Following centrif-
ugation in a TLS-55 rotor (Beckman) at 48,000 rpm and
4°C for 4 hrs, 200 µl fractions were taken from the top.
From each fraction 30 µl were used for the determination
of the refraction index, 20 µ1 for infectivity assay on BHK/
LTR(PFV)lacZ cells [16], and l00 µl for immunoblotting.
As exemplified in Fig. 3A, fractions 5 and 6 were the main
gradient fractions in which viral Gag and Pol proteins
were detected by immunoblotting. Fraction 6 was also the
main fraction of viral infectivity as shown in Fig. 3B. A
mean density of 1.119 g/ml (± 0.011) was found for infec-
tious PFV particles. This value is slightly lower than previ-
ous results with sucrose gradients [3,17,18]. Defined
amounts of bacterially-expressed Gag and Pol proteins
were also applied to the gel. The intensities of the bands
were determined with a LAS-3000 (Fujifilm) and the rela-
tive amounts of Gag and Pol proteins were calculated
using the software Image Gauge 3.01 (Fujifilm). A regres-
sion curve was formed, in which the total amounts of
recombinant protein loaded in each lane were related to
the optical densities of the individual protein bands
which were produced after blotting, reaction with MABs,
and ECLplus staining. In Fig. 4 an example is depicted,
which was derived from the same samples shown in Fig.
3. The ability to build a regression curve from the sample
detection also illustrates that the assay was linear over the
protein range analyzed.
A total of 36 gradient fractions were analyzed with three
independent quantifications for the individual gradients.
The results are summarized in Table 1. We found that
purified FV virions had a mean pr71
Gag
to p68
Gag
ratio of
1 to 4.2, which indicated that the cleaved p68
Gag
protein
is the dominant capsid protein species in infectious PFV
particles. The SGG1 MAB binding site is located N-termi-
nal of the Gag cleavage site that generates p68 Gag and the
3 kD C-terminal peptide from the pr71 Gag precursor
(our unpublished results). Therefore, the antibody detects
both, the uncleaved and the cleaved protein equally well.
The 127 kD Pol precursor protein was barely detected in
the virus preparations, which indicated almost complete
cleavage into the 85 kD RT and 40 kD IN subunits. Impor-
tantly, the relation of Gag proteins (pr71 plus p68) to
p85
RT
was determined to be 15.8 to 1. This illustrates that
PFV has found an independent way to incorporate as
much Pol protein relative to Gag into progeny virus as typ-
ically found in orthoretroviruses [19]. With respect to the
amount of IN protein, a ratio of 9.8 Gag molecules
(pr71
Gag
plus p68
Gag
) to 1 IN molecule was revealed. Con-
sidering only the cleaved moiety, the p68
Gag
/p40
IN
ratio
was determined to be 7.8 to 1 (Table 1). Thus, we con-
stantly detected approximately 1.6 to two times more IN
than RT protein in infectious virions. FV initially
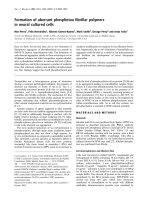
Immunoblot of a dilution series of recombinant Gag and Pol proteins, a cellular lysate (C), and extra-cellular virus (V) detected with the MABs SGG1 (Gag), 15E10 (RT), and 3E11 (IN)Figure 2
Immunoblot of a dilution series of recombinant Gag and Pol proteins, a cellular lysate (C), and extra-cellular virus (V) detected
with the MABs SGG1 (Gag), 15E10 (RT), and 3E11 (IN). (C) was obtained by harvesting lytically infected BHK-21 cells, and (V)
prepared by concentrating the supernatant of lytically infected cells through a sucrose cushion. On the right side the indicated
amounts of recombinant proteins, specifying FV Gag and Pol proteins as shown in Fig. 1, were mixed and loaded onto an SDS-
PAGE.
Retrovirology 2005, 2:44 />Page 5 of 7
(page number not for citation purposes)
encapsidate the 127 kD Pol precursor protein which is
cleaved into its subunits after packaging [4]. It may, there-
fore, be surprising not to find equal amounts of the two
subunits in virions. The reason for this is presently
unclear. It may be that different blotting efficiencies of the
two proteins account for differences in detectability. Alter-
natively, different amounts of RT and IN enzymes in viral
particles may be a consequence of the particular FV repli-
cation pathway. FVs reverse transcription takes place to a
significant extent in the cytoplasm before progeny virus
release [12,20,21]. The conditions of this reverse
transcription late in the replication cycle are not under-
stood. Gag gene expression appears to be required
[22,23], but complete assembly of viral capsids may be
not. While IN enzyme will be needed by the virus for the
next round of replication, the RT subunit may be dispen-
sable to the extent reverse transcription has already been
completed and there is no need for RT to be actively
encapsidated.
As detailed above, the reasons to assume that only trace
amounts of Pol protein are encased in spumaretrovirus
virions were hitherto largely theoretical. We provide here
experimental evidence that many more Pol molecules per
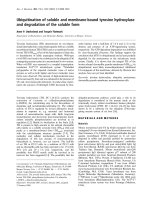
Representative example of the determination of the relative amounts of Gag and Pol proteins in purified PFVFigure 3
Representative example of the determination of the relative amounts of Gag and Pol proteins in purified PFV. (A) Extracellular
virus was centrifuged through a sucrose cushion and the sediment was loaded onto a linear iodixanol gradient. Fractions were
taken from the top and analyzed by immunoblotting with the Gag- and Pol-specific MABs. Defined amounts of recombinant
PFV Gag and Pol proteins were also loaded onto the gel and simultaneously incubated with the MAB solutions. The blot was
developed with the ECLplus reagent from Amersham-Pharmacia. (P), Pellet of the gradient. (B) Density and infectivity of the
gradient fractions shown in (A). The infectivity was determined by a blue cell assay [16].
Retrovirology 2005, 2:44 />Page 6 of 7
(page number not for citation purposes)
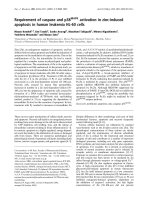
Relation of the intensities of the bands in the lanes with recombinant PFV proteins shown in Fig. 3 and amounts of protein loaded onto the gelFigure 4
Relation of the intensities of the bands in the lanes with recombinant PFV proteins shown in Fig. 3 and amounts of protein
loaded onto the gel. The latter was expressed as the number of molecules. Band intensities were determined with a LAS-3000
and calculated using the Image Gauge 3.01 software (Fujifilm). Over the protein range analyzed the band intensities were found
to be in a linear relation to the protein amounts.
Retrovirology 2005, 2:44 />Page 7 of 7
(page number not for citation purposes)
capsid can be found in purified FVs than was previously
thought, even when taking into account that we did not
determine the absolute numbers of molecules per virion,
but only the relative Gag to Pol ratios. How can this find-
ing be explained in the light of recent results in which two
distinct RNA structures were identified to be essential for
Pol protein incorporation into FV particles [4]? Firstly,
with respect to this study only the minimal RNA sequence
requirements for Pol protein encapsidation using subge-
nomic constructs have been determined, and not the rela-
tive ratios between Gag and Pol using a full-length viral
genome. Secondly, it may be that the presence of the RNA
domains, found to be responsible for Pol packaging, leads
to the encapsidation of not only two Pol molecules per
viral RNA, but of a larger complex which consists of many
more protein molecules. This complex may be stabilized
by protein-protein interactions between Pol and Gag, the
individual Pol molecules, or a combination of both.
Authors' contributions
MC performed all experiments described in this manu-
script. WR assisted in bacterial expression and purification
of recombinant proteins. The experiments were designed
and supervised by OH, DL and AR. AR wrote the manu-
script together with MC.
Acknowledgements
We are indebted to Jürgen Helbig for the determination of the IgG concen-
tration in MAB preparations.
This study was supported by grants from the DFG to A.R. (SFB479 and
RE627/6-4) and to D.L. (LI621/3-1).
References
1. Enssle J, Jordan I, Mauer B, Rethwilm A: Foamy virus reverse tran-
scriptase is expressed independently from the Gag protein.
Proc Natl Acad Sci USA 1996, 93:4137-4141.
2. Bodem J, Löchelt M, Winkler I, Flower RP, Delius H, Flügel RM:
Characterization of the spliced pol transcript of feline foamy
virus: the splice acceptor site of the pol transcript is located
in gag of foamy viruses. J Virol 1996, 70:9024-9027.
3. Yu SF, Baldwin DN, Gwynn SR, Yendapalli S, Linial ML: Human
foamy virus replication: a pathway distinct from that of ret-
roviruses and hepadnaviruses. Science 1996, 271:1579-1582.
4. Peters K, Wiktorowicz T, Heinkelein M, Rethwilm A: RNA and Pro-
tein Requirements for the Incorporation of Pol Protein into
Foamy Virus Particles. J Virol 2005, 79:7005-7013.
5. Heinkelein M, Leurs C, Rammling M, Peters K, Hanenberg H, Reth-
wilm A: Pregenomic RNA is required for efficient incorpora-
tion of pol polyprotein into foamy virus capsids. J Virol 2002,
76:10069-10073.
6. Flügel RM, Pfrepper KI: Proteolytic processing of foamy virus
Gag and Pol proteins. Curr Top Microbiol Immunol 2003, 277:63-88.
7. Rinke CS, Boyer PL, Sullivan MD, Hughes SH, Linial ML: Mutation of
the catalytic domain of the foamy virus reverse transcriptase
leads to loss of processivity and infectivity. J Virol 2002,
76:7560-7570.
8. Boyer PL, Stenbak CR, Clark PK, Linial ML, Hughes SH: Character-
ization of the polymerase and RNase H activities of human
foamy virus reverse transcriptase. J Virol 2004, 78:6112-6121.
9. Ausubel FM, Brent R, Kingston RE, Moore D, Seidman JG, Smith JA,
Struhl K: Current protocols in molecular biology. New York,
NY: John Wiley; 1987.
10. Sambrook J, Russell DW: Molecular cloning: a laboratory man-
ual. 3rd edition. Cold Spring Harbor, NY: Cold Spring Harbor Lab-
oratory Press; 2001.
11. Heinkelein M, Dressler M, Jarmy G, Rammling M, Imrich H, Thurow
J, Lindemann D, Rethwilm A: Improved primate foamy virus vec-
tors and packaging constructs. J Virol 2002, 76:3774-3783.
12. Moebes A, Enssle J, Bieniasz PD, Heinkelein M, Lindemann D, Bock M,
McClure MO, Rethwilm A: Human foamy virus reverse tran-
scription that occurs late in the viral replication cycle. J Virol
1997, 71:7305-7311.
13. Imrich H, Heinkelein M, Herchenröder O, Rethwilm A: Primate
foamy virus Pol proteins are imported into the nucleus. J Gen
Virol 2000, 81:2941-2947.
14. Holzschu DL, Delaney MA, Renshaw RW, Casey JW: The nucle-
otide sequence and spliced pol mRNA levels of the nonpri-
mate spumavirus bovine foamy virus. J Virol 1998,
72:2177-2182.
15. Orlova M, Yueh A, Leung J, Goff SP: Reverse transcriptase of
Moloney murine leukemia virus binds to eukaryotic release
factor 1 to modulate suppression of translational
termination. Cell 2003, 115:319-331.
16. Schmidt M, Rethwilm A: Replicating foamy virus-based vectors
directing high level expression of foreign genes. Virology 1995,
210:167-178.
17. Hooks JJ, Gibbs CJ Jr: The foamy viruses. Bacteriol Rev 1975,
39:169-185.
18. Gelderblom H, Frank H: Spumavirinae. In Animal Virus Structure Vol-
ume 3. Edited by: Nermut MV, Steven AC. Amsterdam, New York,
Oxford: Elsevier; 1987:305-311.
19. Vogt VM: Retroviral virions and genomes. In Retroviruses Edited
by: Coffin JM, Hughes SH, Varmus HE. Cold Spring Harbor: Cold
Spring harbor Laboratory Press; 1997:27-69.
20. Roy J, Rudolph W, Juretzek T, Gärtner K, Bock M, Herchenröder O,
Lindemann D, Heinkelein M, Rethwilm A: Feline foamy virus
genome and replication strategy. J Virol 2003, 77:11324-11331.
21. Yu SF, Sullivan MD, Linial ML: Evidence that the human foamy
virus genome is DNA. J Virol 1999, 73:1565-1572.
22. Enssle J, Fischer N, Moebes A, Mauer B, Smola U, Rethwilm A: Car-
boxy-terminal cleavage of the human foamy virus Gag pre-
cursor molecule is an essential step in the viral life cycle. J
Virol 1997, 71:7312-7317.
23. Heinkelein M, Pietschmann T, Jarmy G, Dressler M, Imrich H, Thurow
J, Lindemann D, Bock M, Moebes A, Roy J, et al.: Efficient intracel-
lular retrotransposition of an exogenous primate retrovirus
genome. 2000, 19:3436-3445.
Table 1: Relative amounts of Gag and Pol proteins in foamy viruses
pr71/p68
Gag
:p85
RT
p68
Gag
:p85
RT
Pr71/p68
Gag
:p40
IN
p68
Gag
:p40
IN
p68
Gag
:pr71
Gag
Mean 15.8 : 1 12.3 : 1 9.8 : 1 7.8 : 1 4.2 : 1
SD
1
5.6 4.8 7.8 6.9 2.0
Maximum 26.3 : 1 22.7 : 1 41.3 : 1 35.8 : 1 8.0 : 1
Minimum 6.8 : 1 5.2 : 1 3.0 : 1 2.3 : 1 1.3 : 1
1
SD, standard deviation