Bóa cáo y học: "Estimating the cost of cervical cancer screening in five developing countries" docx
Bạn đang xem bản rút gọn của tài liệu. Xem và tải ngay bản đầy đủ của tài liệu tại đây (401.58 KB, 17 trang )
BioMed Central
Page 1 of 17
(page number not for citation purposes)
Cost Effectiveness and Resource
Allocation
Open Access
Research
Estimating the cost of cervical cancer screening in five developing
countries
Jeremy D Goldhaber-Fiebert* and Sue J Goldie
Address: Program in Health Decision Science, Harvard School of Public Health, Harvard University, 718 Huntington Avenue, Boston, MA, 02115,
USA
Email: Jeremy D Goldhaber-Fiebert* - ; Sue J Goldie -
* Corresponding author
Abstract
Background: Cost-effectiveness analyses (CEAs) can provide useful information to policymakers
concerned with the broad allocation of resources as well as to local decision makers choosing
between different options for reducing the burden from a single disease. For the latter, it is
important to use country-specific data when possible and to represent cost differences between
countries that might make one strategy more or less attractive than another strategy locally. As
part of a CEA of cervical cancer screening in five developing countries, we supplemented limited
primary cost data by developing other estimation techniques for direct medical and non-medical
costs associated with alternative screening approaches using one of three initial screening tests:
simple visual screening, HPV DNA testing, and cervical cytology. Here, we report estimation
methods and results for three cost areas in which data were lacking.
Methods: To supplement direct medical costs, including staff, supplies, and equipment
depreciation using country-specific data, we used alternative techniques to quantify cervical
cytology and HPV DNA laboratory sample processing costs. We used a detailed quantity and price
approach whose face validity was compared to an adaptation of a US laboratory estimation
methodology. This methodology was also used to project annual sample processing capacities for
each laboratory type. The cost of sample transport from the clinic to the laboratory was estimated
using spatial models. A plausible range of the cost of patient time spent seeking and receiving
screening was estimated using only formal sector employment and wages as well as using both
formal and informal sector participation and country-specific minimum wages. Data sources
included primary data from country-specific studies, international databases, international prices,
and expert opinion. Costs were standardized to year 2000 international dollars using inflation
adjustment and purchasing power parity.
Results: Cervical cytology laboratory processing costs were I$1.57–3.37 using the quantity and
price method compared to I$1.58–3.02 from the face validation method. HPV DNA processing
costs were I$6.07–6.59. Rural laboratory transport costs for cytology were I$0.12–0.64 and
I$0.14–0.74 for HPV DNA laboratories. Under assumptions of lower resource efficiency, these
estimates increased to I$0.42–0.83 and I$0.54–1.06. Estimates of the value of an hour of patient
time using only formal sector participation were I$0.07–4.16, increasing to I$0.30–4.80 when
informal and unpaid labor was also included. The value of patient time for traveling, waiting, and
attending a screening visit was I$0.68–17.74. With the total cost of screening for cytology and HPV
Published: 03 August 2006
Cost Effectiveness and Resource Allocation 2006, 4:13 doi:10.1186/1478-7547-4-13
Received: 24 April 2006
Accepted: 03 August 2006
This article is available from: />© 2006 Goldhaber-Fiebert and Goldie; licensee BioMed Central Ltd.
This is an Open Access article distributed under the terms of the Creative Commons Attribution License ( />),
which permits unrestricted use, distribution, and reproduction in any medium, provided the original work is properly cited.
Cost Effectiveness and Resource Allocation 2006, 4:13 />Page 2 of 17
(page number not for citation purposes)
DNA testing ranging from I$4.85–40.54 and I$11.30–48.77 respectively, the cost of the laboratory
transport, processing, and patient time accounted for 26–66% and 33–65% of the total costs. From
a payer perspective, laboratory transport and processing accounted for 18–48% and 25–60% of
total direct medical costs of I$4.11–19.96 and I$10.57–28.18 respectively.
Conclusion: Cost estimates of laboratory processing, sample transport, and patient time account
for a significant proportion of total cervical cancer screening costs in five developing countries and
provide important inputs for CEAs of alternative screening modalities.
Background
Cervical cancer disproportionately affects women in
developing countries [1]. Unlike most cancers, cervical
cancer is preventable through cytologic screening pro-
grams that detect and treat precancerous lesions. In coun-
tries that have been able to achieve broad screening
coverage at frequent intervals, mortality from cervical can-
cer has decreased considerably [2-7]. However, in the
majority of low-income countries, cytologic screening has
proven difficult to sustain, in large part because of its reli-
ance on highly trained cytotechnologists, high-quality
laboratories, and an infrastructure to support up to 3 visits
for screening, colposcopic evaluation of abnormalities,
and treatment.
Several factors have led to an expansion of the options for
cervical cancer control. First, the availability of reliable
HPV DNA assays has led to numerous studies document-
ing its higher sensitivity for detecting precancerous lesions
compared with a single cytology test. Second, recent stud-
ies suggest that alternate screening strategies that use HPV
DNA testing or simple visual screening methods may be
more practical in some areas of the world [8-19]. Third,
regardless of initial screening test (e.g., cervical cytology,
HPV DNA testing, simple visual screening), strategies that
enhance the linkage between screening and treatment,
and seek to minimize loss to follow-up, have the best
chance of measurable success [16,20]. Additionally, eco-
nomic evaluations of these alternatives have concluded
that they are promising [21-23].
Screening alternatives rely on different levels and types of
resources such as laboratory infrastructure, staff mix, and
clinical visits. These differences have important implica-
tions for the magnitude of the actual, total screening cost
for each woman. Most importantly, they are not captured
in the simple "assay cost" of each alternative – the staff
time, supplies and equipment needed to collect a cervical
sample. Furthermore, such differences can be magnified
by country-specific characteristics such as population den-
sity, availability of staff and facilities, and topography.
Therefore, cost-effectiveness results in one country may
differ from those in another country.
We conducted a cost-effectiveness analysis of screening
strategies in India, Kenya, Peru, South Africa, and Thai-
land [24]. For this analysis, it was necessarily to estimate
the costs of delivering cervical cancer screening to a popu-
lation of eligible women in each country. We estimated
costs using resource quantities and prices actually experi-
enced in these five countries when available, relying on
expert opinion to standardize assumptions on resource
quantities, useful life of equipment, and programmatic
costs that could be realistically expected in national-level
screening programs.
We identified three areas for which cost data were unavail-
able, and for which country-specific characteristics
seemed particularly important to reflect. These included
the cost of laboratory processing of cervical samples; the
cost of transporting cervical samples from clinical sites to
the laboratory; and the value of patient time traveling,
waiting, and receiving care. We supplemented limited pri-
mary cost data in these three areas by developing alterna-
tive estimation methods. These estimation methods were
then used in a CEA of alternative cervical cancer screening
approaches based on three different initial screening tests:
simple visualization methods, HPV DNA testing, and cer-
vical cytology.
Methods
To estimate the costs associated with screening, we
adhered to the general guidelines recommended for per-
forming cost-effectiveness analyses [25-28]. A societal per-
spective was adopted to estimate all costs associated with
screening regardless of to whom each cost accrued. We
included direct medical costs of screening, including staff,
supplies, equipment, and facilities. We also included
direct non-medical costs including patient time and trans-
port involved in receiving care. In addition to estimates
from a societal perspective, relevant costs were also esti-
mated from a public health system payer perspective,
focusing on laboratory transport and processing in rela-
tionship to the other direct medical costs involved in
screening.
Cost estimates for three cervical cancer screening technol-
ogies – cervical cytology; HPV DNA testing with Hybrid
Capture 2; and simple visual screening – were required
Cost Effectiveness and Resource Allocation 2006, 4:13 />Page 3 of 17
(page number not for citation purposes)
(Table 1). However, because the focus of this analysis is
largely laboratory transport and processing, we only pro-
vide laboratory-related cost estimates for cervical cytology
and HPV DNA testing.
First, all activities associated with each screening technol-
ogy were identified. Then, for each activity, we identified
all resources used. Resources were categorized as either
direct medical or direct non-medical. Direct medical
resource inputs included staff time, disposable supplies,
equipment and facilities depreciation used both for the
collection of cervical samples as well as for the transport
and laboratory processing of these samples. Direct non-
medical resource inputs included patient transportation
from home to the site where cervical samples were col-
lected as well as patient time spent traveling, waiting, and
interacting with medical staff.
Unit cost data for each resource type were compiled.
Because these unit costs were derived from more than one
year, country-specific deflators were used to adjust all
costs to constant year 2000 terms [29]. Inflation adjust-
ment was carried out prior to conversion of costs from
local currency units to common currency units. To aid in
cross-country comparability Purchasing Power Parity
(PPP) exchange rates were used to convert costs expressed
in year 2000 local currency units to year 2000 interna-
tional dollars (I$) [27]. It was assumed that in the short
term, equipment and supplies requiring complex manu-
facturing processes would be acquired on the interna-
tional market and would be imported for use in a
country's screening program, potentially as part of an
international donor program.
The quantity of each resource was multiplied by its associ-
ated unit cost. These results were then summed to esti-
mate the total cost of screening as well as the cost of each
component.
Data sources
Demonstration projects from five countries provided pri-
mary data on screening activities, resource categories,
resource quantities, and unit costs. For staff costs, country-
specific data from hospital and national salary scales for
categories of health personnel were used.
An expert panel was provided with the primary cost and
resource data from all countries and consulted to produce
a standardized list of resource types and quantities that
reflected the expected usage patterns for national screen-
ing programs [30]. Experts also provided the type and cost
of laboratory equipment, the equipment's useful life, and
level of productivity of laboratory staff for both cervical
cytology and HPV DNA testing using Hybrid Capture 2.
Table 1: Description of Screening Technologies
Screening Technology Test Performance (1) Description
Simple Visual Screening Sensitivity: 67–79%
Specificity: 49–86%
• Uses acetic acid to reveal acetowhite lesions
• For abnormal results, some advocate use with immediate cryotherapy – "see and treat" in a
single visit
• Does not require special sample collection or laboratory processing equipment
• Low level health personnel can be trained to perform
• Personnel require supervision and retraining to maintain test performance
• Quality Assurance/Quality Control difficult to assess
• Generally requires 1–2 patient visits before treatment
Cervical Cytology Sensitivity: 47–62%
Specificity: 60–95%
• Cervical smear taken and then sample prepared on slides or in liquid media for transport
• Because sample is generally examined in a laboratory, more than one patient visit may be
required prior to treatment
• Sample collection equipment is minimal, but some laboratory equipment required
• Laboratory processing requires trained cytotechnicians and cytopathologists
• Human evaluation of samples requires supervision and retraining to maintain test performance
• Established Quality Assurance/Quality Control methods exist
• Generally requires 3 patient visits before treatment
HPV DNA Testing with
Hybrid Capture 2
Sensitivity: 66–100%
Specificity: 61–96%
• Cervical sample taken and prepared for transport
• Because sample is generally tested in a laboratory, more than one patient visit may be required
prior to treatment
• Sample collection kit and laboratory equipment required
• Laboratory processing is automated requiring fewer personnel resources with less training
• Results are quantitative in nature
• Established Quality Assurance/Quality Control methods exist
• Generally requires 2–3 patient visits before treatment
(1) Sankaranarayanan 2005
Cost Effectiveness and Resource Allocation 2006, 4:13 />Page 4 of 17
(page number not for citation purposes)
We identified three areas for which primary data collected
from in-country demonstration projects were more diffi-
cult to generalize. These included: (1) costs associated
with laboratory processing of samples for either cervical
cytology or HPV DNA testing using Hybrid Capture 2; (2)
costs associated with transporting laboratory samples
from the site of collection to the laboratory for processing;
(3) costs of women's time traveling to and from the site of
service delivery, waiting for service delivery, and receiving
the service. For each of these areas, alternate estimation
methods were employed.
Laboratory sample processing
To estimate the cost of laboratory sample processing, we
took a detailed quantity-and-price approach for cervical
cytology and HPV DNA laboratory sample processing.
Simple visual screening did not require samples from the
initial screening visit to be processed in a laboratory, and
thus no estimate of this type of laboratory processing costs
was made for simple visual screening.
Staff requirements, productivity levels, and equipment
depreciation were estimated by an expert panel who had
significant experience with implementing cervical cancer
screening and in developing country healthcare provided
input on laboratory processing [30]. Staff costs were based
on country-specific data from hospital and national salary
scales. Supply and equipment costs were estimated using
primary data in the five countries as well as international
price data (Digene Corporation, Gaithersburg, MD, USA,
2000). For all equipment depreciation, we used straight-
line depreciation discounting with a 3% discount rate and
assumed no end-term resale value [28].
Because laboratory sample processing is relatively com-
plex and certain elements such as facilities costs are diffi-
cult to estimate without detailed information from
established laboratories in each country, we compared the
detailed quantity-and-price approach to a previously pub-
lished analysis of US-based cervical cytology laboratory
costs. We modified the method used in the previously
published analysis to provide comparative, country-spe-
cific estimates based on productivity levels for cytotechni-
cians and cytopathologists, simplified facilities costs, and
a lump sum disposable supply cost for the five countries
of interest [31]. To estimate facilities costs we compared
the ratio of general per-meter facilities costs in each of the
five countries with those of the US and used these ratios
to form five multipliers [27]. Then, after adjusting the US-
based analysis's detailed estimate of facilities costs for
inflation, we used the five multipliers to estimate facilities
costs in each of the five countries [31]. This method
required wage rates for laboratory technicians and pathol-
ogists, productivity levels for technicians, expected abnor-
mal sample rate and negative review, facilities
requirements, and lump-sum supplies costs. Because pro-
ductivity levels in this method were not assumed to differ
between countries, cost variation was due to differences in
the input costs necessary to achieve the target productivity
level. Since the validation exercise makes specific produc-
tivity assumptions, it also allows for direct estimates of
annual sample processing capacities for each type of labo-
ratory.
Because cytology laboratories rely more heavily on
human productivity than on automated processing equip-
ment and HPV DNA laboratories rely more heavily on
automated processing equipment than human productiv-
ity, we performed a sensitivity analysis on our estimates in
which we varied the staff productivity assumptions from
33–200% for cytology laboratories and the equipment
costs between 33–200% for HPV DNA laboratories.
Laboratory sample transport
We used the laboratory sample processing capacity esti-
mates for each type of laboratory as an input for estimat-
ing the cost of laboratory sample transport, with the
exception of simple visual screening which does not rou-
tinely require laboratory processing of samples collected
at the initial screening visit.
We used a spatial model to estimate transport costs. Based
on a country's land area, population size, population
structure, and percent rural population, we estimated the
density of screen-eligible women. In this case, we wished
to estimate the average, rural density of 35 year-old
women because this was the target screening group for
each year (Figure 1) [32,33]. We assumed that the rural
population was uniformly and regularly distributed over
the country's land area.
For a laboratory functioning at a particular capacity level,
we then determined the size of the area serviced by the
lab:
Each laboratory is assumed to serve all eligible individuals
within a laboratory area. All laboratory areas taken
together form a Voronoi diagram of a country's land area
with each laboratory at the center of a specific Voronoi cell
[34]. Within each laboratory area, the driving path for lab-
oratory transport is assumed to originate at the laboratory,
travel away from the center until it reaches a distance of
half the radius of the lab area, follow a circle of half the
radius of the lab area to collect samples from primary clin-
RuralDensityScreenEligibles
Population EligibleAge Rural
=
*%*%
LLandArea
LabArea
AnnualSamples Capacity
RuralDensityScreenEligibles
=
*%
Cost Effectiveness and Resource Allocation 2006, 4:13 />Page 5 of 17
(page number not for citation purposes)
ics, and return to the laboratory in the center. The length
of the path driven is then:
The time spent driving this route was estimated by using
percentage paved and unpaved roads in each country as
well as the average speed driven on paved and unpaved
roads [35,36].
Four costs were calculated for laboratory transport. Two
were derived from the estimates.
Additionally, vehicle maintenance was based on WHO-
CHOICE data, and straight line depreciation of the initial
vehicle purchase price was performed over the useful life
of the vehicle [27]. The proportion of the time that the
vehicle was used for laboratory sample transport was esti-
mated by dividing the time spent driving the transport
route by the total time a vehicle was in use each week.
Then, vehicle maintenance costs and vehicle depreciation
were multiplied by this proportion to estimate the vehicle
costs attributable to sample transport.
The cost estimate produced by this method reflects rural
laboratory sample transport costs. To calculate national
average laboratory sample transport cost, an urban sam-
ple transport cost was estimated by multiplying the rural
transport cost an efficiency factor associated with much
higher urban population density. Then, a weighted aver-
age of these two costs was taken to produce a national
average transport cost estimate.
A plausible range for sample transport cost was based on
estimating transport costs using two alternative efficiency
assumptions. First, we generated a lower bound by assum-
ing complete efficiency – only the portion of vehicle use;
depreciation; driver time; and gasoline consumption that
were attributable to sample transport were included in the
estimate. Second, we generated an upper bound by
assuming that each driver and vehicle would sit idle when
not being used for sample transport, attributing the total
cost of driver and vehicle to sample transport.
Because the location and number of sites from which lab-
oratory samples would be collected on the driving route
was uncertain, we re-estimated our plausible range esti-
mates based on efficiently using all resources but using a
driving length that was 4 times the original length esti-
mated.
DrivingLength
LabArea
=
+
()
1
π
π
DrivingTime
DrivingLength
Paved SpeedPaved Unpaved SpeedU
=
+%* %*
nnpaved
()
DriverCostPerSample
Salary DrivingTime
NumSamplesYear
=
*
GasolineCostPerSample
Gasoline DrivingLength TripsPerYear
N
=
**
uumSamplesYear
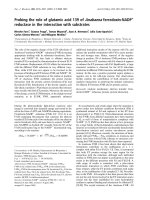
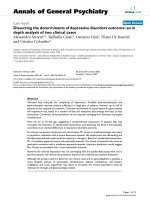
Spatial Model for Laboratory Sample Transport Cost Estima-tion*Figure 1
Spatial Model for Laboratory Sample Transport Cost
Estimation*. Panel A shows the superimposition of a uni-
form grid of polygons onto a country's land area. Each poly-
gon represents the rural area serviced by one laboratory
unit. Panel B shows that the size of each polygon is not
determined by rural population density (gray circles in left
polygon) but rather by the density of screening eligible
patients (black circles in right polygon). Panel C shows three
laboratory areas each being serviced by a laboratory (black
circle in center of each polygon). The driving route originates
in the center following the dashed line to a circle with radius
equal to half that of the polygon that visits each screening
clinic site (dashed squares) before returning to the labora-
tory at the center. *The India outline map shown in the fig-
ure was made freely available from />publications/factbook/geos/in.html; accessed: 7/22/2005
PANEL A
PANEL B
PANEL C
Cost Effectiveness and Resource Allocation 2006, 4:13 />Page 6 of 17
(page number not for citation purposes)
Value of patient time
It is difficult to estimate the value of women's time in
developing countries using conventional approaches
(e.g., average wage rates scaled by employments rates
[26]) because of high rates of female participation in
unpaid and informal labor [37]. We valued the percentage
of women's time spent in formal sector employment by
country-specific average wage rates and used country-spe-
cific minimum wage rates as proxies to value time spent
performing informal and unpaid labor [37-43].
Method 1:
proportion
formal
* wagerate
formal
Method 2:
proportion
formal
* wagerate
formal
+ proportion
informal
* wager-
ate
min
We used the two methods to form reasonable bounds for
sensitivity analyses. The first method was used to form the
lower bound because it does not value productive time
not spent in the formal sector. The second method was
used to form the upper bound because it assumes that all
potentially productive time not used in the formal sector
is used for informal or unpaid labor and further assumes
that the value of these activities is equivalent to a mini-
mum wage.
Results
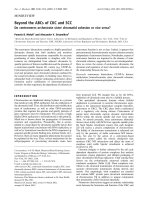
A summary of the component costs making up the total
cost of cervical cancer screening and their percentage con-
tribution to the total is shown in Figure 2. Similar esti-
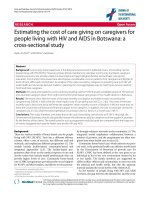
mates from a public health system payer perspective (i.e,
excluding patient time and transport) are shown in Figure
3. The direct medical costs of cervical cancer screening
with cervical cytology excluding laboratory transport and
laboratory sample processing were I$2.34, I$2.67, I$3.65,
I$16.27, and I$2.21 for India, Kenya, Peru, South Africa,
and Thailand respectively. With HPV DNA testing using
Hybrid Capture 2, these costs were I$4.22, I$5.60, I$6.21,
I$21.21, I$4.71. Based on primary data, expert opinion
on quantity, productivity, and depreciation, and interna-
tional prices, we produced detailed cost estimates of sam-
ple processing in cervical cytology laboratories and in
HPV DNA laboratories that illustrate the relative contribu-
tions of component costs. Table 2 shows staff, supply, and
equipment quantity, price, and depreciation data as well
as the resulting cost estimates. Cervical cytology is more
labor intensive, requiring a broader range and quantity of
labor inputs with less reliance on equipment. HPV DNA
laboratories rely on automated processing thus requiring
less staff, although requiring specific equipment. Because
of the uncertainty inherent in these estimates, Table 2 also
shows the effect on laboratory processing costs when staff
productivity assumptions are varied from 33% to 200%
for cytology laboratories, and the equipment costs are var-
ied from 33% to 200% for HPV DNA laboratories.
Table 3 shows the results of the validation exercise we
conducted based on a cytology laboratory cost analysis for
the United States. The total costs estimated are similar to
those in Table 2. The method used in the validation exer-
cise requires fewer assumptions about staff inputs and
productivity, does not specifically detail equipment and
depreciation, and includes facility estimates. This
approach was also used to estimate annual laboratory
sample processing capacity based on technician produc-
tivity levels. For cervical cytology laboratories, we estimate
a capacity of 28,800 samples processed per year for a lab-
oratory unit of 6 cytotechnicians and 1 cytopathologist.
For HPV DNA laboratories, we estimate a capacity of
21,600 samples processed per year for a laboratory of 1
technician and 1 pathologist.
Table 4 shows the input parameters used to calculate the
component costs of transporting laboratory samples from
the clinical collection site to the laboratory for analysis.
All parameters are derived from internationally available
data sources for a broad set of countries. Table 5 shows
that rural, per-sample transport costs vary from I$0.14–
0.74 for HPV DNA laboratories and from I$0.12–0.64
from cervical cytology laboratories. Even though the areas
served by cervical cytology laboratories are larger than the
areas served by HPV DNA laboratories due to higher sam-
ple processing capacity, the cost per sample is lower
because transports costs scale sub-linearly. The base case
represents our lower bound of sample transport costs
because it assumes efficiency of resource use for both
driver and vehicle. If, however, all laboratory transport
resources could not be used for other purposes when not
being used for cervical cytology laboratory transport, the
estimates would be between I$0.54–1.06 for HPV DNA
laboratory transport and between I$0.42–0.83 for cytol-
ogy laboratory transport. If the route the driver must take
was increased four-fold to reflect both sparse road net-
works and dispersed screening sites, the estimates for
cytology laboratory transport range from I$0.48–2.55 or
I$0.68–2.78, depending on efficiency assumptions. For
HPV DNA laboratory transport, the estimates range from
I$0.55–2.95 or I$0.84–3.51, depending on efficiency
assumptions.
Estimates of patient time value using only formal sector
wages and participation levels as well as those using
weighted averages of formal sector wages and minimum
wages are shown in Table 6. In countries such as India,
Kenya, and Peru, where formal sector participation by
Cost Effectiveness and Resource Allocation 2006, 4:13 />Page 7 of 17
(page number not for citation purposes)
Table 2: Estimates of Laboratory Resources, Productivity Levels, and Costs
India Kenya Peru South Africa Thailand Source
Cervical Cytology Laboratory
Staff
Secretary (samples/week) 600 600 600 600 600 (1)
Secretary Wage (I$/hr) 1.48 2.31 2.57 4.06 2.29 (2)
Stainer (samples/week) 1,200 1,200 1,200 1,200 1,200 (1)
Stainer Wage (I$/hr) 1.48 2.31 2.57 4.06 2.29 (2)
Prep Tech (samples/week) 400 400 400 400 400 (1)
Prep Tech Wage (I$/hr) 1.65 n/a 2.57 4.29 2.29 (2)
Cytotechnician (samples/week) 200 200 200 200 200 (1)
Cytotechnician Wage (I$/hr) 2.47 n/a 5.65 5.71 3.48 (2)
Senior Cytotechnologist (samples/week) 1,200 1,200 1,200 1,200 1,200 (1)
Senior Cytotechnologist Wage (I$/hr) 4.94 5.39 12.52 14.24 4.25 (2)
Cytopathologist (samples/week) 1,200 1,200 1,200 1,200 1,200 (1)
Cytopathologist Wage (I$/hr) 8.23 11.55 12.92 18.09 5.97 (2)
Equipment
Microscope (I$) 7,000 7,000 7,000 7,000 7,000 (1)
Microscopy Annuity Factor 2.8286 2.8286 2.8286 2.8286 2.8286 (1)
Cost Estimate
Staff Costs (I$) 1.25 1.35 2.49 3.05 1.49
Equipment/Supplies Costs (I$) 0.32 0.32 0.32 0.32 0.32
Total Cost 1.57 1.67 2.81 3.37 1.81
Total Cost (productivity 33%, equipment 100%) 2.82 3.02 5.30 6.42 3.30
Total Cost (productivity 200%, equipment 100%) 0.73 0.76 1.14 1.32 0.81
HPV DNA Laboratory
Staff
Secretary (samples/week) 450 450 450 450 450 (1)
Secretary Wage (I$/hr) 1.48 2.31 2.57 4.06 2.29 (2)
Lab Tech (samples/week) 450 450 450 450 450 (1)
Lab Tech Wage (I$/hr) 2.14 2.77 5.65 4.32 3.48 (2)
Pathologist (samples/week) 4,500 4,500 4,500 4,500 4,500 (1)
Pathologist Wage (I$/hr) 8.23 11.55 12.92 18.09 5.97 (2)
Supplies
HPV Kit (I$) 5.33 5.33 5.33 5.33 5.33 (3)
Equipment
HPV Equipment (including Microplate Luminometer) (I$) 35,000 35,000 35,000 35,000 35,000 (1)
HPV Equipment annuity factor 4.5797 4.5797 4.5797 4.5797 4.5797 (1)
Pipette Tips/Multichannel racks (I$) 1,800 1,800 1,800 1,800 1,800 (1)
Pipette Tips/Multichannel racks annuity factor 2.8286 2.8286 2.8286 2.8286 2.8286 (1)
Cost Estimate
Staff Costs (I$) 0.39 0.55 0.85 0.91 0.57
Equipment/Supplies Costs (I$) 5.68 5.68 5.68 5.68 5.68
Total Cost 6.07 6.23 6.53 6.59 6.25
Total Cost (productivity 100%, equipment 200%) 11.76 11.92 12.22 12.28 11.94
Total Cost (productivity 100%, equipment 33%) 2.27 2.43 2.73 2.79 2.45
(1) Expert Panel standardization assumptions; (2) Primary country-specific data from national pay scales and demonstration projects; (3)
International price for public sector developing countries from Digene Corporation
Cost Effectiveness and Resource Allocation 2006, 4:13 />Page 8 of 17
(page number not for citation purposes)
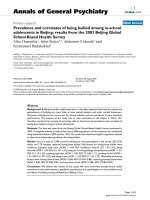
Screening Cost Components (Totals and Proportions) from a Societal PerspectiveFigure 2
Screening Cost Components (Totals and Proportions) from a Societal Perspective. Panel A shows the component
cost estimates for staff (dark blue), supplies, equipment, and facilities (light blue), laboratory processing (yellow), laboratory
transport (orange), patient time (red), and patient transport (gray) for both cervical cytology and HPV DNA testing in India,
Kenya, Peru, South Africa, and Thailand. Panel B shows these same cost components as proportions of the total cost.
PANEL A
0.00
10.00
20.00
30.00
40.00
50.00
60.00
Cytology HPV Cytology HPV Cytology HPV Cytology HPV Cytology HPV
India Kenya Peru South Africa Thailand
Country, Screening Test
Cost (I$)
Staff Supplies, Equipment, Facilities Laboratory Laboratory Transport Patient Time Patient Transport
PANEL B
0%
20%
40%
60%
80%
100%
Cytology
HPV
Cytology
HPV
Cytology
HPV
Cytology
HPV
Cytology
HPV
India Kenya Peru South Africa Thailand
Country, Screening Test
Percentage of Total Cost
Staff Supplies, Equipment, Facilities Laboratory Laboratory Transport Patient Time Patient Transport
Cost Effectiveness and Resource Allocation 2006, 4:13 />Page 9 of 17
(page number not for citation purposes)
women is low, the differences in estimated patient time
value between the two methods is greater than 50%.
Discussion
The cost of laboratory processing, laboratory sample
transport, and patient time accounted for 51%, 42%,
26%, 53%, and 66% of the total direct medical and non-
medical costs of cervical cytology for India, Kenya, Peru,
South Africa, and Thailand. For HPV DNA testing using
Hybrid Capture 2, these percentages were 62%, 48%,
33%, 51%, and 65%. From a public health system payer
perspective, with no patient time or patient transport costs
included, laboratory processing and sample transport
were 43%, 44%, 45%, 18%, and 48% of total direct med-
ical costs for cervical cytology and 60%, 55%, 52%, 25%,
and 58% of total direct medical costs for HPV DNA testing
using Hybrid Capture 2 respectively.
The estimates presented in this paper differ slightly from
those used in our previous paper primarily because we
have updated and expanded the estimation methods and
sensitivity analyses used to consider cervical cancer
screening costs [24].
Cost-effectiveness analyses (CEAs) are increasingly used
to assess the value provided by health care interventions
for a given level of spending. Yet, it is difficult to evaluate
the cost-effectiveness of delivering services that have not
been previously implemented within a country, in part
because real-world cost data on program implementation
is lacking. Using only selected direct medical costs for
which data is available – the "assay cost" – may lead to
invalid cost estimates that exclude potentially important
components. From a societal perspective, we believe that
the three additional costs components estimated in this
analysis account for between 26% and 66% of the per-
patient cost of cervical cancer screening visits in India,
Kenya, Peru, South Africa and Thailand. By varying
assumptions in the estimation techniques it was possible
to generate plausible ranges of costs useful for sensitivity
analyses.
The quantity and price approach for estimating the cost of
cervical cytology laboratory sample processing was gener-
ally consistent with estimates from our face validity exer-
cise. The methods differed in two important ways. First,
the quantity and price approach did not have sufficient
data to estimate actual facilities costs associated with lab-
oratory activity, whereas the method used for the valida-
tion exercise uses the average facilities cost within a given
country as a proxy. Second, the productivity assumptions
in the quantity and price approach are more modest than
in the latter. In this case, while facility cost inclusion tends
to make estimates obtained with the quantity and price
approach lower, the difference in productivity assump-
tions has the opposite effect. Hence, the overall quantity
and price estimates are similar to those obtained from the
validation exercise.
Limitations of the laboratory sample processing estimates
include their reliance on expert opinion as opposed to
directly observed data in each country of interest. Second,
Table 3: Estimate Validation: Laboratory Resources, Productivity Levels, and Costs
India Kenya Peru South Africa Thailand Sources
Cytology Laboratory Inputs
Cytotechnician Salary (I$/hr) 2.47 3.48 5.65 5.71 3.48 (1)
Cytopathologist Salary (I$/hr) 8.23 11.55 12.92 18.09 5.97 (1)
Cytotechnician slides per hour 2.5 2.5 2.5 2.5 2.5 (2)
Cytopathologist slide review time (hr) 0.067 0.067 0.067 0.067 0.067 (2)
Abnormal slide (%) 0.120 0.120 0.120 0.120 0.120 (2)
Normal slides reviewed (%) 0.100 0.100 0.100 0.100 0.100 (2)
Square meter per laboratory 77.78 77.78 77.78 77.78 77.78 (2)
Facility cost per square meter ratio with US cost as base 0.057 0.025 0.091 0.041 0.030 (3)
Facility cost per year (I$) 6,735 2,925 10,765 4,875 3,540
Samples processed per year 28,800 28,800 28,800 28,800 28,800
Cost of supplies (I$) 0.25 0.25 0.25 0.25 0.25 (2)
Cost Estimate
Staff Costs 1.10 1.55 2.40 2.53 1.47
Facilities, Equipment, and Supplies Costs 0.48 0.35 0.62 0.42 0.37
Total Cost 1.58 1.90 3.02 2.95 1.84
(1) Primary country-specific data from national pay scales and demonstration projects; (2) Expert Panel standardization assumptions and Bishop's
US cytology estimation method; (3) Expert Panel standardization assumptions, WHO-CHOICE data, and Bishop's US cytology estimation method
Cost Effectiveness and Resource Allocation 2006, 4:13 />Page 10 of 17
(page number not for citation purposes)
the estimates depend on a particular set of technologies
being used. For example, automation of slide reading for
cervical cytology would introduce larger equipment and
supply costs but would also reduce staff costs and change
the capacity of the laboratory. Such a change would
require a revised assessment of sample processing costs.
Finally, costs of certain inputs were assumed to be equal
to international market prices. Were these inputs to be
produced locally, their value, as measured by their oppor-
tunity cost, could be different.
In areas where population density was lowest and paved
road networks were scarcest, our estimates of laboratory
sample transport costs were highest. Because the labora-
tory units we considered for processing cervical cytology
samples were larger than those used to process HPV DNA
samples, the per-sample cost of transport was lower for
cervical cytology laboratories. Since major resource inputs
such as gasoline and vehicle depreciation were interna-
tionally traded goods, their relative costs in different
countries had less impact on cost estimates than did the
density of road networks and the rural population. Plau-
sible bounds on laboratory sample transport costs were
constructed by assuming resources were arbitrarily divisi-
ble – that their remainders could be used efficiently for
other purposes – or that resources had to be consumed in
whole quantities – that their remainders could not be
used efficiently for other purposes.
Limitations of the laboratory sample transport estimates
include a reliance on national averages for road network
density and rural population density. Additionally,
changes in elevation and natural obstacles such as the
Peruvian Andes affect the estimates of transport distance
and time in important ways. While refinement of esti-
mates through the use of provincial data and geographic
information system (GIS) data may be desirable, a trade-
off exists between the accuracy of estimates and the ability
to form comparable estimates for multiple developing
countries without additional costly data gathering efforts.
Table 4: Rural Laboratory Sample Transport Parameters
India Kenya Peru South Africa Thailand Sources
Total Population 1,002,708,291 30,310,235 27,012,899 42,351,345 62,352,043 (1)
Women 35–39 32,872,209 660,717 867,291 1,420,154 2,557,418 (2)
Percent of Women Age 35 0.656 0.436 0.642 0.671 0.820
Land Area (sq km) 2,973,190 569,140 1,280,000 1,221,040 510,890 (1)
Rural Population (% of total) 72.343 66.631 27.232 43.132 80.171 (1)
Roads, total network (km) 3,319,644 63,941.5 72,900 362,099 64,600 (1)
Roads, paved (% of total roads) 45.7 12.1 12.8 20.3 97.5 (1)
Annual HPV DNA Samples processed by HPV Lab equivalent
per year
21,600 21,600 21,600 21,600 21,600
Samples processed by Cytology Lab equivalent per year 28,800 28,800 28,800 28,800 28,800
Average speed on Paved Road (km/hr) 90 90 90 90 90 (3)
Average speed on Unpaved Road (km/hr) 45 45 45 45 45 (3)
Driver Yearly Salary (I$) 6,675.33 10,661.03 2,665.93 10,661.03 3,881.02 (4)
Work Hours Per Year 2,300 2,400 2,400 2,100 2,500 (4)
Gasoline Cost per km (I$) 0.12 0.12 0.1 0.12 0.11 (4)
Monthly Maintenance (I$) 250.65 250.65 250.65 250.65 250.65 (4)
Cost of Vehicle (I$) 19,935.33 19,935.33 19,935.33 19,935.33 19,935.33 (4)
Depreciation Annuity Factor 7.7861 7.7861 7.7861 7.7861 7.7861 (4)
Cervical Cytology Laboratory
Density of Screen Eligible Women (per sq km) 1.600 0.155 0.037 0.100 0.802
Lab Area (sq km) 17,994.517 186,148.471 780,578.700 286,901.656 35,895.338
Driving Length (km) 313.446 1,008.143 2,064.433 1,251.581 442.702
Driving Time (hrs) 5.374 21.048 42.940 24.990 5.042
HPV DNA Laboratory
Density of Screen Eligible Women (per sq km) 1.600 0.155 0.037 0.100 0.802
Lab Area (sq km) 13,495.888 13,9611.353 585,434.025 215,176.242 26,921.504
Driving Length (km) 271.452 873.078 1,787.851 1,083.901 383.391
Driving Time (hrs) 4.654 18.228 37.187 21.642 4.366
(1) World Bank's World Development Indicators; (2) US Census Bureau's International Data Base – country-specific estimates; (3) International
Center for Tropical Agriculture and World Bank; (4) WHO-CHOICE
Cost Effectiveness and Resource Allocation 2006, 4:13 />Page 11 of 17
(page number not for citation purposes)
Table 5: Rural Laboratory Transport Costs: Base Case and Efficiency Sensitivity Analyses
India Kenya Peru South Africa Thailand
Resources Used Efficiently
Cervical Cytology Laboratory
Driver Cost 0.03 0.17 0.09 0.23 0.01
Gasoline Cost 0.07 0.22 0.37 0.27 0.09
Maintenance Cost 0.01 0.05 0.10 0.06 0.01
Depreciation Cost 0.01 0.04 0.08 0.06 0.01
Total Cost 0.12 0.48 0.64 0.62 0.12
HPV DNA Laboratory
Driver Cost 0.03 0.19 0.10 0.26 0.02
Gasoline Cost 0.08 0.25 0.43 0.31 0.10
Maintenance Cost 0.01 0.05 0.11 0.07 0.01
Depreciation Cost 0.01 0.05 0.10 0.06 0.01
Total Cost 0.14 0.55 0.74 0.72 0.14
Resources Used in Whole Quantities
Cervical Cytology Laboratory
Driver Cost 0.23 0.37 0.09 0.37 0.13
Gasoline Cost 0.07 0.22 0.37 0.27 0.09
Maintenance Cost 0.10 0.10 0.10 0.10 0.10
Depreciation Cost 0.09 0.09 0.09 0.09 0.09
Total Cost 0.49 0.78 0.66 0.83 0.42
HPV DNA Laboratory
Driver Cost 0.31 0.49 0.12 0.49 0.18
Gasoline Cost 0.08 0.25 0.43 0.31 0.10
Maintenance Cost 0.14 0.14 0.14 0.14 0.14
Depreciation Cost 0.12 0.12 0.12 0.12 0.12
Total Cost 0.65 1.00 0.81 1.06 0.54
Road Distance Quadrupled Resources Used Efficiently
Cervical Cytology Laboratory
Driver Cost 0.11 0.68 0.34 0.92 0.06
Gasoline Cost 0.27 0.87 1.49 1.08 0.35
Maintenance Cost 0.05 0.19 0.39 0.26 0.04
Depreciation Cost 0.04 0.16 0.33 0.22 0.04
Total Cost 0.48 1.90 2.55 2.48 0.49
HPV DNA Laboratory
Driver Cost 0.13 0.78 0.40 1.06 0.07
Gasoline Cost 0.31 1.01 1.72 1.25 0.41
Maintenance Cost 0.06 0.22 0.45 0.30 0.05
Depreciation Cost 0.05 0.19 0.38 0.25 0.04
Total Cost 0.55 2.20 2.95 2.86 0.57
Road Distance Quadrupled Resources Used In Whole Quantities
Cervical Cytology Laboratory
Driver Cost 0.23 0.74 0.37 1.11 0.13
Gasoline Cost 0.27 0.87 1.49 1.08 0.35
Maintenance Cost 0.10 0.21 0.42 0.31 0.10
Depreciation Cost 0.09 0.18 0.36 0.27 0.09
Cost Effectiveness and Resource Allocation 2006, 4:13 />Page 12 of 17
(page number not for citation purposes)
Because of this lack of data, the method's predictions have
yet to be validated against real-world costs incurred by the
operation of a laboratory transport system in a developing
country setting.
While the method assumes each laboratory unit is serv-
iced by one transport unit, existing infrastructure or
administrative considerations may make laboratory
aggregation into larger centers more appealing. While this
may lead to economies of scale for laboratory processing
costs, laboratory sample transport costs would require
new estimates. Similarly, while our estimation method
applies to transport of laboratory samples from fixed
health clinics to a centralized laboratory, some have pro-
posed the use of mobile screening clinics [44,45]. Because
mobile units transport personnel and supplies to the site
of care and carry back collected samples to centralized lab-
oratories, efficiencies may be realized in the overall cost of
transport. While we make no explicit assumptions about
other simultaneously valuable services that laboratory
transport could provide such as the transport of blood
samples or personnel, such additional services would tend
to reduce laboratory sample transport costs. While this
may indeed be valuable, mobile clinics also face the chal-
lenges related to not being in all locations at all times and
thus may face greater difficulty maintaining continuity of
care and low levels of loss to follow-up.
When informal and unpaid labor was included in the cost
of patient time, the estimate increased substantially.
Because cervical cancer screening modalities other than
single visit "see and treat" options require multiple trips to
clinical sites and potentially district hospitals, the value of
patient time traveling, waiting, and receiving care can be
substantial. This is the case because even though the per-
hour time cost is relatively low, sparse health and trans-
portation infrastructures require travel over long distances
and substantial waiting times at health facilities before
receiving care.
Limitations of our approach also include a reliance on
minimum wage scales to value unpaid and informal
labor. Minimum wages can be sector-specific and can
overstate the market value of the labor they compensate.
Additionally, we used the minimum wage for all types of
unpaid and informal labor and did not differentiate high
value from low value activities. Finally, the proportion of
time spent in the formal and informal economic sectors
was not age-specific. Thus, if the target screening popula-
tion – women from 35–40 – had a different pattern of
employment our estimate would not capture the differ-
ence.
There is little prior literature on cost estimates for labora-
tory sample processing in developing country settings. A
study of the cost-effectiveness of cervical cancer screening
in South Africa used information on laboratory costs from
the existing cervical cytology services in the country and
included additional test kit costs for HPV DNA testing
derived from the manufacturer [21]. A similar study in
Thailand provided cost estimates based on information
from the government of Thailand for various services
including laboratory processing but did not specify how
these estimates were derived for services like HPV DNA
testing that are not widely available in Thailand at present
[23]. A study of the costs and implementation of cervical
cytology in Vietnam provided primary data based esti-
mates on cervical cytology laboratory processing but did
not include sample transport nor did the data used reflect
a screening program with full national coverage [46]. A
study of the cost effectiveness of cytology-based screening
in Hong Kong reported costs including laboratory services
based on data from public and private payers [47]. A study
of the cost-effectiveness of cervical cancer screening in
Eastern European countries cited lack of data in these
countries and instead relied on cost estimates from studies
undertaken in the UK [48]. A study of the implementation
of government financed, cervical cancer screening in Bra-
zil reports that the results are cost-effective but only
describes the effectiveness that the program has achieved
[49].
No prior studies were found that directly estimated the
cost of laboratory sample transport in developing coun-
tries. The method we have employed makes a number of
simplifying assumption about population distribution,
Total Cost 0.70 2.00 2.63 2.78 0.68
HPV DNA Laboratory
Driver Cost 0.31 0.99 0.49 1.48 0.18
Gasoline Cost 0.31 1.01 1.72 1.25 0.41
Maintenance Cost 0.14 0.28 0.56 0.42 0.14
Depreciation Cost 0.12 0.24 0.47 0.36 0.12
Total Cost 0.88 2.51 3.25 3.51 0.84
Table 5: Rural Laboratory Transport Costs: Base Case and Efficiency Sensitivity Analyses (Continued)
Cost Effectiveness and Resource Allocation 2006, 4:13 />Page 13 of 17
(page number not for citation purposes)
clinic distribution, and topography. With more complete
data, our method could be extended to accommodate
these details. Depending on the nature of the additional
data, Operations Research techniques for locating new
facilities given a set of constraints including maximizing
coverage and minimizing cost or distance that have been
developed for a variety of other applications could be
applied [34]. Other work conducted by the World Bank
and the International Center for Tropical Agriculture have
evaluated rural transportation infrastructures in develop-
ing countries [36,50]. These and similar studies address
access to roads, road quality, and speed of travel on roads
which may be combined with geographic data to produce
estimates of transport costs.
The topic of valuing productive labor, especially of
women, in the informal and unpaid sector of the econ-
omy is particularly important, especially in countries
where less than half of female productive labor takes place
in the formal sector. Formalized methods do exist for esti-
mating the value of these activities [51-53]. These meth-
ods are designed to include the value of productive labor
in estimates of Gross Domestic Product and typically rely
on population sampling and use of activity diaries to pro-
vide detailed estimates of the quantity of time spent on
different activities both paid and unpaid. The value of
time spent on unpaid labor is then estimated by such
methods as ascribing formal sector wages to unpaid time
(opportunity cost approaches) or by using the price paid
in the labor market to have another person perform either
the mix of unpaid tasks or each individual task separately
(market wage approaches). As such, data requirements for
these approaches is quite high, and only limited use has
been made of these techniques in developing countries
and rural areas where the women's formal sector labor
participation is often at its lowest.
Large-scale efforts to use cost-effectiveness analysis to
assess multiple interventions for many different disease
areas have been published relatively recently [25,54,55].
The overriding goal of these efforts has been to inform
public policy decisions about the best investments in
health, and to contribute to discussions about allocation
of public funds. As such, these efforts have focused on
providing broad insight by assessing costs and benefits of
alternative investments in the context of 14 world regions
defined both geographically and in terms of mortality.
Although the general methodology is similar, our focus in
this analysis is somewhat different in that we are using
CEA to evaluate the technical efficiency of different cervical
cancer screening strategies for reducing mortality from
one disease. Our purpose is to provide information to
country-based decision makers choosing amongst a range
of options for cervical cancer screening. For this goal, it is
important to use country-specific data to the extent possi-
ble and to explicitly represent cost differences between
Table 6: Patient Time Costs in Economies with High Informal Sector Employment
India Kenya Peru South Africa Thailand Sources
Cost Inputs
Average Formal Sector Wage Rates (I$/hr) 0.48 1.94 2.26 9.90 2.59 (1)
Women's Formal Employment As Percentage of Women's Non-Agricultural
Employment
0.14 0.17 0.42 0.42 0.46 (2)
Average Minimum Wage Rate (I$/hr) 0.27 0.52 1.49 1.10 1.16 (3)
Average Hourly Time Value
Formal Sector Only Patient Time Value (I$/hr) 0.07 0.33 0.95 4.16 1.19
Weighted Average Patient Time Value (I$/hr) 0.30 0.76 1.81 4.80 1.82
Value of Time Traveling to, Waiting for, and Attending Cervical Cancer
Screening
1-way Travel Time (mins) 30 110 30 48 15 (4)
Wait Time (health clinic) (mins) 60 90 25 111 30 (4)
Appointment Time (mins) 15 15 15 15 15 (5)
Total Cost (Formal Sector Only) (I$) 0.16 1.79 1.58 15.39 1.49
Total Cost (Formal and Informal Sector) (I$) 0.68 4.12 3.02 17.76 2.28
(1) US Department of Commerce country-specific estimates; (2) International Labour Organization; (3) US Department of Labor country-specific
estimates, SalaryExpert, World Bank's World Development Indicators; (4) Primary country-specific data from demonstration projects; (5) Expert
Panel standardization assumptions
Cost Effectiveness and Resource Allocation 2006, 4:13 />Page 14 of 17
(page number not for citation purposes)
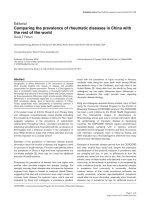
Screening Cost Components (Totals and Proportions) from a Public Health System Payer PerspectiveFigure 3
Screening Cost Components (Totals and Proportions) from a Public Health System Payer Perspective. Panel A
shows the component cost estimates for staff (dark blue), supplies, equipment, and facilities (light blue), laboratory processing
(yellow), laboratory transport (orange) for both cervical cytology and HPV DNA testing in India, Kenya, Peru, South Africa, and
Thailand. Panel B shows these same cost components as proportions of the total cost.
PANEL A
0.00
10.00
20.00
30.00
40.00
50.00
60.00
Cytology HPV Cytology HPV Cytology HPV Cytology HPV Cytology HPV
India Kenya Peru South Africa Thailand
Country, Screening Test
Cost (I$)
Staff Supplies, Equipment, Facilities Laboratory Laboratory Transport
PANEL B
0%
10%
20%
30%
40%
50%
60%
70%
80%
90%
100%
Cytology
HPV
Cytology
HPV
Cytology
HPV
Cytology
HPV
Cytology
HPV
India Kenya Peru South Africa Thailand
Country, Screening Test
Percentage of Total Cost
Staff Supplies, Equipment, Facilities Laboratory Laboratory Transport
Cost Effectiveness and Resource Allocation 2006, 4:13 />Page 15 of 17
(page number not for citation purposes)
countries that might make one strategy versus another a
more or less attractive locally (e.g., patient transport costs
and time). Accordingly, we developed methods to deal
with imperfect data availability, generating country-spe-
cific cost estimates that included important patient time
and infrastructure costs that went beyond simple assay
cost estimates.
Conclusion
When several viable interventions exist for addressing a
serious public health problem, CEA can provide one use-
ful type of information for decision makers. When pri-
mary cost data are lacking because a specific type of
program has yet to be implemented in a given country, it
is possible to use other techniques whose simplifying
assumptions allow their data requirements to be satisfied
with publicly available data. Because of the uncertainty
introduced by the simplifying assumptions, the tech-
niques can also be used to generate plausible ranges of
estimates for sensitivity analyses. In the context of cervical
cancer screening and prevention, use of these techniques
helped to quantify important component costs that influ-
enced the overall results of our cost-effectiveness analysis
in five developing countries.
Abbreviations
CEA – Cost-effectiveness analysis
DNA – Deoxyribonucleic acid
GDP – Gross Domestic Product
GIS – Geographic information system
HPV – Human papillomavirus
I$ – International Dollar
PPP – Purchasing Power Parity
UK – United Kingdoms
US – United States
WHO – World Health Organization
WHO-CHOICE – World Health Organization – Choosing
Interventions That Are Cost-Effective
Competing interests
The author(s) declare that they have no competing inter-
ests.
Authors' contributions
JDG participated in the conception and design, acquisi-
tion of data, and development of methods for the paper as
well as drafting the initial manuscript. SJG participated in
the conception and design, development of methods, and
in the critical revision of the manuscript for important
intellectual content. Both authors read and approved the
final manuscript.
Acknowledgements
This research was funded through the generous support of the Bill and
Melinda Gates Foundation. Sue J. Goldie has also received support from the
National Cancer Institute (R01 CA093435). Jeremy D. Goldhaber-Fiebert
is the recipient of the National Science Foundation's Graduate Research
Fellowship and previously of the National Library of Medicine's Doctoral
Traineeship.
The authors acknowledge the contribution of the entire Alliance for Cer-
vical Cancer Prevention; The Program for Assessment of Technology in
Health (PATH); The International Agency for Research on Cancer (IARC);
Pan-American Health Organization (PAHO); EngenderHealth; and
JHPIEGO.
They thank the anonymous referees of the manuscript for their helpful
comments and suggestions as well as Natasha Stout (Program in Health
Decision Science, Harvard University, Boston, Massachusetts) for her crit-
ical review and suggestions.
They extend thanks to the Alliance for Cervical Cancer Prevention Cost
Working Group: Thailand (JHPIEGO): P.D. Blumenthal (Johns Hopkins Uni-
versity, Baltimore, Maryland), K.K. Limpaphayom and S. Chaithongwong-
watthana (Chulalongkorn University, Bangkok, Thailand); India
(International Agency for Research on Cancer-World Health Organization
[IARC-WHO]): R. Sankaranarayanan and R. Muwonge (IARC-WHO, Lyon,
France), R. Legood (Health Economics Research Center, Oxford, England);
Kenya (Program for Appropriate Technology in Health [PATH]): V. Tsu
(PATH, Seattle, Washington), K. Lewis (Reproductive Health Strategic Pro-
gram, PATH, Seattle, Washington); South Africa (EngenderHealth): L.
Denny (Department of Obstetrics and Gynecology, University of Cape
Town, South Africa); L. Kuhn (Columbia University, New York), K. Beattie
(EngenderHealth, New York); Pan American Health Organization -WHO
[PAHO-WHO]: S. Robles, (PAHO-WHO, Washington D.C.); and J.J. Kim
(Program in Health Decision Science, Harvard University, Cambridge, Mas-
sachusetts).
A special thanks to Paul Blumenthal (Johns Hopkins University, Baltimore,
Maryland), Cedric Mahe (the International Agency for Research on Cancer-
World Health Organization, Lyon, France), Carol Levin (the Program for
Appropriate Technology in Health, Seattle, Washington), Amparo Gor-
dillo-Tobar (the Pan American Health Organization-World Health Organi-
zation, Washington, D.C.), Lynette Denny, (Department of Obstetrics and
Gynecology, University of Cape Town, South Africa), Tom Wright, (the
College of Physicians and Surgeons, Columbia University, New York),
Lynne Gaffikin, (JHPIEGO, Baltimore, Maryland), and Jane Kim (Program in
Health Decision Science, Harvard University, Boston, Massachusetts
The authors are enormously grateful to Jesse Ortendahl (Program in
Health Decision Science, Harvard University, Boston, Massachusetts) for
his thorough research assistance and exacting review.
Cost Effectiveness and Resource Allocation 2006, 4:13 />Page 16 of 17
(page number not for citation purposes)
References
1. Parkin DM, Bray F, Ferlay J, Pisani P: Global cancer statistics,
2002. CA Cancer J Clin 2005, 55:74-108.
2. Bailie RS, Selvey CE, Bourne D, Bradshaw D: Trends in cervical
cancer mortality in South Africa. Int J Epidemiol 1996,
25:488-493.
3. Bray F, Loos AH, McCarron P, Weiderpass E, Arbyn M, Moller H,
Hakama M, Parkin DM: Trends in cervical squamous cell carci-
noma incidence in 13 European countries: changing risk and
the effects of screening. Cancer Epidemiol Biomarkers Prev 2005,
14:677-686.
4. Hakama M, Hristova L: Effect of screening in the Nordic cancer
control up to the year 2017. Acta Oncol 1997, 36:119-128.
5. Hristova L, Hakama M: Effect of screening for cancer in the Nor-
dic countries on deaths, cost and quality of life up to the year
2017. Acta Oncol 1997, 36 Suppl 9:1-60.
6. Peto J, Gilham C, Fletcher O, Matthews FE: The cervical cancer
epidemic that screening has prevented in the UK. Lancet
2004, 364:249-256.
7. Robles SC, White F, Peruga A: Trends in cervical cancer mortal-
ity in the Americas. Bull Pan Am Health Organ 1996, 30:290-301.
8. Visual inspection with acetic acid for cervical-cancer screen-
ing: test qualities in a primary-care setting. University of
Zimbabwe/JHPIEGO Cervical Cancer Project. Lancet 1999,
353:869-873.
9. Belinson J, Qiao YL, Pretorius R, Zhang WH, Elson P, Li L, Pan QJ,
Fischer C, Lorincz A, Zahniser D: Shanxi Province Cervical Can-
cer Screening Study: a cross-sectional comparative trial of
multiple techniques to detect cervical neoplasia. Gynecol Oncol
2001, 83:439-444.
10. De VH, Claeys P, Njiru S, Muchiri L, Steyaert S, De SP, Van ME, Bwayo
J, Temmerman M: Comparison of pap smear, visual inspection
with acetic acid, human papillomavirus DNA-PCR testing
and cervicography. Int J Gynaecol Obstet 2005, 89:120-126.
11. Denny L, Kuhn L, Risi L, Richart RM, Pollack A, Lorincz A, Kostecki
F, Wright TC:
Two-stage cervical cancer screening: an alter-
native for resource-poor settings. Am J Obstet Gynecol 2000,
183:383-388.
12. Denny L, Kuhn L, Pollack A, Wainwright H, Wright TC: Evaluation
of alternative methods of cervical cancer screening for
resource-poor settings. Cancer 2000, 89:826-833.
13. Doh AS, Nkele NN, Achu P, Essimbi F, Essame O, Nkegoum B: Vis-
ual inspection with acetic acid and cytology as screening
methods for cervical lesions in Cameroon. Int J Gynaecol Obstet
2005, 89:167-173.
14. Goel A, Gandhi G, Batra S, Bhambhani S, Zutshi V, Sachdeva P: Visual
inspection of the cervix with acetic acid for cervical intraep-
ithelial lesions. Int J Gynaecol Obstet 2005, 88:25-30.
15. Kulasingam SL, Hughes JP, Kiviat NB, Mao C, Weiss NS, Kuypers JM,
Koutsky LA: Evaluation of human papillomavirus testing in
primary screening for cervical abnormalities: comparison of
sensitivity, specificity, and frequency of referral. JAMA 2002,
288:1749-1757.
16. Sankaranarayanan R, Gaffikin L, Jacob M, Sellors J, Robles S: A critical
assessment of screening methods for cervical neoplasia. Int J
Gynaecol Obstet 2005, 89 Suppl 2:S4-S12.
17. Schiffman M, Herrero R, Hildesheim A, Sherman ME, Bratti M,
Wacholder S, Alfaro M, Hutchinson M, Morales J, Greenberg MD,
Lorincz AT: HPV DNA testing in cervical cancer screening:
results from women in a high-risk province of Costa Rica.
JAMA 2000, 283:87-93.
18. Wright TC, Denny L, Kuhn L, Pollack A, Lorincz A: HPV DNA test-
ing of self-collected vaginal samples compared with cytologic
screening to detect cervical cancer. JAMA 2000, 283:81-86.
19. Kitchener HC, Symonds P: Detection of cervical intraepithelial
neoplasia in developing countries. Lancet 1999, 353:856-857.
20. Goldhaber-Fiebert JD, Denny LE, De SM, Wright TC, Kuhn L, Goldie
SJ: The costs of reducing loss to follow-up in South African
cervical cancer screening. Cost Eff Resour Alloc 2005,
3:11.
21. Goldie SJ, Kuhn L, Denny L, Pollack A, Wright TC: Policy analysis
of cervical cancer screening strategies in low-resource set-
tings: clinical benefits and cost-effectiveness. JAMA 2001,
285:3107-3115.
22. Legood R, Gray AM, Mahe C, Wolstenholme J, Jayant K, Nene BM,
Shastri SS, Malvi SG, Muwonge R, Budukh AM, Sankaranarayanan R:
Screening for cervical cancer in India: How much will it cost?
A trial based analysis of the cost per case detected. Int J Cancer
2005, 117:981-987.
23. Mandelblatt JS, Lawrence WF, Gaffikin L, Limpahayom KK, Lumbiga-
non P, Warakamin S, King J, Yi B, Ringers P, Blumenthal PD: Costs
and benefits of different strategies to screen for cervical can-
cer in less-developed countries. J Natl Cancer Inst 2002,
94:1469-1483.
24. Goldie SJ, Gaffikin L, Goldhaber-Fiebert JD, Gordillo-Tobar A, Levin
C, Mahe C, Wright TC: Cost-effectiveness of cervical-cancer
screening in five developing countries. N Engl J Med 2005,
353:2158-2168.
25. Hutubessy R, Chisholm D, Edejer TT: Generalized cost-effective-
ness analysis for national-level priority-setting in the health
sector. Cost Eff Resour Alloc 2003, 1:8.
26. Cost-effectiveness in health and medicine Edited by: Gold MR, Siegel JE,
Russell LB and Weinstein MC. New York, Oxford University Press;
1996.
27. World Health Organization: WHO-CHOICE 2005 [http://
www3.who.int/whosis/menu.cfm?path=evidence].
28. Drummond MF, O'Brien B, Stoddart GL, Torrance GW: Methods for
the economic evalutation of health care programmes New York, Oxford
University Press; 2001.
29. The Economist: Economic Intelligence Unity: Country Data
2005 [ />].
30. Wright TC, Blumenthal PD, Denny L: Expert Panel Consultation.
2002.
31. Bishop JW: The cost of production in cervical cytology: com-
parison of conventional and automated primary screening
systems. Am J Clin Pathol 1997, 107:445-450.
32. World Development Indicators Washington, D.C., World Bank; 2001.
33. US Census Bureau: International Data Base 2005 [http://
www.census.gov/ipc/www/idbnew.html].
34. Facility location: a survey of applications and methods Edited by: Drezner
Z. New York, Springer-Verlag; 1995.
35. World Development Indicators Washington, D.C., World Bank; 2000.
36. Nelson A: Accessibility, transport, and travel time informa-
tion. 2005 [ />2.5_web.pdf]. International Center for Tropical Agriculture. CITA
37. Women and men in the informal economy: a statistical pic-
ture 2005 [ />download/women.pdf]. International Labour Organization
38. World Development Indicators Washington, D.C., World Bank; 2003.
39. U.S. Department of Commerce 2005 [ />wages/99wages/99wages.htm].
40. U.S. Department of Labor (India Estimate) 2005 [http://
www.dol.gov/ilab/media/reports/oiea/wagestudy/FS-India.htm].
41. U.S. Department of Labor (Peru Estimate) 2005 [http://
www.dol.gov/ilab/media/reports/oiea/wagestudy/FS-Peru.htm].
42. U.S. Department of Labor (Thailand Estimate) 2005 [http://
www.dol.gov/ilab/media/reports/oiea/wagestudy/FS-Thailand.htm].
43. SalaryExpert. 2005.
44. Bailie R: An economic appraisal of a mobile cervical cytology
screening service. S Afr Med J 1996, 86:1179-1184.
45. Swaddiwudhipong W, Chaovakiratipong C, Nguntra P, Mahasakpan P,
Tatip Y, Boonmak C: A mobile unit: an effective service for cer-
vical cancer screening among rural Thai women. Int J Epide-
miol 1999, 28:35-39.
46. Suba EJ, Nguyen CH, Nguyen BD, Raab SS: De novo establishment
and cost-effectiveness of Papanicolaou cytology screening
services in the Socialist Republic of Vietnam. Cancer 2001,
91:928-939.
47. Kim JJ, Leung GM, Woo PP, Goldie SJ: Cost-effectiveness of
organized versus opportunistic cervical cytology screening
in Hong Kong. J Public Health (Oxf) 2004, 26:130-137.
48. Sherlaw-Johnson C, Gallivan S: The planning of cervical cancer
screening programmes in eastern Europe: is viral testing a
suitable alternative to smear testing? Health Care Manag Sci
2000, 3:323-329.
49. Bleggi Torres LF, Werner B, Totsugui J, Collaco LM, Araujo SR, Huc-
ulak M, Boza EJ, Fischer RM, De Laat L, Sobbania LC, Raggio A: Cer-
vical cancer screening program of Parana: cost-effective
model in a developing country. Diagn Cytopathol 2003, 29:49-54.
50. Lebo J, Schelling D: Design and appraisal of rural transport
infrastructure: ensuring basic access for rural communities.
Volume World Bank Technical Paper 496. World Bank; 2005.
Publish with Bio Med Central and every
scientist can read your work free of charge
"BioMed Central will be the most significant development for
disseminating the results of biomedical research in our lifetime."
Sir Paul Nurse, Cancer Research UK
Your research papers will be:
available free of charge to the entire biomedical community
peer reviewed and published immediately upon acceptance
cited in PubMed and archived on PubMed Central
yours — you keep the copyright
Submit your manuscript here:
/>BioMedcentral
Cost Effectiveness and Resource Allocation 2006, 4:13 />Page 17 of 17
(page number not for citation purposes)
51. Budlender D, Brauthag AL: Calculating the value of unpaid
labour: a discussion document. Statistics South Africa; 2002.
52. Cagatay N: Engendering macroeconomics and macroeco-
nomic policies. Social Development and Poverty Elimination Divi-
sion, UNDP; 1998.
53. Chadeau A: What is households' non-market production
worth? OECD Economic Studies 1992, 18:.
54. Evans DB, Edejer TT, Adam T, Lim SS: Methods to assess the costs
and health effects of interventions for improving health in
developing countries. BMJ 2005, 331:1137-1140.
55. Disease Control Priorities in Developing Countries (2nd Edi-
tion) 2006 [ />].