Báo cáo y học: "People''''s willingness to pay for health insurance in rural Vietna" potx
Bạn đang xem bản rút gọn của tài liệu. Xem và tải ngay bản đầy đủ của tài liệu tại đây (327.73 KB, 16 trang )
BioMed Central
Page 1 of 16
(page number not for citation purposes)
Cost Effectiveness and Resource
Allocation
Open Access
Research
People's willingness to pay for health insurance in rural Vietnam
Curt Lofgren*
1
, Nguyen X Thanh
2
, Nguyen TK Chuc
3
, Anders Emmelin
1
and
Lars Lindholm
1
Address:
1
Umeå International School of Public Health, Umeå University, Sweden,
2
Institute of Health Economics, Edmonton, Canada and
3
Dept.
of Health Economics, Faculty of Public Health, Hanoi Medical University, Vietnam
Email: Curt Lofgren* - ; Nguyen X Thanh - ; Nguyen TK Chuc - ;
Anders Emmelin - ; Lars Lindholm -
* Corresponding author
Abstract
Background: The inequity caused by health financing in Vietnam, which mainly relies on out-of-
pocket payments, has put pre-payment reform high on the political agenda. This paper reports on
a study of the willingness to pay for health insurance among a rural population in northern Vietnam,
exploring whether the Vietnamese are willing to pay enough to sufficiently finance a health
insurance system.
Methods: Using the Epidemiological Field Laboratory for Health Systems Research in the Bavi
district (FilaBavi), 2070 households were randomly selected for the study. Existing FilaBavi
interviewers were trained especially for this study. The interview questionnaire was developed
through a pilot study followed by focus group discussions among interviewers. Determinants of
households' willingness to pay were studied through interval regression by which problems such as
zero answers, skewness, outliers and the heaping effect may be solved.
Results: Households' average willingness to pay (WTP) is higher than their costs for public health
care and self-treatment. For 70–80% of the respondents, average WTP is also sufficient to pay the
lower range of premiums in existing health insurance programmes. However, the average WTP
would only be sufficient to finance about half of total household public, as well as private, health
care costs. Variables that reflect income, health care need, age and educational level were significant
determinants of households' willingness to pay. Contrary to expectations, age was negatively
related to willingness to pay.
Conclusion: Since WTP is sufficient to cover household costs for public health care, it depends
to what extent households would substitute private for public care and increase utilization as to
whether WTP would also be sufficient enough to finance health insurance. This study highlights
potential for public information schemes that may change the negative attitude towards health
insurance, which this study has uncovered. A key task for policy makers is to win the trust of the
population in relation to a health insurance system, particularly among the old and those with
relatively low education.
Published: 11 August 2008
Cost Effectiveness and Resource Allocation 2008, 6:16 doi:10.1186/1478-7547-6-16
Received: 7 February 2008
Accepted: 11 August 2008
This article is available from: />© 2008 Lofgren et al; licensee BioMed Central Ltd.
This is an Open Access article distributed under the terms of the Creative Commons Attribution License ( />),
which permits unrestricted use, distribution, and reproduction in any medium, provided the original work is properly cited.
Cost Effectiveness and Resource Allocation 2008, 6:16 />Page 2 of 16
(page number not for citation purposes)
Background
Health financing in Vietnam relies mainly on out-of-
pocket payments, which in 2000 were estimated to consti-
tute as much as 80% of total health care expenditure [1].
More recent estimates are somewhat lower – around two-
thirds [2]. The share of households facing catastrophic
health care expenditure may be as high as 10% [3]. In this
context, the need for furthering prepayment reform in
Vietnam has been highlighted by many, and it is the goal
of the Vietnamese government to achieve health insur-
ance coverage for all citizens by 2010 [4].
Today there are two forms of health insurance for the Viet-
namese: firstly compulsory health insurance for those that
have formal employment, which was introduced in 1993
and now covers 9% of the population; secondly, there is
voluntary health insurance, which was introduced in
1994 and now covers 11% of the population. In addition
there are two programs: Health Care Funds for the Poor,
which in 2003 replaced the Free Health Care Cards for the
Poor, and free health care for children 0–5 years of age,
which was established in 1991. Today these programs
cover 18% and 11% of the population, respectively [2,5].
This means that around half of the population today is
covered by health insurance or the two special programs.
The task now is to attain coverage for the remaining half,
which will, most likely, be a more difficult task [2,6].
This paper reports on a study of willingness to pay (WTP)
for health insurance in Bavi, a rural district in northern
Vietnam. Most of the inhabitants of Bavi are farmers who
are not covered by health insurance. To our knowledge
there is no other study of willingness to pay for health
insurance in Vietnam, and few other studies of WTP for
health care in the country; we found only one estimating
WTP for obstetric delivery preferences [7]. There are, how-
ever, a number of other studies on health insurance in
Vietnam, particularly on the effects on health care utiliza-
tion and household out-of-pocket health expenditure.
Several studies from recent years have found that volun-
tary health insurance is likely to increase considerably the
visits to health care facilities and reduce out-of-pocket
spending [8-10], whilst also leading to less self-treatment
(buying of drugs without medical advice from profession-
als) [11,12]. Compulsory insurance has been found to
increase health care utilization more than voluntary
health insurance [13], and the Health Care Fund for the
Poor also appears to increase the use of health services,
particularly inpatient care [5]. These findings are of inter-
est for our study, especially concerning the question of
whether the WTP we have estimated is sufficient to
finance viable health insurance. This is discussed below in
relation to our results.
WTP for health insurance has been studied in other devel-
oping countries, although the number of studies is rela-
tively small. In a study from a city in China, the WTP of
informal sector workers to join an existing health insur-
ance package for formal workers has been studied [14].
The average WTP was found to be higher than the cost of
expanding such an insurance system. In Burkino Faso, the
feasibility of a community-based health insurance pack-
age was studied in a rural area. Based on the WTP esti-
mates, it was found to be feasible if health service
utilization did not increase by more than 28% [15,16]. In
Ghana a WTP study of informal sector workers showed
that 64% would sign up for health insurance for a reason-
able (compared to costs) premium [17]. In Iran it was
found, based on the respondents' WTP, that the existing
health insurance system in urban areas could be intro-
duced in rural areas [18], and finally, a WTP study in a
rural area in India was used as a basis for discussing the
content of health policy reform [19]. In the absence of
WTP studies of health insurance in Vietnam, the above
studies from other countries are of interest as reference
points for our findings on the determinants of WTP. These
comparisons are made in the discussion section.
We first present the methods used, including the rationale
for using the WTP technique, the study design, the surveil-
lance system used to collect the data, hypotheses about
determinants for WTP and the method used to elicit WTP.
This is followed by discussion of the econometric method
used; due to the typical heaping of WTP answers we have
used interval regression. Results are then presented and
finally a methodological discussion, including potential
bias, and a discussion of the results and their policy impli-
cations.
Methods
It is becoming increasingly popular in health economics
to use the WTP approach to elicit the value people place
on health and health care activities [20]. In the absence of
monetary measurements of such values found on func-
tioning markets – where consumers reveal how much of
other goods they are willing to sacrifice to get a certain
product – researchers instead ask potential consumers
how much they would be willing to pay [21]. An advan-
tage of this technique is that it measures the strength of
consumer demand in monetary units, which can then be
compared to costs [22]. Respondents are presented with a
hypothetical scenario and then asked about their maxi-
mum willingness to pay for, for example, joining a health
insurance scheme. Below we present the basis for data col-
lection, followed by the design of our WTP study.
In 1999, in collaboration with Vietnamese and Swedish
public health scientists, the Epidemiological Field Labora-
tory for Health Systems Research (FilaBavi) was estab-
Cost Effectiveness and Resource Allocation 2008, 6:16 />Page 3 of 16
(page number not for citation purposes)
lished in the Bavi district of Vietnam, whose centre lies
some 60 km west of Hanoi [23]. In 1999 a baseline house-
hold survey was undertaken followed by quarterly surveil-
lance of vital events and complete re-surveys every two
years.
The Bavi district has a population of 235,000. For the sur-
veillance database a random selection of 67 out of 352
clusters was made, with probability proportional to size.
This means that we do not have to adjust for clustering
effects in the estimations.
The surveillance database includes a population of 51,024
in 11,089 households. Each cluster was based on a village
and consisted of 41 to 512 (mean 146) households with
a population of 185 to 1,944 (mean 676). The largest clus-
ters were then divided into 3, thereby in total there are 69
clusters in FilaBavi.
In 2004, 30 households were randomly selected for the
present study from each cluster in the FilaBavi surveillance
database, which gives a total of 2,070 households. Of
these, complete interviews were held within 2,063 house-
holds. The aim of this study was to interview the heads of
households only, most of which are men. In the FilaBavi
database this share is 62%. To ensure that there would be
a reasonable proportion of female respondents, house-
holds were deliberately selected for this study so that half
of the household heads would be women.
To interview only heads of households, however, turned
out to be too time consuming. Therefore, interviewers
restricted themselves to interviewing the head of the
household if this person was at home at the time of the
interview, or the spouse if the head could not be con-
tacted; in total, 51% of the respondents were heads of
households (table 1). An indicator variable has been
included in the regression models to control for possible
bias in relation to this. Of the interviewed household
heads 44% were female, but of the total number of inter-
viewees 64% were female. There is an indicator variable in
the estimations controlling for gender. However, it should
be recognized that there is a validity problem concerning
the selection of households since female-headed house-
holds may be more disadvantaged than others. This is
analyzed in the discussion section.
This is a study of household WTP, rather than individual
WTP, as the economic decision to purchase health care
among these rural and mostly farmer households is more
likely to be a household decision and not an individual
one. This is a common approach when studying rural
communities in developing countries. Of the six previ-
ously cited studies of WTP for health insurance in devel-
oping countries (other than Vietnam), four of them
estimate household WTP.
The interviewers in this study conduct regular surveys for
the FilaBavi database. They are all educated to at least high
school level and have received special training for their
task. For testing the questionnaire, in particular the sce-
narios, a pilot of 15 in-depth interviews with heads of
households outside the study sample was performed by
the researchers. The version of the questionnaire devel-
oped on that basis was then discussed in four focus groups
consisting of interviewers. The purpose of the focus
groups was for training of the interviewers and further
refining of the questionnaire. Before going to the field, the
interviewers were trained twice, using a role-play tech-
nique on how to use the questionnaires. They were strictly
supervised throughout the study period.
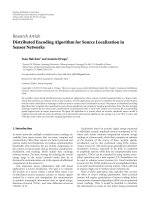
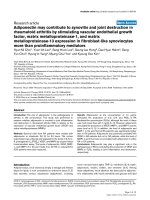
The choice set described and explained to respondents is
presented in Figure 1. It consists of three different health
Table 1: Respondent and household characteristics
Variable name Description Mean* Std.dev
Male Male = 1, female = 0 0.36
Age Age in years 44.57 13.58
Farmer Farmer = 1, all other occupations = 0 0.74
Morethanprimary More than primary education = 1, otherwise 0 0.70
Membershh Number of members in the household 4.01 1.56
Children Number of children, 0 to 5 years age, in the household 0.37 0.64
Elderly Number of persons, 65 years and older, in the household 0.32 0.58
Chronic One or more persons in the household has a chronic disease = 1, 0 otherwise 0.20
Hcneed At least one person in the household needed health care during the last year = 1, 0 otherwise 0.92
Insureexp The household has insurance (of any kind) = 1, 0 otherwise 0.18
Poor The household is classified as poor by local leaders = 1, 0 otherwise 0.11
Rich The household is classified as rich by local leaders = 1, 0 otherwise 0.16
Head The respondent is the household head = 1, 0 otherwise 0.51
*The mean value for indicator variables shows the proportion for the category which assumes the value 1. For e.g. the variable Farmer, the mean
value shows that 74% of the respondents are farmers.
Cost Effectiveness and Resource Allocation 2008, 6:16 />Page 4 of 16
(page number not for citation purposes)
care financing systems: A was an out-of-pocket model
similar to the present system in Bavi, whilst B and C had
identical benefit packages but were based on different
financing schemes. B was a compulsory health insurance
scheme based on community rating, and C was a volun-
tary scheme based on risk rating.
The three alternatives cover different financing systems for
public health care, which is obvious from the scenarios
but was also clearly pointed out to respondents. The
respondents were asked to choose which one of these
health financing systems they would prefer to have in
Bavi. All respondents (not only those that preferred B or C
respectively) were then also asked about their WTP for sys-
tem B, given that this system would be implemented in
Bavi, and similarly for system C, given that system C
would be implemented. The WTP question was of a Yes/
No nature in relation to a certain bid (insurance cost),
with a follow-up question about maximum WTP.
The bid was calculated based on another study from Fila-
Bavi [24] where the average health care costs for house-
holds within the district was estimated (table 2); in 2002
this was 520,000 VND per year, which corresponds
approximately to 45,000 VND per month. This later figure
was used as the bid given to respondents, who were asked:
Given that system B/C is chosen, would you be willing to
pay 45,000 VND per month for your household?
Respondents were then given an open question about
their maximum WTP in each system. The WTP elicited
using the above method is presented in the results section.
In the scenarios nothing was said about the respondents'
expected health-seeking behavior. According to table 2, it
Hypothetical scenariosFigure 1
Hypothetical scenarios.
A. Households pay the full cost for each visit to the Communal Health Station or District Health Centre
and for medicine prescribed by the doctor. Households that are not able to pay will not receive any
services. A service is given at cost price – there is no profit. There are no exemption cards. The total
annual cost for a household will depend on how many members will be ill and will visit the Communal
Health Station or District Health Centre during the year.
B. All households in the district are compulsory (obliged) to pay an annual premium to a local health care
fund when crops are sold. There are no exemption cards. The fee is based on how much income the
households have. The higher income, the higher the fee. Thereby all members in the household are
entitled to free health care at the Communal Health Station or District Health Centre and free medicine
if prescribed by the doctor. If care at higher levels is needed, the insured patient will be supported by an
amount based on the cost per bed day at the District Health Centre level. The fund will be managed by
the Commune People Committee (or voted representative).
C. Each household can choose to voluntarily pay an annual premium to a local health care fund when
crops are sold. The fee is based on the number of people in the household and the fee is higher for
children under five and elderly over 65 because they are expected to use more health care. All persons
in the household paying the fee are entitled to free health care at the Communal Health Station or
District Health Centre and free medicine if prescribed by the doctor. If care at higher levels is needed,
the insured patient will be supported by an amount based on the cost per bed day at the District Health
Centre level. The fund will be managed by the Commune People Committee (or voted representative).
Table 2: Average household expenditure for health care in Bavi,
July 2001 to June 2002, Vietnamese dong
for the
whole
year
%average
per
month
Public health care 129 267 25% 10 772
Commune health stations 23 698 5% 1 975
District health centres 45 621 9% 3 802
Provincial hospitals 32 508 6% 2 709
Central hospitals 26 895 5% 2 241
Others 545 0% 45
Private health care 283 342 55% 23 612
Self-treatment 60 338 12% 5 028
Total curative exp 472 947 91% 39 412
Health insurance 16 227 3% 1 352
Prevention & rehabilitation 29 317 6% 2 443
Total 518 491 100% 43 208
Source: Thuan NTB: The burden of household health care
expenditure in a rural district in Vietnam. MPH thesis. Nordic
School of Public Health, Sweden; 2002
Cost Effectiveness and Resource Allocation 2008, 6:16 />Page 5 of 16
(page number not for citation purposes)
is clear that public health care stands for less than half of
total health care expenditure in Bavi. A very large share for
private health care was also found in a nationwide study
using the Vietnam Living Standard Survey 97/98 [25]. In
the background section above studies on the effects of
health insurance in Vietnam were cited. It appears that
one can expect that a growing number of persons signing
up for health insurance will lead to increased utilization
of public health services and less self-medication – a shift
away from private to public services.
However, when presenting respondents with a WTP sce-
nario it is very important that it can be clearly understood.
We concluded that complicating the scenario by adding
information about an expected change in health-seeking
behavior would make it too complex. But this of course
leads to uncertainty when interpreting the elicited WTP, a
question addressed in the discussion section below.
In relation to this we based the bid to the respondents on
the total (public as well as private) household health care
expenditure. This includes not only curative expenditure
but also expenditure for health insurance (3%) and for
prevention and rehabilitation (6%) (table 2). The curative
expenditure includes costs for consultations, drugs and
tests and for traveling (6%) and lodging (2%) (unpub-
lished data from [24]). We wanted households to con-
sider WTP based on total health care costs although we
did not specify or point to a possible substitution of pro-
viders.
Our choice of background variables (see table 1), which
were also collected through the interviews, follow our
hypotheses about the determinants for WTP. Health
insurance demand is a function of, apart from the price of
the insurance, the respondent's degree of risk aversion,
perceived risk of injury/illness, perceived extent of the loss
caused by illness/injury, and income [26].
Using insurance theory, assuming a decreasing marginal
utility of income, it follows that the higher the degree of
risk aversion, the higher WTP will be when all else is
equal. This is also the case for the perceived extent of the
loss incurred by illness or injury. For the perceived risk of
illness or injury, however, the relationship is not this sim-
ple; for a small – and a large – risk, WTP may be relatively
small. If the risk is 1, illness will occur with certainty, and
the individual is better-off not buying insurance (includ-
ing a load factor) with a risk-rated premium. If the insur-
ance is based on community rating, this individual may
still benefit from insurance, however. We assume that the
risks perceived by the households in this study are not in
the relatively large risk segment, so that it is reasonable to
hypothesize that an increase in perceived risk, all else
being equal, leads to an increase in WTP. We also hypoth-
esize that the higher the income, the higher the WTP.
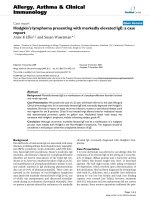
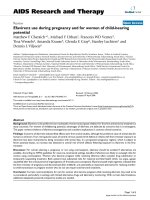
Figure 2 illustrates the hypothesized effects of the study
variables on the main determinants of WTP.
We hypothesize that five variables will affect risk aversion,
the perceived extent of the loss and the perceived risk
amongst respondents, namely; age, occupation, educa-
tional level, and the number of children and elderly in the
household. The older the respondent is, the higher the
perceived risk will be for him/her. We assume that the
degree of risk aversion increases with age, as does the per-
ceived extent of the loss. An older person has more expe-
rience and can therefore more accurately envisage the
affect of illness or injury on their household.
Farmers may be more vulnerable than other occupational
groups, as illness/injury during critical periods of the year,
such as at harvest, may have a proportionally greater affect
on income than the duration of illness/injury. We can
assume that respondents who have been educated to a rel-
atively high level will have more knowledge about the
effects of and need for health care due to illness. Finally,
risk is also higher for children and the elderly, therefore
risk aversion, perceived loss and risk may be higher the
more children and elderly there are in a household.
The total number of household members and the number
amongst them with chronic diseases are assumed to
increase the perceived extent of the loss, as well as the per-
ceived risk. Utilization of health care during the last year
may also be an indicator of greater awareness of what
might happen in case of illness/injury.
We employ the common assumption that women have a
higher degree of risk aversion than men and that they have
a higher risk of illness. Finally, households that have some
sort of insurance (not only health insurance) have shown
that they have a greater risk aversion than those with no
insurance.
We have discussed above individual (or household) deter-
minants of WTP. An interesting discussion today concerns
the importance of "social determinants" in the form of
social capital that could significantly affect household
preferences for health insurance [27]. There is no clear
consensus surrounding the definition of social capital
[28], but it is generally agreed that it concerns informal
networks that are established between households, and
furthermore the trust and solidarity that characterizes
these networks [27].
Interestingly, the existence of social capital may affect
WTP for health insurance both positively and negatively.
Cost Effectiveness and Resource Allocation 2008, 6:16 />Page 6 of 16
(page number not for citation purposes)
To the degree that households trust one another in a com-
munity, they may also trust community-based health
insurance schemes similar to those presented in the sce-
narios, which would, all else being equal, increase WTP.
However, the existence of informal risk-sharing networks
may also tend to "crowd out" formal health insurance,
which would lead to lower WTP [27,28]. Unfortunately
we have no information about and no variables that
measure social capital, the implications of which are
explored in the discussion section below.
There are four problems common to many WTP studies:
i) the distribution of stated WTP is skewed; ii) some
respondents will state a zero WTP; iii) other respondents
will state a WTP very different from most of the respond-
ents (outliers); and iv) respondents' WTP will tend to con-
centrate – "heap" – around certain values.
Skewness is often dealt with by using a log-normal model.
The zero cases will then have to be excluded and outliers
are also often excluded based on different criterions. The
heaping effect, however, is often ignored. The fact that
respondents appear to concentrate on convenient values
suggests that their stated WTP represents a certain interval,
rather than a precise amount. Torelli and Trivelato [29]
have shown that this behaviour, if not considered, may
disguise true relationships.
The heaping effect in our data is illustrated in table 3.
About one-fifth of the respondents state a zero WTP in sys-
tem B and almost one-third do so in system C. It is obvi-
ous from table 3 that the other respondents concentrate
on values such as 5,000, 10,000, 15,000 VND and so on.
It is also noteworthy in table 3 that one respondent stated
a WTP of 22 VND, which is an amount that hardly differs
from zero in this context. This is addressed further in the
methodological part of the discussion section.
If we assume that respondents' stated WTP represents
intervals rather than precise measurements then this must
be considered in the econometric method. We have done
so by using interval or grouped data regression [30]. We
estimate the following model:
The main determinants of WTP and the variablesFigure 2
The main determinants of WTP and the variables.
Effect on WTP
ÏÏÏÏ
Main determinants Degree of
risk aversion
Percieved risk Percieved
size of the loss
Income
age Ï
farmer Ï
higher education Ï
children 0 to 5 Ï
elderly Ï
poorÐ
rich Ï
household members Ï
chronic diseases Ï
past need of health care Ï
woman Ï
Variables in the study and their effect
on the main determinants
insurance experience Ï
Cost Effectiveness and Resource Allocation 2008, 6:16 />Page 7 of 16
(page number not for citation purposes)
Suppose represents respondents' true WTP, which is a
variable we cannot observe. What we do observe is
another variable y
i
for which
y
i
= 1 when ≤ 2 500 VND
y
i
= 2 when 2 500 < ≤ 7 500 VND
y
i
= 3 when 7 500 < ≤ 12 500 VND
y
i
= 4 when 12 500 < ≤ 17 500 VND
y
i
= 5 when 17 500 < ≤ 22 500 VND
y
i
= 6 when 22 500 < ≤ 27 500 VND
y
i
= 7 when 27 500 < ≤ 32 500 VND
y
i
= 8 when 32 500 < ≤ 37 500 VND
y
i
= 9 when 37 500 < ≤ 42 500 VND
y
i
= 10 when 42 500 < ≤ 47 500 VND
y
i
= 11 when 47 500 < ≤ 52 500 VND
y
i
= 13 when 52 500 <
Suppose that
ln =
β
x
i
+
ε
i
where
ε
i
~ N(0,
σ
2
)
y
i
∗
y
i
∗
y
i
∗
y
i
∗
y
i
∗
y
i
∗
y
i
∗
y
i
∗
y
i
∗
y
i
∗
y
i
∗
y
i
∗
y
i
∗
y
i
∗
Table 3: Household WTP in the two insurance systems
Compulsory insurance (B) Voluntary insurance (C)
Stated WTP No of
households
Percent Stated WTP No of
households
Percent
0 438 21% 0 617 30%
22 1 0% 2 000 5 0%
2 000 4 0% 3 000 6 0%
3 000 10 0% 4 000 1 0%
4 000 1 0% 4 500 1 0%
4 500 1 0% 5 000 115 6%
5 000 120 6% 7 000 1 0%
7 000 3 0% 7 500 1 0%
8 000 2 0% 8 000 2 0%
10 000 378 18% 10 000 334 16%
15 000 158 8% 12 000 1 0%
18 000 1 0% 15 000 141 7%
20 000 453 22% 20 000 395 19%
22 000 4 0% 22 000 3 0%
22 500 4 0% 22 500 7 0%
25 000 40 2% 25 000 41 2%
27 500 1 0% 27 500 2 0%
30 000 112 5% 30 000 105 5%
35 000 5 0% 35 000 2 0%
40 000 7 0% 40 000 7 0%
45 000 261 13% 45 000 223 11%
50 000 36 2% 50 000 35 2%
60 000 4 0% 55 000 1 0%
70 000 3 0% 60 000 5 0%
80 000 1 0% 70 000 3 0%
90 000 1 0% 80 000 1 0%
100 000 10 0% 90 000 1 0%
150 000 1 0% 100 000 6 0%
200 000 2 0% 225 000 1 0%
225 000 1 0%
Total 2 063 100% Total 2 063 100%
Cost Effectiveness and Resource Allocation 2008, 6:16 />Page 8 of 16
(page number not for citation purposes)
In this case the likelihood function is
Using interval or grouped data regression solves the prob-
lems mentioned above and the heaping effect is consid-
ered. Also, the logarithm of the dependent variable can be
used adjusting for skewness. Still, zero answers for WTP
can be included. (If someone imagines the existence of
negative WTP reflected in zero answers this is also
included.) Outliers are kept in the highest interval.
The likelihood function has been maximized using STATA
8.0.
The Research Ethics Committee at Umeå University has
given ethical approval for the FilaBavi household surveil-
lance system, including data collection on vital statistics
(reference number 02-420), and specific approval for the
stated preferences survey (§86/04). The study has also
received ethical approval from Hanoi Medical University
and the Ministry of Health in Hanoi. The interviewers
obtained informed consent for the interviews from heads
of households.
Results
In the choice between the three different financing sys-
tems presented in Figure 1, a majority (52%) of respond-
ents preferred out-of-pocket financing, system A. Among
the rest, preferences were stronger for compulsory (28%)
rather than voluntary (20%) health insurance. The results
of the choice experiment are reported in Thanh et al. [31],
where the determinants for the choice between the three
systems are also studied.
The focus of the present paper is on the extent and deter-
minants of WTP for health insurance. The respondents
were asked two different types of questions; the first – ana-
lyzed in Thanh et al. [31] – concerned the choice of
financing system and aimed to explore which of the three
systems the respondents prefer over the others; in the sec-
ond type of question – analyzed in this paper – respond-
ents were asked how much they would be willing to pay
given that a certain system (B or C) was chosen for Bavi.
All of the respondents were asked these WTP questions,
and not only those who preferred insurance over out-of-
pocket. Below we first report the extent of WTP given the
respective systems, and then present the estimations of
what determines WTP.
The average household in Bavi spends about 520 000
VND per year or around 45 000 dong per month for
health care of all sorts – private as well as public with both
curative and preventive care. This finding is from a study
within the FilaBavi project and was used as the starting bid
in this study (table 2).
The average household WTP is lower than this, however
(table 4). For the compulsory insurance the average house-
hold WTP is around 18 000 dong per month. For the vol-
untary insurance it is even lower. If only those respondents
who have a positive WTP are included, or only those
households that prefer one of the health insurance alter-
natives over out-of-pocket financing, the average is 22
000–24 000 VND in the respective schemes. This elicited
WTP corresponds to half of the total health care expendi-
ture of the average household in Bavi.
Total household health expenditure covers public health
care (11 000 VND), self-treatment (5 000 VND) and pri-
vate health care (24 000 VND), which gives a total of 40
000 VND (table 2). Added to this is the cost of health
insurance, prevention and rehabilitation, which gives a
total of around 45 000 VND, hence the starting bid for
respondents. Thus, the average WTP for all respondents
covers more than the costs for public health care and self-
treatment but does not cover costs for private care.
Whether one should conclude that this represents a
favourable basis for the expansion of health insurance in
this district depends, among several things, on the
assumptions one makes about how respondents are likely
to behave once insured – to what extent would they sub-
stitute self-treatment and private health care for public
health care, and to what extent would they increase their
demand for health care? This is discussed in the next sec-
tion. As a basis for the discussion we will below compare
to existing insurance premiums.
Health insurance systems operate in Vietnam where the
premiums correspond to a lower level of household
health care expenditure than reported above for Bavi. For
the community-based health insurance schemes offered
in rural areas by the Vietnam Social Security, premiums
range from 60,000 VND to 100,000 VND per person and
year. [32]. The lower boundary of this range corresponds
to 22 000 VND per household and month in Bavi, i.e. an
amount equal to the WTP of households whose WTP is
L =
−
⎛
⎝
⎜
⎞
⎠
⎟
∗
∗
−
⎛
⎝
⎜
⎞
⎠
⎟
−
−
=
∏
Φ
ΦΦ
ln
ln ln
2500
7500 2500
1
β
σ
β
σ
β
σ
x
i
x
i
x
i
y
i
⎛⎛
⎝
⎜
⎞
⎠
⎟
⎡
⎣
⎢
⎤
⎦
⎥
∗
∗
−
⎛
⎝
⎜
⎞
⎠
⎟
−
−
⎛
⎝
⎜
⎞
⎠
⎟
=
∏
y
i
x
i
x
i
2
12500 7500
ΦΦ
ln ln
β
σ
β
σ
⎡⎡
⎣
⎢
⎤
⎦
⎥
∗•••
••• ∗
−
⎛
⎝
⎜
⎞
⎠
⎟
−
−
⎛
⎝
⎜
⎞
⎠
=
∏
y
i
x
i
x
i
3
52500 47500
ΦΦ
ln ln
β
σ
β
σ
⎟⎟
⎡
⎣
⎢
⎤
⎦
⎥
∗
∗−
−
⎛
⎝
⎜
⎞
⎠
⎟
⎡
⎣
⎢
⎤
⎦
⎥
=
=
∏
∏
y
y
i
i
x
i
11
12
1
52500
Φ
ln
β
σ
Cost Effectiveness and Resource Allocation 2008, 6:16 />Page 9 of 16
(page number not for citation purposes)
larger than zero. These groups of households make up
70% (for the voluntary insurance system) and 80% (for
the compulsory insurance system) of the total group of
households (table 4). The Vietnam Social Security also
offers a school health insurance system for students [33],
for which premiums range from 10,000 VND to 45,000
VND per student and year. The upper boundary of that
range is close to the average WTP for all households in this
study.
We have compared a low-cost health care system to the
income that would be generated through the WTP stated
by the respondents. This is done for those in the Bavi pop-
ulation who prefer health insurance (compulsory or vol-
untary) over out-of-pocket health care payments. The
estimation is explained in more detail in appendix 1. We
assume that the uninsured population who prefer health
insurance, enrol in a health insurance scheme. We also
assume that their health care utilization matches the
national average and that non-treatment and self-treat-
ment episodes are replaced by outpatient care at Commu-
nity Health Centres. Furthermore, we assume that private
users turn to public health care with the same patterns as
public users. Finally, we assume that the length of stay at
the provincial and central levels is the same as at the dis-
trict level (see the WTP scenarios in Figure 1).
The total health care costs incurred by the target popula-
tion per year were estimated as being 5.9 billion VND. The
stated WTP for the same population would yield an
income of the same magnitude, ranging from 5.6 to 5.9
million VND (table 5) based on a WTP between 60,000
and 63,000 VND per person per year.
The estimations of what determines WTP are presented in
tables 6 and 7. As hypothesized, the income variables are
significant determinants for WTP in system B and close to
significant (or significant at the 10% level) in system C.
Being a rich household is significant, or close to signifi-
cant, and positive in some of the estimations. Belonging
to the group of poor households is significant, or close to
significant, and negative in some of the estimations.
The larger the household the bigger the WTP. This holds
true for all estimations. In system C, WTP is also higher as
the number of children in the household increases. WTP
is also higher for households that have at least one mem-
ber with a chronic disease, and is true for three of the esti-
mations. All of the estimations show that WTP is higher if
the respondent is educated beyond primary level.
All of the above results were expected and are in line with
our hypotheses. We did not expect, however, that WTP
would fall with increasing age of the respondent, and that
having at least one person in the household who needed
health care during the last year would decrease WTP in
three of the estimations. Also, being a farmer is significant
and negative in one of the estimations.
Discussion
Methodological considerations
There are a large number of potential biases in a WTP
study. We follow the typology developed by Mitchell and
Carson [34] when discussing the biases relevant to our
study and whether they may pose a problem or not.
Mitchell and Carson classify the ("potential response
effect") biases into three large groups:
Table 4: Respondents' WTP for the two forms of health insurance
For household
per month
Per person
and year*
Mean Median Mean Median % of
respon-
dents
N
Compulsory health insurance
WTP for all respondents 17 873 15 000 47 661 40 000 100% 2 063
WTP for respondents whose WTP > 0 22 690 20 000 60 507 53 333 79% 1 625
WTP for respondents who prefer HI over OOP 23 650 20 000 63 067 53 333 48% 999
Voluntary health insurance
WTP for all respondents 15 588 10 000 41 568 26 667 100% 2 063
WTP for respondents whose WTP > 0 22 239 20 000 59 304 53 333 70% 1 446
WTP for respondents who prefer HI over OOP 22 501 20 000 60 003 53 333 48% 999
*Average household size is 4.5 persons.
HI = health insurance.
OOP out-of-pocket payments
Cost Effectiveness and Resource Allocation 2008, 6:16 />Page 10 of 16
(page number not for citation purposes)
i) The first group concerns cases where respondents mis-
represent their true WTP. For example, this could be a stra-
tegic bias when a respondent purposely states a WTP
higher or lower than the true one because the respondent
in his or hers self-interest wants to influence the result of
the study. It could also be a compliance bias when a
respondent gives an answer he or she believes the inter-
viewer wants to hear.
ii) The second group concerns cases where the elicitation
method implicitly gives a "correct" value for the WTP. The
starting point bias is one of these biases. A bid is given to
the respondent and thereby a cue to where the WTP might
lay.
iii) The third group concerns different misspecifications of
the scenario. In this case the respondent perceives the sce-
nario differently to what is intended. Among these biases,
the part-whole bias is of particular interest to our study It
means that the respondent includes something which is
not in the scenario or excludes something which is there.
In our study, instead of choosing a direct open-ended
WTP question (simply asking the respondent what his/her
maximum WTP is) we chose a take it or leave it question
with an open ended follow-up; the reason being that
respondents may find it hard to answer direct open-ended
questions and that this in turn may lead to many protest
zero answers. With our format, there is instead a risk for a
starting point bias, however, the results do not indicate
that this is a problem. Most respondents give a WTP far
lower than the bid they were given. Only 15% (for com-
pulsory health insurance) and 13% (voluntary health
insurance) stated a WTP equal to or higher than the bid
they were given (table 3). The average WTP was less than
half of the bid.
Some respondents did give a WTP equal to zero, 21% for
the compulsory insurance and 30% for the voluntary
insurance. But it is not likely that these were protest zeros
in the sense discussed above. The scenario was carefully
explained by the interviewers and a concrete bid was
given. The interview process was closely monitored and
the interviewers did not report any problems in making
the bid understandable for the respondents. However,
there could be WTP zeros given, not representing true
WTP, for another reason; there may be a strategic bias.
Almost all of the respondents (90%) stating a zero WTP
belong to the group preferring the out-of-pocket financing
alternative over the health insurance alternatives (tables 8
and 9).
It may well be that some of them voted once more for
their preferred system when they stated their WTP, even
though the question was about their WTP given that
someone else (the government) had chosen to implement
a health insurance system. This may also be the case for
the respondent who stated a WTP of 22 VND for compul-
sory health insurance, since this amount is very low
indeed (table 3). We cannot determine to what extent this
is a problem in our study. It was pointed out in the data
section above that it is reasonable to assume that respond-
ents have a larger (true) WTP for the financing alternative
that they prefer, or conversely a lower WTP for the alterna-
Table 5: Total yearly income for a health insurance scheme and estimated health care costs
Health insurance
scheme
WTP per
household
and month
(1)
Household
members
(2)
Premium per
person and
month
(3)
Premium per
person and
year
(4)
Enrolees
(5)
Total yearly
income
(6)
Compulsory (B) 23,650 4.5 5,256 63,067 93,949 5,925,050,266
Voluntary (C) 22,501 4.5 5,000 60,003 93,949 5,637,190,530
Health
care costs
per
household and
month
(12)
Household
members
(11)
Health care
costs per person
and month
(10)
Health care
costs per
person and
year
(9)
Enrolees
(8)
Total health
care costs
(VND)
(7)
23,572 4.5 5,238 62,858 93,949 5,905,491,555
Note: The health insurance schemes include only those households that prefer health insurance to out-of-pocket payments. For the estimation of
health care costs see appendix 1.
(3) = (1)/(2).
(4) = (3)*12 months.
(6) = (4)*(5).
(9) = (7)/(8) [(7) is from table A1].
(10) = (9)/12 months.
(12) = (10)*(11)
Cost Effectiveness and Resource Allocation 2008, 6:16 />Page 11 of 16
(page number not for citation purposes)
tives that they do not prefer. But if there is a strategic bias,
WTP in this study is underestimated since there is no indi-
cation of inflated WTP answers (WTP being far lower than
actual health care expenditure).
A compliance bias seems less likely because of the rela-
tively low WTP given in relation to the bid. If the respond-
ents wanted to please the interviewers they may be
expected to give a WTP closer to the bid.
Another problem is found in the third group of potential
biases described above; did the respondents understand
the scenarios? Again, the interview process was well
planned (including interviewer training and focus group
discussions) and carefully monitored. There is therefore
no reason to suspect that the respondents didn't under-
stand the scenarios, however, they may not have trusted
them.
The respondents may have generalized the problems of
the existing health insurance systems in Vietnam to the
hypothetical ones [31]. In reality, when using insurance,
patients can risk longer waiting times and lower quality of
care. They also run the risk of still having to pay consider-
able amounts out-of-pocket, e.g. in the form of gifts to the
staff [9]. With this in mind, the respondents may not have
believed or trusted that the health insurance described in
the scenarios would deliver the benefits promised. If so
there is an information bias. The WTP that respondents
indicated may relate to benefits that are smaller than the
intended benefits in the scenarios, and therefore the WTP
may be underestimated.
The conclusion from this discussion of potential biases is
therefore that there is a possibility that WTP estimates are
underestimated for two reasons, strategic behavior and
part-whole bias. The starting point and the compliance
bias seem less likely.
It is also possible that WTP is underestimated in relation
to the true WTP of the Bavi population, since the selection
of households was conducted so that 50% of them would
be headed by females. There is evidence that female-
headed households are more disadvantaged than others
Table 6: Interval regression. WTP determinants for compulsory health insurance (system B)
12
Coef. z P > |z| Coef. z P > |z|
Head .0621513 0.87 0.382 .042933 0.66 0.507
Male .0785897 1.12 0.261 .029905 0.47 0.638
Age 0106958 -3.83 0.000 0102374 -4.03 0.000
Farmer 0367228 -0.51 0.613 1386146 -2.09 0.036
Morethanprimar
y
.1528767 2.24 0.025 .1391636 2.25 0.025
Membershh .1107999 5.35 0.000 .0826442 4.38 0.000
Children .0003272 0.01 0.995 0011396 -0.03 0.979
Elderly 0356463 -0.65 0.518 0058438 -0.12 0.907
Chronic .1734691 2.43 0.015 .062738 0.97 0.335
Hcneed 1701406 -1.67 0.095 0932201 -1.00 0.315
Insurexp .0495472 0.61 0.540 0144759 -0.20 0.844
Poor 1165337 -1.28 0.201 184308 -2.22 0.027
Rich .1986089 2.45 0.014 .1885194 2.56 0.010
Prefcohi 1.129829 18.86 0.000
Prefvohi .8976605 13.31 0.000
Constant 9.227955 47.50 0.000 8.89968 50.17 0.000
Log likelihood = -5003.2461 Log likelihood = -4809.0038
LR chi2(13) = 111.20 LR chi2(15) = 499.68
Prob > chi2 = 0.0000 Prob > chi2 = 0.0000
Total number of observations = 2022 Total number of observations = 2022
Variable name Description
Prefcohi Prefcohi = 1 if the respondent prefers compulsory health insurance (system B) over the other alternatives. Prefcohi = 0
otherwise.
Prefvohi Prefvohi = 1 if the respondent prefers voluntary health insurance (system C) over the other alternatives. Prefvohi = 0
otherwise
For an explanation of the other variables, see table 1.
Cost Effectiveness and Resource Allocation 2008, 6:16 />Page 12 of 16
(page number not for citation purposes)
[35,36]; that a larger percent of them live in poverty than
other households. Since income is positively related to
WTP, this could mean that households in this study have
a lower WTP than those of the entire Bavi population.
WTP for health insurance
The determinants of WTP in this study are mostly in line
with our expectations; having a greater income, higher
education, larger household and at least one household
member with chronic disease increases WTP. We have not
Table 7: Interval regression. WTP determinants for voluntary health insurance (system C)
12
Coef. z P > |z| Coef. z P > |z|
Head .1240847 1.47 0.142 .0740998 1.02 0.309
Male .1294685 1.56 0.119 .0749992 1.05 0.294
Age 0083357 -2.52 0.012 007418 -2.60 0.009
Farmer .0144706 0.17 0.867 112466 -1.51 0.131
Morethanprimar
y
.20443 2.52 0.012 .1703909 2.44 0.015
Membershh .0996013 4.05 0.000 .0646929 3.05 0.002
Children .1119569 1.97 0.048 .0792814 1.62 0.104
Elderly 0344205 -0.53 0.599 0092381 -0.16 0.870
Chronic .3078385 3.65 0.000 .1541756 2.12 0.034
Hcneed 4161749 -3.47 0.001 3366622 -3.27 0.001
Insurexp .0769168 0.80 0.423 0151158 -0.18 0.855
Poor 0419754 -0.39 0.697 153246 -1.65 0.100
Rich .1770999 1.84 0.066 .1259169 1.52 0.129
Prefcohi 1.321762 19.56 0.000
Prefvohi 1.648773 21.81 0.000
Constant 8.885455 38.61 0.000 8.452932 42.49 0.000
Log likelihood = -4820.0345 Log likelihood = -4522.9879
LR chi2(13) = 97.41 LR chi2(15) = 691.51
Prob > chi2 = 0.0000 Prob > chi2 = 0.0000
Total number of observations = 2022 Total number of observations = 2022
Variable name Description
Prefcohi Prefcohi = 1 if the respondent prefers compulsory health insurance (system B) over the other alternatives. Prefcohi = 0
otherwise.
Prefvohi Prefvohi = 1 if the respondent prefers voluntary health insurance (system C) over the other alternatives. Prefvohi = 0
otherwise
For an explanation of the other variables, see table 1.
Table 8: The number of respondents stating a zero WTP for the
compulsory health insurance system
Preference for financing systems Total
Out-of-
Compulsory
health
insurance
Voluntary
health
insurance
WTP = 0 394 5 39 438
90% 1% 9% 100%
WTP > 0 671 582 372 1625
41% 36% 23% 100%
Total 1065 587 411 2063
52% 28% 20% 100%
Table 9: The number of respondents stating a zero WTP for the
voluntary health insurance system
Preference for financing systems Total
Out-of-
Compulsory
health
insurance
Voluntary
health
insurance
WTP = 0 557 59 1 617
90% 10% 0% 100%
WTP > 0 508 528 410 1446
35% 37% 28% 100%
Total 1065 587 411 2063
52% 28% 20% 100%
For an explanation of the other variables, see table 1.
Cost Effectiveness and Resource Allocation 2008, 6:16 />Page 13 of 16
(page number not for citation purposes)
found any other WTP study of health insurance from Viet-
nam for comparison, but the results reported from WTP
studies in other developing countries (cited in the back-
ground section) show similar results in these respects.
We did not expect WTP in the present study to fall with
increasing age, and also if the household had been in need
of health care during the last year. In the studies from
other developing countries the results on age are mixed,
some report increasing, and others decreasing WTP with
age. When variables similar to our "hcneed"(if the house-
hold had been in need of health care during the last year)
are included in studies from other countries, the result is
opposite to ours, which is noteworthy and discussed
below.
For WTP for health insurance our results can be summa-
rized as follows:
• The average WTP (18 000 VND) covers the average costs
for public health care (11 000 VND).
• The average WTP is also sufficient to include self-treat-
ment (5 000 VND).
• For 70–80% of the respondents the average WTP (22
000) is sufficient to pay the lower range of premiums in
the existing health insurance programme.
• It is feasible to design a low-cost health care system that
could be financed – at least for the population who prefer
insurance over an out-of-pocket system -given the WTP
stated by the respondents.
• The average WTP would only be sufficient to finance
about half of all health care costs, public as well as private.
The respondents were asked about their WTP for two
insurance systems for public health care. These insurance
systems would give them free health care and free pre-
scribed drugs at the commune and district levels, and
reimbursement at higher levels corresponding to the cost
at the district level. In this situation there are two extreme
alternatives for how the respondents could behave if
insured:
1. They could substitute all private care for public care.
Their WTP would not be sufficient to finance this.
2. They could continue using public health care at the
same frequency as before. Their WTP would be enough to
finance this.
Existing evidence indicates that something in between
these two alternatives would happen. The studies on
health insurance in Vietnam referred to in the background
section show there will most likely be a shift from private
care and self-treatment to public care, and that health
service utilisation will increase. If these changes are sub-
stantial, the limit for what average WTP in this study can
finance is soon reached.
There is a logical question here: In the situation these
households are experiencing, with high out-of-pocket
medical expenses and risk for catastrophic health expend-
iture, why do they not state a higher WTP? In the section
above the possibility that WTP is underestimated was dis-
cussed. This is due both to a possible strategic and a part-
whole bias. Some of the respondents who preferred out-
of-pocket financing to insurance may have stated a zero
WTP for insurance. Some respondents may also have
interpreted things in the insurance scenarios that were not
meant to be there.
One such factor may be the informal payments, in the
form of money or gifts to the staff, which are common.
There are reports of such payments being as much as 14
times higher than official fees [37] and that they are
higher in northern provinces than in the south [9]. Other
studies have also suggested that respondents to surveys
factor in these unofficial payments when answering [5].
This would mean that "free health care" in the insurance
scenarios would not be interpreted as free at all.
Another such factor is the risk that in reality, when using
insurance, patients can risk longer waiting times and
lower quality of care [31]. The scenarios, at least implic-
itly, assume the same quality in public health care for
both insured and uninsured. These factors could explain a
possible underestimation of WTP.
There are also reasons for why the true WTP might be rel-
atively low, with quality of public health care being one.
In comparison with private care, public care may, for
example, be less accessible, have a smaller drug supply
and meet patients with less respect [25]. Perhaps this
could help to explain why our variable "hcneed" – if the
household had been in need of health care during the last
year – turned out to be a negative determinant of WTP.
People with recent experiences of health care are better
judges of what private as well as public care can offer.
Furthermore, in the methods section the potential impor-
tance of social capital was discussed. One part of this is the
trust for the community that people have or don't have. If
the respondents in our survey did not trust the local com-
munity to deliver what is specified in the scenarios, meas-
urements of social capital – which we don't have – could
have provided better insight into this problem. Another
part of social capital is informal risk-sharing. Studies have
Cost Effectiveness and Resource Allocation 2008, 6:16 />Page 14 of 16
(page number not for citation purposes)
shown that this is common in Vietnam, for example in the
form of people borrowing money from relatives and
friends to pay for health care, and that this may decrease
the interest in health insurance [38].
Conclusion
The goal for the Vietnamese government is to reach insur-
ance or prepayment coverage for all citizens within a few
years. Today, about half of the population is covered.
Reaching the other half may prove to be harder than
reaching the first. One way to study the possibilities for
insurance expansion is to estimate the WTP for insurance
– to find out how much other expenditure people are will-
ing to sacrifice so that they can be insured or, put another
way, what value they place on insurance.
This is, to our knowledge, the first such study in Vietnam.
It has uncovered great scepticism of an insurance system;
half of the respondents prefer an out-of-pocket system
and the stated WTP is relatively low. It would, however, be
wrong to conclude that it is too low. Under certain condi-
tions, discussed above, people's WTP could sufficiently
finance a health insurance system.
Our study leaves many questions for future research, some
of which are: How much of the WTP result can be contrib-
uted to the product, public health care, and how much to
competing informal risk-sharing networks? And how
much can be contributed to the complexities of an insur-
ance system in a setting where people are relatively inex-
perienced of such formal arrangements? It will take
further quantitative and qualitative studies to uncover the
answers to these questions.
Our findings on the determinants of WTP are, in this light,
somewhat encouraging. WTP falls with increasing age and
rises with more education. Older people may be less
inclined to undergo change and therefore less ready to
support a new, unknown system. People with higher edu-
cation may be more confident in adjusting to, and trust-
ing, a new system. These results are encouraging because
they highlight a potential for public information schemes
that could change the predominantly negative attitude
towards health insurance that this study has uncovered. A
key task for policy-makers is to win the trust of the popu-
lation for a health insurance system, particularly among
the old and those with relatively low education.
Competing interests
The authors declare that they have no competing interests.
Authors' contributions
CL performed the statistical analysis, drafted and revised
the manuscript. NXT designed the questionnaire, was
responsible for monitoring the interview process and was
also responsible for drafting and revising the manuscript.
NTKC, AE and LL participated in the conception, planning
and design of the study and in the revisions of the manu-
script. All co-authors read and approved the final manu-
script.
Appendix 1. Estimation of minimum health care
costs for the section of the population in Bavi
who prefer health insurance (compulsory or
voluntary) to out-of-pocket health care
payments
A little less than half of the respondents (48.4%) stated
that they prefer either compulsory or voluntary health
insurance over out-of-pocket payments for health care.
We have estimated a minimum health care cost for this
part of the population by using data from the Vietnam
National Health Survey 2002 [39]. These data apply to the
whole country so the following estimations in table 10
and table 11 is a rough approximation.
Assumptions
Health care utilization patterns, health insurance cover-
age, number of sickness episodes per person and year and
health care costs per episode in Bavi are similar to the
national average.
Table A1: Estimated number of enrolees and sickness episodes
Population in Bavi: 235,000
Percent of population insured: 17.4%
Population un-insured: 235,000*(1-0.174) = 194,110
Number expected to enrol in a health insurance scheme: 194,110*48.4% = 93,949
Number of sickness episodes per person per year*: 3
Number of sickness episodes among those enrolled in health insurance scheme: 93,949*3 = 281,848
Of which: episodes in inpatient care: 281,848*1.4%* = 3946
episodes in outpatient care: 281,848*28.1%* = 79,199
episodes of self-treatment: 281,848*65.9%* = 185,738
episodes of non-treatment: 281,848*4.6%* = 12,965
* Source: Vietnam National Health Survey 2002
Cost Effectiveness and Resource Allocation 2008, 6:16 />Page 15 of 16
(page number not for citation purposes)
All of the respondents who prefer health insurance over
out-of-pocket payments in our study will choose to enrol
in a health insurance scheme.
The length of stay at provincial and central levels is the
same as district level. Because the hypothetical scheme
allows for treatment at higher levels if needed, the insured
will be compensated by a daily amount equal to the cost
per bed day at district level. The cost for treatment at pro-
vincial and central levels is the same as the cost for treat-
ment at the district level.
The non-treatment and self-treatment episodes will
instead be episodes of out-patient care at commune
health centres under the health insurance scheme.
Private health care users will use public health care with
the same health care utilisation patterns as those of public
health care users.
There are four major reasons why the costs in this system
are lower than the current actual health care expenditure
in the population. Firstly, none of the administrative costs
for the insurance system are included. The costs should
therefore be increased by 5–10%. Secondly, over half of
the household health care expenditure in Bavi is spent on
private health care. Thirdly, the household health care
expenditure includes both direct (e.g. medical costs) and
indirect costs (e.g. transportation cost). Finally, costs for
care at the provincial and central levels as estimated in our
hypothetical system are based on cost per bed day at the
district level.
Acknowledgements
The study was made possible through the financial support provided by
SIDA/SAREC through the Health Systems Research Programme in Viet-
nam.
References
1. World Health Organization: Health systems: improving performance.
World Health Report 2000. Geneva 2000.
2. Ekman B, Liem NT, Duc HA, Axelson H: Health insurance reform
in Vietnam: a review of recent developments and future
challenges. Health Policy and Planning 2008, 23:252-263.
3. Xu K, Evans DB, Kawabata K, Zeramdini R, Klavus J, Murray CJL:
Household catastrophic health expenditure: a multicountry
analysis. The Lancet 2003, 362:111-117.
4. Prime Minister. Decision number 35/2001/QD-TTg dated
March 19, 2002 on Approval strategy on health care for all
from 2001 to 2010. Hanoi, Vietnam .
Table A2: Estimated health care costs for the expected enrolees in a health insurance scheme in Bavi
Utiliza-
tion
rates
(1)*
Total
sickness
episodes
(2)**
Sickness
episodes
(3)
Weight to
distribute
the private
care
episodes
(4)
Private care
episodes distributed
to public
facilities
(5)
Expected sickness
episodes in
public
facilities
(6)
Health care
cost per
episode
(7)*
Total costs
1000 VND
(8)
Inpatients** 3,946
CHC 0.158 623 0.173246 60 684 104,000 71,097
DHC 0.333 1,314 0.365132 127 1,441 242,000 348,676
Provincial and central 0.421 1,661 0.461623 160 1,822 242,000 440,818
Private and others 0.088 347
Outpatients** 79,199
CHC 0.32 25,344 0.659794 26,911 250,958 15,400 3,864,753
DHC 0.086 6,811 0.177320 7,232 14,044 43,800 615,107
Provincial and central 0.079 6,257 0.162887 6,644 12,900 43,800 565,040
Private and others 0.515 40,787
Self-treatment** 185,738
Non-treatment** 12,965
Total 281,848 281,848 5,905,492
*Source: Ministry of Health and General Statistics Office: Results of Vietnam National Household Survey 2001–02. Hanoi; 2003.
Health care cost per sickness episode is health care cost per visit for outpatients or per admission for inpatients, including hospital fees, drugs, X-
ray and laboratory tests. The cost does not include indirect (or non-medical) costs, such as costs for travelling, lodging and gifts.
**From table A1.
(3) = (1)*(2).
(4)CHC = (1)CHC/[(1)CHC + (1)DHC + (1)Provincial and central].
(4)DHC = (1)DHC/[(1)CHC + (1)DHC + (1)Provincial and central].
(4)Provincial and central = (1)Provincial and central/[(1)CHC + (1)DHC + (1)Provincial and central].
(5) = (4)*(3)Private and others.
(6)CHC = (3)CHC + (5)CHC + self treatment + non treatment.
(6)DHC = (3)DHC + (5)DHC.
(6)Provincial and central = (3)Provincial and central + (5)Provincial and central.
(8) = (6)*(7)
Publish with BioMed Central and every
scientist can read your work free of charge
"BioMed Central will be the most significant development for
disseminating the results of biomedical research in our lifetime."
Sir Paul Nurse, Cancer Research UK
Your research papers will be:
available free of charge to the entire biomedical community
peer reviewed and published immediately upon acceptance
cited in PubMed and archived on PubMed Central
yours — you keep the copyright
Submit your manuscript here:
/>BioMedcentral
Cost Effectiveness and Resource Allocation 2008, 6:16 />Page 16 of 16
(page number not for citation purposes)
5. Wagstaff A: Health Insurance for the Poor: Initial Impacts of
Vietnam's Health Care Fund for the Poor. World Bank Policy
Research Working Paper 4134 2007.
6. Carrin G, James C: Social health insurance: Key factors affect-
ing the transition towards universal coverage. International
Social Security Review 2005, 58:45-64.
7. Duong DV, Lee AH, Binns CW: Measuring Preferences for Deliv-
ery Services in Rural Vietnam. Birth 2005, 32:194-202.
8. Sepehri A, Sarma S, Simpson W: Does non-profit health insur-
ance reduce financial burden? Evidence from the Vietnam
living standards survey panel. Health Economics 2006,
15:603-616.
9. Jowett M, Contoyannis P, Vinh ND: The impact of public volun-
tary health insurance on private health expenditures in Viet-
nam. Social Science and Medicine 2003, 56:333-343.
10. Jowett M, Deolalikar A, Martinsson P: Health insurance and treat-
ment seeking behaviour: evidence from a low-income coun-
try. Health Economics 2004, 13:845-857.
11. Wagstaff A: Health Insurance Impacts on Health and Non-
medical Consumption in a Developing Country. World Bank
Policy Research Working Paper 3563 2005.
12. Chang FR, Trivedi PK: Economics of self-medication: theory
and evidence. Health Economics 2003, 12:721-739.
13. Sepehri A, Simpson W, Sarma S: The influence of health insur-
ance on hospital admission and length of stay – The case of
Vietnam. Social Science and Medicine 2006, 63:1757-1770.
14. Bärnighausen T, Liu Y, Zhang X, Sauerborn R: Willingness to pay
for social health insurance among informal sector workers in
Wuhan, China: a contingent valuation study. BMC Health Serv-
ices Research 2007, 7:114.
15. Dong H, Kouyate B, Cairns J, Mugisha F, Sauerborn R: Willingness-
to-pay for community-based health insurance in Burkino
Faso. Health Economics 2003, 12:849-862.
16. Dong H, Mugisha F, Gbangou A, Kouyate B, Sauerborn R: The feasi-
bility of community-based health insurance in Burkino Faso.
Health Policy
2004, 69:45-53.
17. Asenso-Okyere WK, Osei-Akoto I, Anum A, Appiah EN: Willing-
ness to pay for health insurance in a developing economy. A
pilot study of the informal sector of Ghana using contingent
valuation. Health Policy 1997, 42:223-237.
18. Asgary A, Willis K, Taghvaei AA, Rafeian M: Estimating rural
households' willingness to pay for health insurance. European
Journal of health Economics 2004, 5:209-215.
19. Mathiyazhagan K: Willingness to pay for rural health insurance
through community participation in India. International Journal
of health planning and management 1998, 13:47-67.
20. Klose T: The contingent valuation method in health care.
Health Policy 1999, 47:97-123.
21. Drummond MF, Sculpher MJ, Torrance GW, O'Brien BJ, Stoddart GL:
Methods for the Economic Evaluation of Health Care Programmes King's
Lynn: Oxford University Press; 2005.
22. Dolan P, Olsen JA: Distributing health care. Economic and ethical issues
King's Lynn. Oxford University Press; 2002.
23. Long NH, Do TT, Van PH, Anh TT, Chuc NTK: Filabavi DSS, Viet-
nam. In Population and health in developing countries. Population, Health
and Survival at INDEPTH sites Volume 1. Edited by: Sankoh OA, Kahn
K, Mwageri E, Ngom P, Nyarko P. Ottawa: International Develop-
ment Research Centre; 2002:305-310.
24. Thuan NTB: The burden of household health care expenditure
in a rural district in Vietnam. In MPH thesis Nordic School of Pub-
lic Health, Sweden; 2002.
25. Ha NTH, Berman P, Larsen U: Household utilization and
expenditure on private and public health services in Viet-
nam. Health Policy and Planning 2002, 17:61-70.
26. Santerre ER, Neun PS: Health Economics: Theory, Insights, and Industry
studies Fort Worth: Harcourt Brace College Publishers; 1996.
27. Mladovsky P, Mossialos E: A Conceptual Framework for Com-
munity-Based Health Insurance in Low-Income Countries:
Social Capital and Economic Development. World Development
2008, 36:590-607.
28. Jowett M: Theoretical insights into the development of health
insurance in low-income countries. In Discussion Paper 188. Cen-
tre for Health Economics York University; 2004.
29. Torelli N, Trivellato U: Modeling inaccuracies in job-search
duration data. Journal of Econometrics 1993, 59:187-211.
30. Brannas K: Linear regression with grouped data on the
dependent variable. Metrol 1987, 45:63-79.
31. Thanh NX, Lofgren C, Rudholm N, Chuc NTK, Emmelin A, Lindholm
L: People's preferences for health care financing options: A
choice experiment in rural Vietnam. In Thanh NX, The injury pov-
erty trap in rural Vietnam. PhD thesis Umeå University, Epidemiology
and Public health sciences; 2005.
32. Vietnam Social Security: Community-based Health Insurance and School
Health Insurance Schemes in Vietnam. Hanoi 2005.
33. Vietnam Social Security: School Health Insurance in Vietnam. Hanoi
2005.
34. Mitchell CR, Carson TR: Using survey to value public goods: The contin-
gent valuation method Washington, D.C.: Resources for the Future;
1989.
35. Cramb RA, Purcell T, Ho TCS: Participatory assessment of rural
livelihoods in the Central Highlands of Vietnam. Agricultural
Systems 2004, 81:255-272.
36. Ahmed AU, Hill RV, Smith LC, Wiesmann DM, Frankenberger T: The
World's Most Deprived. Characteristics and Causes of
Extreme Poverty and Hunger. 2020 Discussion Paper 43, Interna-
tional Food Policy research Institute, Washington 2007.
37. Adams SJ: Vietnam's Health Care System: A Macroeconomic Perspective.
Paper prepared for the International Symposium on Health Care Systems
in Asia [ />].
Hitotsubashi University, Tokyo Januari 21–22 2005
38. Jowett M: Do informal risk sharing networks crowd out public
voluntary health insurance? Evidence form Vietnam. Applied
Economics 2003, 35:1153-1161.
39. Ministry of Health and General Statistics Office: Results of Vietnam
National Household Survey 2001–02. Hanoi 2003.