Báo cáo y học: "Capacity utilization and the cost of primary care visits: Implications for the costs of scaling up health interventions" pdf
Bạn đang xem bản rút gọn của tài liệu. Xem và tải ngay bản đầy đủ của tài liệu tại đây (473.47 KB, 9 trang )
BioMed Central
Page 1 of 9
(page number not for citation purposes)
Cost Effectiveness and Resource
Allocation
Open Access
Research
Capacity utilization and the cost of primary care visits: Implications
for the costs of scaling up health interventions
Taghreed Adam*
1
, Steeve Ebener
2
, Benjamin Johns
3
and David B Evans
4
Address:
1
Alliance for Health Policy and Systems Research, World Health Organization, Geneva, Switzerland,
2
Knowledge Management and
Sharing, World Health Organization, Geneva, Switzerland,
3
Johns Hopkins University, Baltimore, USA and
4
Health Systems Financing, World
Health Organization, Geneva, Switzerland
Email: Taghreed Adam* - ; Steeve Ebener - ; Benjamin Johns - ;
David B Evans -
* Corresponding author
Abstract
Objective: A great deal of international attention has been focussed recently on how much
additional funding is required to scale up health interventions to meet global targets such as the
Millennium Development Goals (MDGs). Most of the cost estimates that have been made in
response have assumed that unit costs of delivering services will not change as coverage increases
or as more and more interventions are delivered together. This is most unlikely. The main objective
of this paper is to measure the impact of patient load on the cost per visit at primary health care
facilities and the extent to which this would influence estimates of the costs and financial
requirements to scale up interventions.
Methods: Multivariate regression analysis was used to explore the determinants of variability in
unit costs using data for 44 countries with a total of 984 observations.
Findings: Controlling for other possible determinants, we find that the cost of an outpatient visit
is very sensitive to the number of patients seen by providers each day at primary care facilities. Each
1% increase in patient through-put results, on average, in a 27% reduction in the cost per visit (p <
0.0001), which can lead to a difference of up to $30 in the observed costs of an outpatient visit at
primary facilities in the same setting, other factors held constant.
Conclusion: Variability in capacity utilization, therefore, need to be taken into account in cost
estimates, and the paper develops a method by which this can be done.
Background
Making the best use of available resources is vital in devel-
oping countries that are struggling to improve public
health with limited funds. This has become even more
urgent following their ambitious commitment to achieve
the Millenium Development Goals (MDGs) and the real-
ization that funding is not yet sufficient to allow interven-
tions to be scaled up sufficiently to do so [1].
Consequently, demand for information on how much
additional funding would be required to attain the MDGs
has increased, and in response, a number of studies have
tried to estimate the costs countries are likely to face in fur-
ther scaling-up health interventions. Most current esti-
mates are likely to be substantially incorrect, however,
with perhaps the most important problem the assump-
tion that the unit costs of delivering services – for exam-
Published: 13 November 2008
Cost Effectiveness and Resource Allocation 2008, 6:22 doi:10.1186/1478-7547-6-22
Received: 12 February 2008
Accepted: 13 November 2008
This article is available from: />© 2008 Adam et al; licensee BioMed Central Ltd.
This is an Open Access article distributed under the terms of the Creative Commons Attribution License ( />),
which permits unrestricted use, distribution, and reproduction in any medium, provided the original work is properly cited.
Cost Effectiveness and Resource Allocation 2008, 6:22 />Page 2 of 9
(page number not for citation purposes)
ple, the costs per visit to a primary health facility, or the
costs of a day in hospital – will not change as coverage
increases or as more interventions are delivered together
[2,3]. This is most unlikely [4,5].
Increased utilization due to scaling up may have a positive
or negative impact on unit costs, depending on the current
level of capacity utilization at primary facilities. For exam-
ple, in facilities functioning at less than full capacity, unit
costs are likely to fall in the short term with increases in
output, as more services are delivered by existing facilities
– fixed costs are distributed over a larger number of recip-
ients. But in the longer run, unit costs could rise if new
facilities have to be built in sparsely populated areas or it
becomes increasingly difficult to attract the remaining
people in need to seek care. The likely existence of these
"economies" and "diseconomies of scale" means that
information on the current and expected levels of capacity
utilization at different stages of scaling up is key to identi-
fying the true costs of expanding population coverage.
This information is rarely reported or collected, however,
and even if it is available, there are no guidelines on how
to take them into account when estimating unit costs at
primary facilities [2,6].
Another limitation of current analyses is that the cost of
an outpatient visit or inpatient day used to estimate over-
all costs are usually derived from a small number of health
facilities or programs, sometimes only one [7,8]. This is
likely to be misleading given the large variability in capac-
ity utilization across facilities within the same country –
by chance the studied facilities or programs might have
higher, or lower, levels of capacity utilization than other
facilities or programs, leading to an under- or over-esti-
mate of national costs [9,10].
While this is an indisputable theoretical possibility, the
question remains whether it will be important in practice.
The main objective of this paper is to measure the impact
of the level of capacity utilization, in this case patient
load, on the cost of a visit to a primary health care facility.
The paper will examine the extent of the variation in this
cost due to variations in capacity utilization, and will
derive a method that can be used to adjust unit costs for
different levels of capacity use. This work is part of WHO-
CHOICE project with the overall objective to estimate the
costs and health impact of a large number of health inter-
ventions at different levels of efficiency and population
coverage levels. For more detail about WHO-CHOICE
methods and results see />.
Methods
Data
Part of the unit cost data was obtained from a number of
WHO-commissioned studies in a representative sample of
facilities in countries where these data were particularly
scarce, see Appendix 1 for the list of countries. In addition,
data were extracted from manuscripts published in the
available indexed search engines: Medline, Econlit, Social
Science Citation Index, regional Index Medicus, Eldis (for
developing-country data), Commonwealth Agricultural
Bureau (CAB), and the British Library for Development
Studies Databases [7,10-22].
The search terms used were: "costs and cost analysis" and
health centre or the abbreviations HC (health centre) or
PHC (primary health centre) or outpatient care. The lan-
guage sources searched were English, French, Spanish and
Arabic; no Arabic study was found. Additional data were
also obtained from a number of studies in the grey litera-
ture, from such sources as electronic databases, govern-
ment regulatory bodies, research institutions, and
individual health economists known to the authors
[7,8,11-17,19,23-52].
Data from all sources were entered in a standard data-
extraction template, including all variables that may con-
tribute to understanding the relationship between unit
costs and their determinants. The cost per outpatient visit
at primary care facilities was the dependent variable and
Appendix 1: Countries included in the analysis.
Country N Country N
Australia 16 Mongolia* 13
Benin* 39 Morocco* 17
Brazil* 69 Nepal 2
Cameroon* 15 New Zealand 2
Canada 17 Norway 2
China* 40 Pakistan* 145
China (Jiangsu)* 13 Peru 1
China (Shanghai)* 46 Poland 2
Colombia 1 Republic of Korea 11
Ecuador* 67 Russian Federation* 32
Egypt* 35 Sierra Leone 1
Finland 1 Sri Lanka 6
Gambia 2 Sudan* 9
Ghana 5 Sweden 5
India 1 Syrian Arab Republic* 8
Jordan* 12 Thailand* 96
Kenya* 73 Tunisia* 18
Kuwait* 24 Turkey 5
Lebanon* 10 Uganda 5
Lesotho 1 United Arab Emirates* 13
Luxembourg 4 United Kingdom 5
Malawi 5 United Republic of Tanzania* 87
Mexico 2 Viet Nam* 1
Total 984
N = number of health facilities per country for which annual unit
costs were obtained and included in the analysis.
*unit cost data at least partly collected from commissioned studies
Cost Effectiveness and Resource Allocation 2008, 6:22 />Page 3 of 9
(page number not for citation purposes)
the possible explanatory variables included: ownership;
total number of outpatient visits; types of costs included
in the original cost study (e.g., capital, drugs, laboratory
and diagnostics); whether reported costs were based on
costs or charges; the total number of full time equivalent
health care providers at the facility; the reference year for
cost data; the currency; and the methods the costing stud-
ies had used to allocate joint costs. Data on the number of
outpatient visits and the number of providers were used to
calculate the indicator of capacity utilisation – the average
number of visits per provider per day, if this was not read-
ily reported in data sources. The number of providers was
the full time equivalent number of staff, regardless of skill,
who examined or treated patients. Data were available for
44 countries with a total of 984 observations. See Appen-
dix 1 for the list of countries.
In addition, information on aggregate variables reflecting
socio-economic or other characteristics that may explain
part of the variability in unit costs was also collected. The
variables included GDP per capita [53], which has been
used as a proxy for the level of technology [9,10,54-56],
labour productivity [57], and the overall level of demand
for health care in different studies [58]. Population density
[59], which controls for access-related efficiency gains or
losses due to geographical and demographic characteris-
tics of various settings was also included. Finally, dummy
variables indicating whether a country was an oil producer
(i.e. OPEC member) or if the country had a communist
regime either now or in the recent past, were also used. In
the former case, it might be that costs are higher than
would be expected from the level of GDP per capita alone
because of inflows of foreign exchange and foreign work-
ers. In the latter, cost levels might be lower than expected
due to the historical ability of these countries to control
prices and wages.
Prior to the analysis, consistency checks were performed
and questionable data queried with the study authors, or
omitted if explanations could not be found.
Finally, costs were converted to 2000 US dollars using
GDP deflators and official exchange rates [60]. STATA
software was used for analysis [61].
Data imputation
Before model selection, potential variables for inclusion
in the analysis were explored for missing data. Only two
variables were concerned, the number of visits per pro-
vider per day and the total number of annual visits, where
data was missing in 70% and 18% of the observations,
respectively. Although the percent of missing data in the
former was relatively high, we decided that the bias intro-
duced by restricting the analysis to those observations
with complete data would be larger than that caused by
imputing missing data combined with appropriate uncer-
tainty analysis [62]. A requirement for using imputation
methods is that data are missing at random, which we
believe is the case here, since the main reason data are not
reported is that it is not yet standard practice in the costing
literature.
Multiple imputation techniques are the most suitable for
our case, where the observed values for other settings, as
well as relevant covariates, are used to predict a distribu-
tion of likely values for the unobserved data. It also allows
subsequent analysis to take account of the level of uncer-
tainty surrounding each imputed value [63-66]. The statis-
tical model used for multiple imputation is the joint
multivariate normal distribution, using Amelia software
[64,67-69]. One of its main advantages is that it produces
reliable estimates of standard errors, and through the
introduction of random error into the imputation proc-
ess, it considerably reduces potential biases in the
imputed data [63]. Detail of the estimation process and
handling of the model output can be found elsewhere
[10].
Model specification
Empirical cost function studies – i.e. studies that relate
unit costs to the level of output – have been mainly inter-
ested in estimating hospital costs. None to our knowledge
have focused on primary care facilities. We followed the
basic approach used to estimate hospital cost functions by
Lombard et al (1991) and Adam et al (2003) and (2006)
[9,10,70]. The relationship between the cost per visit and
the level of capacity use, as well as other possible determi-
nants, was explored using multiple regression analysis –
Ordinary Least Squares (OLS) was used. The dependent
variable and all continuous explanatory variables
explored in this model were transformed into natural log-
arithms, as this specification resulted in a residual plot
that best approximated a normal distribution – a require-
ment of OLS regressions. Natural logs have the added
advantage that coefficients can be readily interpreted as
elasticities, offering a straightforward measure of the
impact of capacity utilization on costs, the main focus of
this analysis [71,72]. In addition, robust estimation meth-
ods were used, using the "robust" command in STATA
[61], to control for clustering resulting from the inclusion
of multiple observations per country in the study [73].
The functional specification of the OLS regression model
may be written as:
where ln UC
i
is the natural log (ln) of cost per outpatient
visit in 2000 US $ in the ith facility;
α
0
and
α
1 n
are the
ln ,UC e i n
ii
i
n
ii
=+ + =…
=
∑
aa
0
1
1X
(1)
Cost Effectiveness and Resource Allocation 2008, 6:22 />Page 4 of 9
(page number not for citation purposes)
estimated parameters; the X
i
are the explanatory variables
described earlier, transformed into natural logarithms for
continuous variables [60]; and e denotes the error term.
The cost of an outpatient visit is expected to be positively
correlated with GDP per capita; the inclusion of capital,
ancillary (laboratory and other diagnostic tests) or drug
costs in the original costing; and whether the country pro-
duced oil. We expected costs to be negatively correlated
with the number of visits per provider per day, our varia-
ble of interest, and population density; and lower in pub-
lic compared to private facilities and in countries that had
been under communist regimes.
Interaction terms were also tested, such as the interaction
between capacity utilization and GDP per capita. Only
variables that were consistently significant in the different
models were included in the final model that was selected
based on econometric grounds.
Finally, to estimate the value of the unit cost per outpa-
tient visit that would be expected for given values of the
independent variables, the estimated dependent variable
was re-transformed from logarithms to natural units using
the Duan smearing factor [74]. The Duan smearing factor
is used because one of the implicit assumptions of using
log-transformed models is that the least-squares regres-
sion residuals in the transformed space are normally dis-
tributed. In this case, back-transforming to estimate unit
costs gives the median and not the mean. The smearing
method described by Duan (1983) corrects for the back
transformation bias [74]. This was done by multiplying
the anti log of the product of the model by 1.45, the
smearing correction factor derived from our model.
Model-fit
Various regression diagnostics were used to judge the
goodness-of-fit of the model. They included residual plots
of the residual versus fitted values, "hettest" to test heter-
oskedasticity of the model variables, the variance inflation
factors to test for multicollinearity, and estimates of
adjusted R square and F statistics of the regression model
[61].
Sensitivity analysis
Sensitivity of the results to imputation of missing data was
explored by running the models with and without impu-
tation.
Results
Table 1 shows the variable names, description and results
of the model with the best statistical fit. The adjusted R-
square of the combined regressions from the five imputed
datasets is 0.52, with an F statistic of 258 (p < 0.0001). All
other regression diagnostic showed a good fit; the vari-
ance inflation factors ranged between 1.27 and 1.30 (VIF
more than 20 indicates multicollinearity) [61] and the
residual plots had a mean of zero with no specific pattern
of distribution.
The signs of the coefficients are consistent with our
hypotheses; the cost per visit is positively correlated with
GDP per capita and the inclusion of capital costs, [10]
while the number of visits per provider per day; commu-
nist or ex-communist countries; and public as opposed to
private ownership of facilities, are associated with a lower
cost per visit. The other independent variables did not
have a statistically significant impact on costs for our data
set. The elasticity of cost per visit to changes in GDP per
capita, while positive, is less than one (<0.0001). This
means that while outpatient costs per visit are higher in
countries with higher levels of GDP per capita, they
increase at a slower rate than the rise in GDP. This is con-
sistent with previous findings of the relationship between
unit cost of hospital care and GDP per capita [10].
In terms of capacity utilization, the results show that each
1% increase in the number of patients seen per provider
per day is associated with 27% reduction in the cost per
visit, everything else kept constant (<0.0001).
Table 1: Ordinary Least square regression results, using robust estimation methods, N = 984
Variable Description β Coef SE T P
Ln GDP per capita Natural log of GDP per capita in 2000 US $ 0.6219 0.030 21.08 <0.001
Ln visits per provider per day Natural log of number of visits per provider per day -0.2756 0.039 -7.16 <0.001
Capital costs Dummy variable for inclusion of capital costs. Included = 1 0.7759 0.073 10.70 <0.001
Communist Dummy for communist and Ex communist -0.466 0.109 -4.26 <0.001
Public Dummy for public facility. Public = 1 -0.2541 0.109 -2.34 0.019
Constant -2.9060 0.285 -10.19 <0.001
Dependent variable: Natural log cost per outpatient visit in 2000 US $
Adjusted R
2
= 0.52
F statistic = 258
p of F statistic < 0.00001
Cost Effectiveness and Resource Allocation 2008, 6:22 />Page 5 of 9
(page number not for citation purposes)
The sensitivity of the results to the imputation of missing
data was explored. The signs and order of magnitude of
the coefficients were stable with or without amputation,
see Table 2.
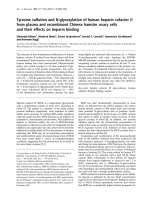
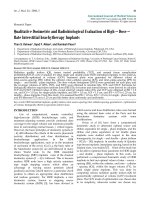
Figure 1 plots the predicted values from the model against
the unit cost data and the level of GDP per capita. The two
lines represent the predicted values of the cost per visit (in
natural logs), estimated for a public facility with an aver-
age capacity use set arbitrarily at 25 visits per provider per
day, including capital costs and estimated separately for
communist and non-communist countries. The figure
confirms that the model has a reasonable fit with the data
and illustrates the considerable variability in the observed
unit costs within a single country (each column of dots
represents a country with a specific GDP per capita).
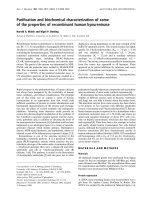
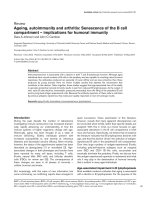
To isolate the impact of the level of capacity utilization on
unit costs, we re-estimated the predicted values allowing
the capacity level to vary but keeping all other variables
constant, including GDP per capita. This is illustrated in
Figure 2, which shows the relationship between changes
in capacity utilization (x axis) and the level of unit cost per
outpatient visit (Y axis), estimated for three settings with
different income levels, set at US $1000, $5000 and
$20000 for illustration purposes. The figure shows that
changes in capacity use can lead to a difference of between
$5 and $30 in the estimated costs of an outpatient visit.
The estimated costs of scaling up interventions could,
therefore, be substantially different depending on the
level of capacity utilization that happened to be associ-
ated with the data used for the costs of outpatient care.
Discussion and policy relevance
This paper presents critical evidence on the extent of vari-
ability in the cost of a patient visit at primary facilities
within and across countries, and the proportion that can
be explained by variations in patient load as well as other
determinants. While a substantial portion of the observed
variability could be explained by the specified determi-
nants, some unexplained variability remained, possibly
linked to variables that we could not measure including
quality of care, case mix and salary differentials for staff
working in remote areas. These variables are likely to
explain part of the variability in the observed unit cost
data but we did not have the data to explore this.
There are other limitations of this type of analysis that
must also be considered when interpreting the results.
While the model incorporates a very extensive database
on unit costs, much larger than has previously been avail-
able, it is always preferable to include more data points. In
this case, increasing the number of countries for which
observations were available, and having more informa-
tion on possible explanatory variables, would increase the
explanatory power of the model and the validity of the
results for extrapolation to a wider number of countries.
We also recognize that the mathematical specification of
the model we report here, the log-log form, does not allow
the identification of diseconomies of scale if they exist.
Cross country studies like this typically use this functional
form, which can be interpreted as the downward sloping
part of a long-run cost curve. It is possible, as we stated in
the introduction, that some countries will face disecono-
mies of scale if, for example, they have to build new health
facilities in isolated areas, and these facilities are not fully
utilized. In that case, the higher unit costs of the new facil-
ities can still be estimated from our model – by using the
country's observed GDP per capita, for example, and the
lower level of capacity utilization associated with the
expansion of facilities. Estimating the likely capacity utili-
zation rates associated with the expansion of health facil-
ities to increasingly remote areas is, of course, complex
but some experience exists using spatial models to iden-
tify the population's physical accessibility to different pos-
sible locations of new health facilities [75].
Bearing in mind these limitations, we can still be confi-
dent of a number of important conclusions. Firstly, the
results show that unit costs are very sensitive to the
number of patients seen by providers each day – each 1%
Table 2: Ordinary Least square regression results, using robust estimation methods – model without imputation of missing data, N =
250
Variable Description β Coef SE T P
Ln GDP per capita Natural log of GDP per capita in 2000 US $ 0. 847 0.031 27.12 <0.001
Ln visits per provider per day Natural log of number of visits per provider per day -0.32 0.06 -5.33 <0.001
Capital costs Dummy variable for inclusion of capital costs. Included = 1 0.14 0.10 1.34 0.182
Communist Dummy for communist and Ex communist -1.16 0.17 -6.64 <0.001
Public Dummy for public facility. Public = 1 -0.39 0.24 -1.59 0.114
Constant -4.15 0.33 -12.50 <0.001
Dependent variable: Natural log cost per outpatient visit in 2000 US $
Adjusted R
2
= 0.658
F statistic = 152.40
p of F statistic < 0.00001
Cost Effectiveness and Resource Allocation 2008, 6:22 />Page 6 of 9
(page number not for citation purposes)
increase in patient through-put means, on average, a 27%
reduction in the cost per outpatient visit. These variations
in capacity utilization can make a difference of up to $30
in the costs per outpatient visit at primary facilities in the
same setting, other factors held constant.
This means that estimates of the costs of scaling up, and
the resulting estimates of financial needs, that are based
on outpatient visit costs taken from a single, or a few stud-
ies, could be markedly wrong. These studies could well
have capacity utilisation rates that are atypical of the
country as a whole. Moreover, they will also be wrong if
they do not allow the cost of an outpatient visit to change
as coverage increases. Because most of the studies of the
costs of scaling up to meet the MDGs do not even report
the information on capacity utilization used to derive
their outpatient costs estimates, readers can have little
confidence that the overall costs that they estimate are
even approximately correct.
There are two additional practical uses of the analysis
reported in this paper. The first is to apply the model to
analyse and adjust locally available unit cost estimates,
taking into account differences in capacity use and other
determinants. The second is to use the results of the model
to estimate the likely unit cost per visit at different levels
of capacity use in settings where information on unit costs
is not available. There have been several applications of
the latter, including estimating the cost-effectiveness of a
large set of interventions as part of the WHO-CHOICE
[76,77] and the Disease Control Priorities (DCP) projects
[78]; and estimating the cost of scaling up health interven-
tions to meet universal coverage of key interventions to
address major disease burden such HIV/AIDS [62,79],
and interventions to improve maternal and child health
[80-82].
Finally, our findings have important implications for the
transferability and validity of costing and cost-effective-
Predicted values (regression lines) for communist and non-communist countries plotted against the natural log of GDP per capita (X axis)Figure 1
Predicted values (regression lines) for communist and non-communist countries plotted against the natural
log of GDP per capita (X axis). (Y-axis shows the raw data for cost per visit in natural logs) N = 984.
Cost Effectiveness and Resource Allocation 2008, 6:22 />Page 7 of 9
(page number not for citation purposes)
ness results. General policy decisions should not be based
on the results of costing studies that do not report capacity
utilization or that base the analysis of the cost of scaling
up on current costs of providing care.
Competing interests
The authors declare that they have no competing interests.
Authors' contributions
TA constructed the model, performed the analysis and
drafted the manuscript. SE and BJ contributed to the selec-
tion of variables and model applications. DE participated
in the development of the methodology, selection of the
model and interpretation of the results. All authors con-
tributed to the writing, and read and approved the final
manuscript.
Acknowledgements
The authors express their gratitude to Carolyn Kakundwa and Margaret
Squadrani for their work in compiling and processing the unit cost data nec-
essary for this exercise; to Mahmoud L. Salem, Bian Ying, Viroj Tangcha-
roensathien, Walaiporn Patcharanarumol, Jiangbo Bao, Aparnaa
Somanathan, Elena Potaptchik and Ruth Lucio and Benjamin Nganda for
their efforts in gathering cost data at the country level; and Tessa Tan
Torres for her input in the development of the methods used. The work
represents the views of the authors and not necessarily those of the organ-
ization they represent.
Impact of patient load on unit cost per visit in three settingsFigure 2
Impact of patient load on unit cost per visit in three settings.
0 10 20 30 40
0 50 100 150
Visits per provider per day
country with GDP pc of $1000 country with GDP pc of $5000
country with GDP pc of $20000
Y-axis shows the expected cost per visit in US$ 2000 in three countries with different levels of GDP per capita
Cost Effectiveness and Resource Allocation 2008, 6:22 />Page 8 of 9
(page number not for citation purposes)
References
1. Working Group on Countdown to 2015: Child Survival. Tracking
progress in child survival: the 2005 report. New York,
UNICEF. Countdown to 2015; 2005.
2. Johns B, Torres TT: Costs of scaling up health interventions: a
systematic review. Health Policy Plan 2005, 20:1-13.
3. Vassall A, Compernolle P: Estimating the resource needs of scal-
ing-up HIV/AIDS and tuberculosis interventions in sub-Saha-
ran Africa: a systematic review for national policy makers
and planners. Health Policy 2006, 79:1-15.
4. Mansley EC, Dunet DO, May DS, Chattopadhyay SK, McKenna MT:
Variation in average costs among federally sponsored state-
organized cancer detection programs: economies of scale?
Med Decis Making 2002, 22:S67-S79.
5. Adam T, Amorim DG, Edwards S, Amaral J, Evans DB: Capacity
constraints to the adoption of new interventions: consulta-
tion time and the integrated management of childhood ill-
ness in Brazil. Health Policy Plan 2004, 20:i49-i57.
6. Adam T, Evans DB, Koopmanschap MA: Cost-effectiveness analy-
sis: can we reduce variability in costing methods? Int J Technol
Assess Health Care 2003, 19:407-420.
7. Brooks RG: Cost of selected health institutions in the Central
Region 1972–1973. Ghana Med J 1975, 14:209-214.
8. Ojo K: Economic and management perspectives of Windhoek state hospi-
tal complex Windhoek: Ministry of Health and Social Services; 1995.
9. Adam T, Evans DB: Determinants of Variation in the Cost of
Inpatient Stays versus Outpatient Visits in Hospitals. A
Multi-Country Analysis. Soc Sci Med 2006, 63:1700-1710.
10. Adam T, Evans DB, Murray CJL: Econometric estimation of
country-specific hospital costs. Cost-effectiveness and Resource
Allocation 2003, 1:3.
11. Fox-Rushby JA, Foord F: Costs, effects and cost-effectiveness
analysis of a mobile maternal health care service in West
Kiang, The Gambia. Health Policy 1996, 35:123-143.
12. Ojo K, Foley J, Renner A, Kamara FM: Cost analysis of health serv-
ices in Sierra Leone. A case study of Connaught hospital and
Waterloo Community Health Centre. Annex III. Sierra
Leone, Ministry of Health; 1995.
13. Pepperall J, Garner P, Fox-Rushby J, Moji N, Harpham T: Hospital or
health centre? A comparison of the costs and quality of
urban outpatient services in Maseru, Lesotho. Int J Health Plann
Manage 1995, 10:59-71.
14. Department of Health: The new NHS – 2001 reference costs London:
Department of Health; 2001.
15. Department of Planning, Ministry of Health and Population, Data for
Decision Making, Harvard School of Public Health, University of Cal-
ifornia, Berkeley, et al.: Cost analysis and efficiency indicators
for health care: report number 4 summary output for 19 pri-
mary health care facilities in Alexandria, Bani Suef and Suez,
1993–1994. Boston, Harvard University Press; 1997.
16. Waters H, Abdallah H, Santillan D: Application of activity-based
costing (ABC) for a Peruvian NGO healthcare provider. Int J
Health Plann Manage 2001, 16:3-18.
17. Omar AO, Komakech W, Hassan AH, Singh CH, Imoko J: Costs,
resource utilisation and financing of public and private hospi-
tals in Uganda. East Afr Med J 1995, 72:591-598.
18. Anand K, Kapoor SK, Pandav CS: Cost analysis of a primary
health centre in northern India. Natl Med J India 1993,
6:160-163.
19. Robertson RL: Review of literature on costs of health services
in developing countries. PHN Technical Note 85-21. Wash-
ington, Population, Health and Nutrition Department, World Bank;
1985.
20. Commonwealth Department of Health and Aged Care: Medicare
benefits schedule (1 Novemmber 2002). Health Access and
Financing Division, Commonwealth Department of Health
and Aged Care. Canberra, ACT, Australia, Australian Department
of Health and Ageing; 2002.
21. OECD: Health at a glance – OECD indicators 2005 Paris: OECD; 2005.
22. Salisbury C, Chalder M, Manku-Scott T, Nicholas R, Desve T, Noble
S, et al.: The national evaluation of NHS walk-in centres: final
report. Bristol, UK, University of Bristol; 2002.
23. Kirigia JM, Snow RW, Fox-Rushby J, Mills A: The cost of treating
paediatric malaria admissions and the potential impact of
insecticide-treated mosquito nets on hospital expenditure.
Trop Med Int Health 1998, 3:145-150.
24. Mitchell M, Thomason J, Donaldson D, Garner P: The cost of rural
health services in Papua New Guinea. P N G Med J 1991,
34:276-284.
25. Patcharanarumol W: A study of unit cost of out-patient and in-patient
service of Khon Kaen Hospital in the fiscal year 1996 Bangkok: Chu-
lalongkorn University; 1997.
26. Huff-Rousselle M: Dzongkhag costing study for Tashigang Dzongkhag
Royal Government of Bhutan: Department of Health Services, Minis-
try of Social Services; 1992.
27. Rannan-Eliya R, Somanathan A: Bangladesh facility efficiency sur-
vey. Dhaka, Health Economics Unit, Ministry of Health and Family
Welfare, Government of the People's Republic of Bangladesh and
Health Policy Programme, Institute of Policy Studies of Sri Lanka.
Working Paper No. 16; 1999.
28. Musau S, Kilonzo M, Newbrander W: Development of a revised
FIF user fee schedule. Report July 1996. Kenya Health Care
Financing Project: Contract No. 623-0245-C-00-0040-00.
Boston, Management Sciences for Health; 2000.
29. Hospital services in Australia: Access and financing. Canberra,
Department of Health, Housing and Community Services. National
Health Strategy Issues Paper No. 2; 1991.
30. Shepard DS, Carrin G, Nyandagazi P: Household participation in
financing of health care in government health centres in
Rwanda. In Health economics research in developing countries Edited
by: Lee K, Mills A. Oxford University Press; 1990:140-164.
31. Flessa S: The costs of hospital services: a case study of Evan-
gelical Lutheran Church hospitals in Tanzania. Health Policy
Plan 1998, 13:397-407.
32. Ministry of Health The Gambia, World Health Organization: Cost
analysis of the health care sector in The Gambia. Volume 1.
Ministry of Health; 1995.
33. Puglisi R, Bicknell WJ: Functional expenditure analysis. Vol. I
Final Report for Queen Elizabeth II Hospital, Maseru,
Lesotho. Boston University, Health Policy Institute; 1990.
34. Wong H: Cost analysis of Niamey hospital. USAID Project
No. 683-0254. Bethesda, MD, Abt Associates Inc; 1989.
35. De Virgilio G, Haile M, Lemma A, Mariani D: Technical and eco-
nomic efficiency of the Asella regional hospital in Ethiopia.
La Medicina Tropicale nelle Cooperazione allo Sviluppo 1990, 6:1-7.
36. Hansen K, Chapman G, Chitsike I, Kasilo O, Mwaluko G: The costs
of HIV/AIDS care at government hospitals in Zimbabwe.
Health Policy Plan 2000, 15:432-440.
37. Carey K, Burgess JF Jr: On measuring the hospital cost/quality
trade-off. Health Econ 1999, 8:509-520.
38. Barnum H, Kutzin J: Public hospitals in developing countries: resource use,
cost, financing Baltimore: The Johns Hopkins University Press for the
World Bank; 1993.
39. Raymond SU, Lewis B, Meissner P, Norris J: Financing and costs of
health services in Belize. HCFLAC Research Report no. 2.
Stony Brook, State University of New York; 1987.
40. Lewis MA, La Forgia GM, Sulvetta MB: Measuring public hospital
costs: empirical evidence from the Dominican Republic. Soc
Sci Med 1996, 43:221-234.
41. Olave M, Montano Z: Unit cost and financial analysis for the
hospital 12 de Abril in Bolivia. Small Applied Research
Report No. 11. Bethesda, Abt Associates Inc; 1993.
42. Gill L, Percy A: Hospital costing study Glendon Hospital –
Montserrat. Report No.15. Organisation of Eastern Caribbean
States, Health Policy & Management Unit; 1994.
43. Russell SS, Gwynne G, Trisolini M: Health care financing in St
Lucia and costs of Victoria Hospital. HCFLAC Research
Report no. 5. Stony Brook, State University of New York; 1988.
44. Snow J: Papua New Guinea: health sector financing study
project. Final Report – volume II hospital cost study. Pre-
pared for the Papua New Guinea Department of Health under con-
tract with the Asian Development Bank, TA No. 1091-PNG; 1990.
45. Chan S: Unit cost estimation for outpatient and inpatient departments in
Nakleoung District Hospital, Cambodia Bangkok: Chulalongkorn Univer-
sity; 1997.
46. Banks DA, As-Sayaideh ASK, Shafei ARSH, Muhtash A: Implementing
hospital autonomy in Jordan: an economic cost analysis of Princess Raya
Hospital Bethesda, MD: The Partners for Health Reformplus Project,
Abt Associates Inc; 2002.
47. Department of Planning, Ministry of Health and Population, Data for
Decision Making, Harvard School of Public Health, University of Cal-
ifornia, Berkeley, et al.: Cost analysis and efficiency indicators
Publish with BioMed Central and every
scientist can read your work free of charge
"BioMed Central will be the most significant development for
disseminating the results of biomedical research in our lifetime."
Sir Paul Nurse, Cancer Research UK
Your research papers will be:
available free of charge to the entire biomedical community
peer reviewed and published immediately upon acceptance
cited in PubMed and archived on PubMed Central
yours — you keep the copyright
Submit your manuscript here:
/>BioMedcentral
Cost Effectiveness and Resource Allocation 2008, 6:22 />Page 9 of 9
(page number not for citation purposes)
for health care: report number 1 summary output for Bani
Suef General Hospital, 1994-1994. Boston, Harvard University
Press; 1997.
48. Department of Planning, Ministry of Health and Population, Data for
Decision Making, Harvard School of Public Health, University of Cal-
ifornia, Berkeley, et al.: Cost analysis and efficiency indicators
for health care: report number 2 summary output for Suez
General Hospital, 1993–1994. Boston, Harvard University Press;
1997.
49. Department of Planning, Ministry of Health and Population, Data for
Decision Making, Harvard School of Public Health, University of Cal-
ifornia, Berkeley, et al.: Cost analysis and efficiency indicators
for health care: report number 3 summary output for El
Gamhuria General Hospital, 1993–1994. Boston, Harvard Uni-
versity Press; 1997.
50. Robertson RL, Barona B, Pabon R: Hospital cost accounting and
analysis: the case of Candelaria. J Community Health 1977,
3:61-79.
51. Jorbenadze A, Zoidze A, Gzirirshvili D, Gotsadze G: Health reform
and hospital financing in Georgia. Croat Med J 1999, 40:221-236.
52. Mills AJ: The cost of the district hospital. A case study from
Malawi. Washington, D.C, World Bank. WPS 742; 1991.
53. World Bank: World Development Indicators 2002 Washington, D.C:
World Bank; 2002.
54. Liu X, Hsiao WC: The cost escalation of social health insurance
plans in China: its implication for public policy. Soc Sci Med
1995, 41:1095-1101.
55. Newhouse JP: Medical care costs: how much welfare loss? J
Econ Perspect 1992, 6:3-21.
56. Peden EA, Freeland MS: Insurance effects on US medical spend-
ing (1960–1993). Health Econ 1998, 7:671-687.
57. Warner AM: International wage determination and globalization Revised
version of a paper presented at the NBER Universities Research Con-
ference, Labor in the Global Economy, May 2001; 2002.
58. Xu K, Evans DB, Kawabata K, Zeramdini R, Klavus J, Murray CJ:
Household catastrophic health expenditure: a multicountry
analysis. Lancet 2003, 362:111-117.
59. United Nations (Population Division): World population pros-
pects – the 2004 revision. New York, United Nations; 2005.
60. World Bank:
World Development Indicators 2000 Washington, DC:
World Bank; 2000.
61. Stata 8: Stata Statistical Software: Release 8 College Station, TX: Stata
Corporation; 2003.
62. Little JA, Rubin DB: Statistical analysis with missing data New York: John
Wiley & Sons; 1987.
63. Allison PD: Multiple imputation for missing data. A cautionary
tale. Sociological Methods & Research 2000, 28:301-309.
64. Honaker J, Joseph A, King G, Scheve K, Singh N: Amelia: A Program for
Missing Data (Windows Version) Cambridge, MA: Harvard University;
1999.
65. Lu K, Tsiatis AA: Multiple imputation methods for estimating
regression coefficients in the competing risks model with
missing cause of failure. Biometrics 2001, 57:1191-1197.
66. Patrician PA: Multiple imputation for missing data. Res Nurs
Health 2002, 25:76-84.
67. King G, Honaker J, Joseph A, Scheve K: List-wise deletion is evil: what to
do about missing data in political science Paper presented at the Annual
Meeting of the American Political Science Association, Boston; 1998.
68. King G, Tomz M, Wittenberg J: Making the most of statistical
analyses: improving interpretation and presentation. Am J Pol
Sci 2000, 44:347-361.
69. King G, Honaker J, Joseph A, Scheve K: Analyzing incomplete
political science data: An alternative algorithm for multiple
imputation. Am Polit Sci Rev 2000.
70. Lombard CJ, Stegman JC, Barnard A: Modelling net expenditure
of hospitals in the Cape Province. S Afr Med J 1991, 80:508-510.
71. Gujarati DN: Basic econometrics 3rd edition. New York: McGraw-Hill,
Inc; 1995.
72. Breyer F: The specification of a hospital cost function. A com-
ment on the recent literature. J Health Econ 1987, 6:147-157.
73. Greene WH: Econometric analysis 4th edition. Upper Saddle River, NJ:
Prentice Hall; 2000.
74. Duan N: Smearing estimate: a nonparametric retransforma-
tion method. JASA 1983, 78:605-610.
75. Ebener S, El Morjani Z, Ray N, Black M: Physical accessibility to
health care: from isotropy to anisotropy. Geneva, WHO; 2005.
76. Evans D, Edejer TT, Adam T, Lim S, the WHO-CHOICE MDG team:
Achieving the Millennium Development Goals for Health:
methods to assess the costs and health effects of interven-
tions for improving health in developing countries. BMJ
2005:1137-1140.
77. Evans D, Lim S, Adam T, Tan-Torres Edejer T, the WHO-CHOICE
MDG team: Achieving the Millennium Development Goals for
Health: Evaluation of current strategies and future priorities
for improving health in developing countries. BMJ
2005:1457-1461.
78. Disease Control Priorities Project: Disease control priorities in develop-
ing countries Second edition. New York: Oxford University Press;
2006.
79. Gutierrez JP, Johns B, Adam T, Bertozzi S, Edejer TT-T, Greener R,
et al.: Achieving the WHO/UNAIDS antiretroviral treatment
3 by 5 goal: what will it cost? The Lancet 2004, 364:63-64.
80. Bryce J, Black RE, Walker N, Bhutta ZA, Lawn JE, Steketee RW: Can
the world afford to save the lives of 6 million children each
year? Lancet 2005, 365:2193-2200.
81. Stenberg K, Johns B, Scherpbier R, Edejer TT: A financial road map
to scaling up essential child-health interventions in 75 coun-
tries. Bull World Health Organ 2007, 85:305-314.
82. Johns B, Sigurbjörnsdóttir K, Fogstad H, Zupan J, Mathai M, Edejer TT:
Estimated global resources needed to attain universal cover-
age of maternal and newborn health services. Bull World Health
Organ 2007, 85:256-263.