Báo cáo y học: "A health economic model for evaluating a vaccine for the prevention of herpes zoster and post-herpetic neuralgia in the UK" ppsx
Bạn đang xem bản rút gọn của tài liệu. Xem và tải ngay bản đầy đủ của tài liệu tại đây (932.68 KB, 14 trang )
Moore et al. Cost Effectiveness and Resource Allocation 2010, 8:7
/>Open Access
RESEARCH
BioMed Central
© 2010 Moore et al; licensee BioMed Central Ltd. This is an Open Access article distributed under the terms of the Creative Commons
Attribution License ( which permits unrestricted use, distribution, and reproduction in
any medium, provided the original work is properly cited.
Research
A health economic model for evaluating a vaccine
for the prevention of herpes zoster and
post-herpetic neuralgia in the UK
Lee Moore
1
, Vanessa Remy
2
, Monique Martin*
1
, Maud Beillat
2
and Alistair McGuire
3
Abstract
Background: A live-attenuated vaccine aimed at preventing herpes zoster (HZ) and its main complication, post-
herpetic neuralgia (PHN) is available in Europe for immunocompetent adults aged 50 years and more. The study
objective is to assess the cost effectiveness of a vaccination program for this population in the UK.
Methods: A state-transition Markov model has been developed to simulate the natural history of HZ and PHN and to
estimate the lifetime effects of vaccination in the UK. Several health states are defined including good health, HZ, PHN,
and death. HZ and PHN health states are further divided to reflect pain severity.
Results: The model predicts that a vaccination strategy for those aged over 50 years would lead to an incremental
cost-effectiveness ratio of £13,077 per QALY gained from the NHS perspective, when compared to the current strategy
of no vaccination. Age-group analyses show that the lowest ICERs (£10,984 and £10,275 for NHS) are observed when
vaccinating people between 60-64 and 65-69 years of age. Sensitivity analyses showed that results are sensitive to the
duration of vaccine protection, discount rate, utility decrements and pain severity split used.
Conclusions: Using the commonly accepted threshold of £30,000 per QALY gained in the UK, most scenarios of
vaccination programmes preventing HZ and PHN, including the potential use of a repeat dose, may be considered
cost-effective by the NHS, especially within the 60 to 69 age-groups.
Background
In our aging society, diseases whose prevalence rises with
age are of increasing significance. The varicella zoster
virus (VZV) causes chickenpox as the primary infection.
Reactivation of the dormant virus in the dorsal root gan-
glia of individuals having had a primary infection can
occur, causing herpes zoster (HZ) or "shingles". The life-
time risk of suffering from HZ is 25% [1]. HZ incidence
increases sharply with age, roughly doubling in each
decade past the age of 50 years [2]. Normal age-related
decrease in varicella zoster-specific cell-mediated immu-
nity is thought to account for this increased incidence of
VZV reactivation. The symptoms of HZ include numb-
ness, itching and pain during the prodromal phase
(before the rash onset), followed by painful unilateral
vesicular eruptions on the skin. The pain and cutaneous
eruptions usually subside after 3-4 weeks [3].
In about 20% to 25% of HZ cases [4], pain can persist
for months or years after the cutaneous eruption has
healed. Depending on the definition used, pain occurring
or persisting at least 1 or 3 months after rash onset is
termed post-herpetic neuralgia (PHN). While there is no
international consensus on the definition of PHN, it is
increasingly commonly accepted that PHN is considered
to be present if pain persists for more than 3 months or
more after rash onset [5,3,6]. With age as its primary risk
factor[4], the incidence of PHN is expected to increase in
an ageing population. Many patients with PHN go on to
develop severe physical, occupational and social disabili-
ties as a consequence of the enduring pain [4].
A new live attenuated vaccine (Zostavax
®
) against vari-
cella zoster virus infection is indicated in Europe for the
prevention of HZ and HZ-related PHN from the age of
50. The efficacy of this new vaccine has been tested in a
* Correspondence:
1
i3 Innovus, Uxbridge, UK
Full list of author information is available at the end of the article
Moore et al. Cost Effectiveness and Resource Allocation 2010, 8:7
/>Page 2 of 14
randomized, double-blind, placebo-controlled trial (Shin-
gles Prevention Study, SPS) [6]. This study, involving
38,546 immunocompetent patients aged 60 years and
older, reported that vaccination reduced the incidence of
HZ by 51.3% and reduced the severity of pain when HZ
occurred in vaccinated individuals. Progression to PHN
was reduced by 66.5%, with a trend toward greater effi-
cacy for PHN of longer duration [6]. In addition, the
safety and immunogenicity of the vaccine in the 50-59 age
groups has been explored in two clinical trials which
showed that the vaccine was well tolerated among
patients aged 50 years and older and induced an immu-
nogenic response not inferior to that of subjects 60 and
older and thereby provided an immunological bridge to
vaccine efficacy demonstrated in the SPS (ref Oxman,
2005) [7,8].
In order to estimate the potential effectiveness and
cost-effectiveness of a vaccination programme against
HZ and PHN in the UK, we have used a cohort model
that strikes a balance between real-life individual variabil-
ity and the more formal structures required for model-
ling. The model aims to accurately represent the
epidemiology of HZ and PHN. In addition it aims to
quantify the lifetime health benefits and economic effects
of vaccination in the UK immunocompetent population
aged 50 and over.
Methods
A Markov model was developed to compare two policies:
the implementation of a vaccination policy in the UK,
where a predetermined vaccine coverage rate is achieved
for each age group at the start of the model, and the cur-
rent policy in the UK of no vaccination. Under these two
policies, the following outcomes were compared for the
lifetime: HZ cases and PHN cases, quality-adjusted life-
years (QALYs) and total costs. These outcomes resulted
in the calculations of incremental cost-effectiveness
ratios (ICERs), including cost per QALY gained, cost per
HZ case avoided, and cost per PHN case avoided, and the
number needed to vaccinate (NNV) to prevent one
occurrence of HZ or PHN. Both a NHS (National Health
Service) perspective and a societal perspective were con-
sidered. The NHS perspective includes all health care
related expenses, as the national health care system is
tax-funded and universally accessible. The societal per-
spective includes in addition to healthcare expenses, pro-
ductivity costs due to time off work, but no co-payments.
Model features
This model utilises a Markov process to simulate the life-
time incidence and consequences of HZ among a popula-
tion aged 50 and over, corresponding to the therapeutic
indication of the HZ vaccine Zostavax
®
. The model was
developed in Microsoft Excel 2003. The population is
analysed as separate 5 year age cohorts (i.e. the 50-54 year
old population is first analysed over its lifetime, then the
55-59 year old population, etc.). The state-transition
Markov model describes several health states including
healthy (i.e. no HZ symptoms), HZ, PHN, and death. HZ
and PHN health states are further divided into different
pain severity levels. Recurrent HZ and the subsequent
neuropathic pain are also allowed states, but are con-
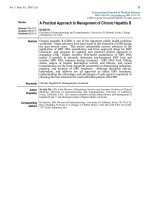
strained to a one-time only recurrent episode. Figure 1
shows the potential health states, with arrows indicating
possible transitions between states. The model runs in
Markov cycles of one month to represent the average
duration of an episode of HZ. Within each 1 month cycle,
the cohort members may remain in their current health
state or transit to one of the allowable states. Transitions
are governed by a matrix of probability values. With each
successive cycle, an increasing proportion of the cohort
moves through the HZ and PHN states and eventually to
death. The model runs through sufficient cycles until the
entire cohort has died.
Movement from healthy to "HZ" is based on monthly
age-specific HZ incidence rates. Individuals are allocated
to one of the four HZ pain severity levels (no, mild, mod-
erate and severe pain). In the following month, a propor-
tion of these HZ patients will develop PHN. The
literature indicates that patients have a higher risk of
developing PHN if they experience severe pain during
HZ. To reflect the increased (decreased) odds of develop-
ing PHN by patients suffering from a severe (mild) HZ
pain episode relative to moderate HZ pain information
from the literature was used by applying odds ratios of
2.39 for severe pain and 0.88 for mild pain [9]. Hence,
patients with severe (mild) pain are 2.39 (0.88) times
more (less) likely to develop PHN than patients with
moderate level of pain.
New PHN patients were distributed over three initial
pain severity levels (mild, moderate, or severe) deter-
mined at diagnosis. It was assumed that the PHN-related
pain diminishes over time and eventually ceases. There-
fore, an individual can either remain in the same state or
transition to a less severe PHN pain state each month. All
must go through the mild PHN pain state to attain a
healthy (post-zoster) state. Consequently, the average
duration of PHN depends on the initial PHN pain split of
the population (as it will take longer for 'severe' patients
to return to health than for 'mild' patients) and on the
transition probabilities used between PHN pain states
and the post-HZ healthy state. It was therefore essential
to calibrate these transition probabilities to reflect the
average duration of PHN from the literature. The model
assumed that the transition rate from severe to moderate
PHN, moderate to mild, and mild to healthy (post-zoster)
were identical. This constant rate differed by age group as
older patients experience longer duration of pain [6].
Moore et al. Cost Effectiveness and Resource Allocation 2010, 8:7
/>Page 3 of 14
This model has a special state for recurrent HZ as this
is an extremely rare condition. Cunningham [10]
reported a 1%-5% lifetime risk of recurrent zoster. The
mid-point from the Cunningham data, 3%, was used to
determine the incidence of recurrent HZ by applying it to
the average life expectancy for individuals having experi-
enced a first zoster episode. Characteristics of a recurrent
HZ patient (duration, initial pain split, subsequent PHN)
was assumed to be identical to the first-time experience.
Age-specific mortality rates were applied to each health
state to determine the monthly probability of transition-
ing to "Death".
Model Inputs
Input Sources
Inputs used to populate the model were derived from sev-
eral sources presented in Tables 1 and 2. Our model was
mainly informed based on a recent retrospective UK
database analysis [11]. This provided the model with
recent epidemiological and healthcare resource use infor-
mation with the exception of hospitalisations and pro-
ductivity losses. Ultimately, additional data from the
literature were used to populate selected input parame-
ters, such as hospitalisation rates [12], utility decrements
[13], pain split and PHN duration [6]. Moreover, two
parameters (days of work lost due to HZ and PHN and
probable vaccine administration characteristics) have
been made up on expert opinions due to the lack of data
in these matters.
Epidemiology of HZ and PHN
Epidemiological inputs are provided in Table 1. HZ inci-
dence rates for 2000-2006 were used from the GPRD
analysis, described above, based on a sample of 27,225
Figure 1 Model Health States.
Moore et al. Cost Effectiveness and Resource Allocation 2010, 8:7
/>Page 4 of 14
Table 1: Input Data: Epidemiology, Vaccine Characteristics and Utilities
Base case Deterministic sensitivity analysis
HZ PHN HZ PHN
Epidemiology
Annual HZ Incidence
(per 1,000 people)/
PHN Proportion per HZ
case
Gauthier 2008 [11] Edmunds 2001 [12]
Age 50 - 54 3.34 10.30% 4.61 -
Age 55 - 59 4.08 13.70% 5.21 -
Age 60 - 64 4.90 15.70% 5.92 -
Age 65 - 69 5.96 18.70% 6.70 -
Age 70 - 74 6.34 22.50% 7.53 -
Age 75 - 79 7.09 26.60% 8.42 -
Age 80 - 84 7.29 28.90% 9.37 -
Age 85+ 6.22 25.90% 11.58 -
Mean Duration (in
months)
SPS Trial 2005 [6] Gauthier 2008 [11]
Age ≤ 69 1.0 10.3 - 10.9
Age ≥ 70 1.0 12.9 - 11.0
Annual HZ Mortality
Rate
Assumption Edmunds 2001 [12]
Age 50 - 54 0% - 0.0009% -
Age 55 - 59 0% - 0.0009% -
Age 60 - 64 0% - 0.0027% -
Age 65 - 69 0% - 0.0027% -
Age 70 - 74 0% - 0.0035% -
Age 75 - 79 0% - 0.0092% -
Age 80 - 84 0% - 0.0487% -
Age 85+ 0% - 0.2018% -
Gender split Gauthier 2008 [11]
% female 61% 65%
Pain severity split at
diagnosis
SPS Trial 2005 [6] Gauthier 2008 [11]
Age ≤ 69
No pain27%-65%-
Mild pain 41% 42% 24% 47%
Moderate
pain
18% 9% 4% 42%
Severe pain 14% 49% 8% 11%
Age ≥ 70
No pain26%-45%-
Mild pain 32% 17% 41% 34%
Moderate
pain
23% 16% 5% 54%
Severe pain 19% 67% 9% 12%
Moore et al. Cost Effectiveness and Resource Allocation 2010, 8:7
/>Page 5 of 14
patients from the UK [11]. The SPS trial provided data by
patient group for the duration of pain in HZ [6]. These
confirmed that most patients experience a 30-day dura-
tion of pain, as reported in the literature [9,14].
The monthly-cycle model structure requires utilisation
of PHN data based on a 1-month definition. Where only
PHN data was available using a 3-month definition,
appropriate input values using a 1-month definition were
calibrated in order to match the available 3-month data
following 3 months of the Markov process. The PHN pro-
portion was estimated from the GPRD database [11]. It
was assumed that only HZ states associated with pain
could result in PHN, as it is unlikely that PHN will ensue
if no pain is present during the HZ eruption. Therefore,
PHN proportion was adjusted in the model in order to be
derived only from painful HZ states, while still retaining
the overall PHN proportion level obtained from the data-
base analysis [11].
An important aspect of the model was the split
between the different pain states for HZ, as these are
linked to PHN probability and treatment costs. SPS data
[6,15] were used for HZ and initial PHN pain severity.
This provided information on HZ severity levels by
means of a special questionnaire specifically developed to
assess HZ and PHN associated pain (the Zoster Brief Pain
Inventory, or ZBPI [16]). SPS results were also selected
for PHN duration, as pain severity and duration are
linked in the model and therefore should be retrieved
from the same source.
Recurrent annual HZ
Incidence
Age 50 - 54 0.10% -
Age 55 - 59 0.12% -
Age 60 - 64 0.15% -
Age 65 - 69 0.18% -
Age 70 - 74 0.23% -
Age 75 - 79 0.31% -
Age 80 - 84 0.42% -
Age 85 - 89 0.58% -
Age 90 - 94 0.83% -
Age 95 - 99 1.15% -
Age 100+ 1.40% -
Quality of Life
Utility Decrements Oster 2005 [13] SPS Trial - Pellissier 2007 [15]/Bala 1998 [29]
No pain 0.00 - 0.14/0.00 -
Mild pain 0.31 0.31 0.23/0.27 0.23/0.27
Moderate pain 0.42 0.42 0.32/0.40 0.32/0.40
Severe pain 0.75 0.75 0.45/0.53 0.45/0.53
Vaccine
characteristics
SPS Trial 2005 [6]
Efficacy: total %
reduction in cases
(PHN direct effect)
Age ≤ 69 63.9% 66.7% (4.8%)
Age ≥ 70 37.6% 66.8% (30.0%*)
Efficacy: number of
months reduction of
PHN pain
Age ≤ 69 - -2.2
Age ≥ 70 - -3.3
*Calculated based on the midpoint lifetime risk of HZ recurrence from Cunningham et al. [10] and UK life expectancy rates from national
statistics [19].
Table 1: Input Data: Epidemiology, Vaccine Characteristics and Utilities (Continued)
Moore et al. Cost Effectiveness and Resource Allocation 2010, 8:7
/>Page 6 of 14
The GPRD analysis found that women accounted for
61% of all HZ cases and 65% of all PHN cases [11]. This
affected several aspects of the model, including the utility
decrements, as women experience systematically lower
age-specific utility values than men, and productivity
costs, since women have lower employment rates among
the applicable age groups in the UK.
Information from the GPRD analysis indicated no mor-
tality directly linked to HZ or PHN. This was confirmed
by the lack of literature on the subject, however rates
reported by Edmunds et al. 2001 were tested in sensitivity
analyses.
Resource utilisation and costs
All costs in Table 2 are presented in 2006 UK £s. The
model assumes that patients are diagnosed and treated by
GPs. Referrals to specialists are subsequent to at least one
GP visit. Mean monthly health care costs per HZ and
PHN case were obtained from the GPRD analysis by
severity. The analysis found no significant relationship
between age and health care costs, thus values were
applied in the model only for severity. As expected, pain
severity increases costs [11].
Due to limitations of GPRD regarding inpatient data,
the literature was reviewed as a supplement to select an
appropriate approximation for HZ and PHN hospitalisa-
tion rates. Information from the 2004-2005 Hospital Epi-
sode statistics [17] (HES) for the number of HZ and PHN
hospitalisations could be closely replicated by applying
the Edmunds [12] reported hospitalisation rates (also
based on the HES) to all HZ cases which experienced
pain (that is, only HZ associated with mild, moderate, or
severe pain) and all PHN cases. Therefore, the Edmunds
hospitalisation rates [12] were used. The mean length of
hospital stay was also taken from the HES [17] using the
appropriate ICD-10 codes (HZ: B02 codes excluding
B02.2 and PHN: B02.2). The daily cost associated with a
non-elective inpatient stay due to viral illness from the
NHS Reference Costs [18] was applied to calculate the
total hospitalisation cost per inpatient case.
Productivity losses were based on the number of work-
days lost due to disease. The data concerning the number
of workdays lost were gathered from expert opinion.
Experts emphasised the need for HZ patients, even with
no pain, to abstain from work, as they would be infectious
during the early phases of their HZ infection. UK employ-
ment data [19] and average wage values [20] were gath-
ered to compute the average daily productivity losses,
which were only included for persons aged 69 or less.
Vaccination characteristics
Vaccine efficacy was taken from the clinical trial SPS [6].
The efficacy data for age groups 50-59 years were
assumed to be identical to ones for the 60-69 age group as
this can be supported by the available immunogenicity
results [7,21] providing an immunological bridge to vac-
cine efficacy demonstrated in the SPS [6,10]. Several
effects of vaccination are included in the model, both
direct and indirect (Table 1) (see Additional File 1). The
vaccine has a direct effect on the number and severity of
HZ and PHN cases, which differed by age. Since HZ must
precede PHN, the number of PHN cases is also indirectly
reduced through the reduction in the HZ cases. In addi-
tion, vaccination reduces the duration of PHN. In the
model, this indirectly affects the pain severity experi-
enced by the patient since it implies a shorter period of
time spent in each painful PHN health state. This was
incorporated in the model by adjusting the age-specific
transition probabilities between PHN states for both vac-
cinated and non-vaccinated individuals, as described ear-
lier. These adjustments reflect the vaccine efficacy in
reducing the Burden of Illness (BOI is a severity-by-dura-
tion measure of the total pain), defined as primary clini-
cal endpoint of the SPS.
In the base case, the vaccine efficacy is expected to last
a lifetime. While the efficacy of the vaccine may diminish
over time, the lengths of the clinical trials are currently
not sufficient to accurately document this, though more
reliable data may become available in the future. A wan-
ing function, currently set at 0% as described in the litera-
ture [15], has been included in the model for this
purpose. Alternative assumptions examining shorter vac-
cine efficacy durations and including the need for a
repeat dose or possible waning in vaccine efficacy were
considered in the sensitivity analysis.
A vaccine coverage rate of 40% was assumed for all ages
from the age of 50. The current reported coverage in the
UK in the over 65 year old age group for influenza vaccine
(approximately 70% [20]) or pneumococcal polysaccha-
ride vaccine (64% [21]) was seen as the absolute maxi-
mum attainable vaccine coverage rate for the vaccine
against HZ. Thus, the selected rate of 40% was perceived
to be an attainable yet realistic rate for base-case.
Costs related to the administration of the vaccine were
included. We assumed that in 50% of cases the vaccine
would be administered by a nurse during a vaccination
appointment and in 50% of cases by a GP during a routine
visit. For the latter case, as patients would be vaccinated
during a routine visit only the costs specific to the admin-
istration of the vaccine were included. Unit costs associ-
ated with vaccination administration were derived from
the Personal Social Services Research Unit (PSSRU) [22].
Utilities
Age-specific utilities were used from the Health Survey
for England [23]. Those are for 10-year age bands. 5-year
age-specific utility values were obtained from the Cana-
dian Health Utilities Index (HUI) Mark 3 [24] and extrap-
olated to the UK population (see Additional File 2). As
regards to the decrement caused by pain, the model used
utilities derived from Oster [13], which were obtained in
Moore et al. Cost Effectiveness and Resource Allocation 2010, 8:7
/>Page 7 of 14
Table 2: Input Data: Healthcare Resource Use (HCRU) and Costs in the UK
HZ PHN
GP visits monthly costs Gauthier 2008 [11]
No pain £18.98 -
Mild pain £43.66 £26.18
Moderate pain £54.49 £26.91
Severe pain £64.60 £25.72
Specialist visits monthly costs Gauthier 2008 [11]
No pain £4.03 -
Mild pain £4.53 £0.81
Moderate pain £6.24 £2.04
Severe pain £6.89 £2.81
Medication monthly costs Gauthier 2008 [11]
No pain £37.14 -
Mild pain £43.37 £10.02
Moderate pain £46.17 £14.06
Severe pain £53.40 £23.06
Hospitalisation costs
Hospitalisation rate (painful cases only) Edmunds 2001 [12]
Age 50 - 54 0.70%
Age 55 - 59 0.80%
Age 60 - 64 1.10%
Age 65 - 69 1.70%
Age 70 - 74 2.30%
Age 75 - 79 3.00%
Age 80 - 84 5.20%
Age 85+ 5.90%
Length of hospital stay Hospital Episode Statistics 2004-2005 [17]
Duration in days 9.9 11.2
Unit Costs NHS Reference costs 2005-2006 [18]
Daily cost of inpatient stay £117.00
Productivity Costs
Days off work Assumption
No Pain 8.8 -
Mild Pain 9.6 8.8
Moderate Pain 12.3 31.5
Severe Pain 21.0 70.5
Unit cost ASHE 2005 [20](Assuming 7.5 hour work day)
Cost per day lost £93.75
Vaccination costs
Unit cost Assumption
One dose of vaccine £95.00
Administration cost PSSRU 2005 [22]/Assumption
50% GP - 50% Nurse £10.40
Moore et al. Cost Effectiveness and Resource Allocation 2010, 8:7
/>Page 8 of 14
a PHN population and were utilised for HZ as well, as
PHN and HZ pain are both neuropathic in nature. It is
expected that the utility associated with the different lev-
els of pain severity will not vary between the various
causes of neuropathic pain. In particular, a recent publi-
cation McDermott et al. [25] investigated the quality of
life in neuropathic pain patients in five European coun-
tries reporting utility weights by severity. These weights
are very similar to the values reported by Oster, indicat-
ing that the latter are appropriate to feed the model. In
addition, according to expert opinion while age-specific
utilities do differ between countries, the decrements due
to disease may be considered similar, and thus the US
Oster decrements were considered suitable for the UK
analysis.
To calculate utilities, the decrements related to the pain
states are applied to the age-specific utilities using an
additive approach, i.e. pain decrements are subtracted
from the age-specific utilities (see Additional File 2).
Population characteristics
The population size was obtained from the UK national
statistics office [19] and totals 20,174,786 persons aged 50
and older as reported for mid-year 2004. Cost-effective-
ness was analysed by 5-year age-groups within this popu-
lation UK general mortality rates were obtained from the
government actuarial department [26].
Discounting
The discount rate used for the base case analysis is 3.5%
for costs and 3.5% for outcomes (QALYs) as recom-
mended by NICE. There is controversy regarding
whether monetary costs and health benefits should be
discounted at the same rate or differentially, particularly
when evaluating public health programmes such as vacci-
nation [27,28]. It is often argued that the benefits of
health promotion strategies should be discounted at a
lower rate than those of costs, so as to prioritise health
promotion and disease prevention over curative treat-
ments [27]. As a result, different discount rates were
tested in sensitivity analyses.
Sensitivity Analyses
The sensitivity of the base case ICER to alternative values
of significant input parameters was explored by varying
these within feasible ranges. A number of univariate sen-
sitivity analyses were carried out in order to evaluate the
effect of different parameters on the results and to iden-
tify the variables driving the results. This included varia-
tions on the discount rate, HZ incidence and mortality
assumptions [12], vaccine efficacy, duration of vaccine
efficacy (varied by both an assumption of limited dura-
tion of full vaccine efficacy followed by no efficacy and
also by utilising a waning rate [15]) and utilisation of a
vaccine repeat dose at 10 years after first dose, vaccina-
tion coverage rates by age, health care costs, vaccination
costs, utility decrements [15,29], and the HZ/PHN pain
split used [11]. A probabilistic sensitivity analysis (PSA)
was also performed and several parameters were
included. In particular, HZ vaccine efficacy was tested by
varying the base efficacy using a beta distribution and by
including a waning rate [15] varied uniformly. HZ mortal-
ity was also varied uniformly from the base scenario value
of 0% to the age-specific values found in the Edmunds et
al. publication [12]. HZ and PHN utility decrements were
tested using a lognormal distribution [13]. Data gathered
from the GPRD analysis, including health care resource
costs and HZ incidence and PHN proportion, were varied
over a normal and beta distribution respectively [11].
Validation
Once the model had been developed, it was validated by
comparison to the available clinical data. Using the clini-
cal information from the SPS trial comparing vaccine
with placebo [6], we were able to replicate exactly the
number of HZ cases and PHN cases (using a 3-month
definition, reflecting the primary PHN endpoint defini-
tion considered in the trial) seen in the SPS placebo arm
over a period of three years (the duration of the clinical
trial), 642 and 80 cases, respectively. For the vaccine arm
we obtained the identical number of HZ cases reported in
the trial (315 cases) [6,30]. Because there are two PHN
endpoints of interest (1 and 3-months definition), the
direct PHN vaccine efficacy input parameter was
adjusted in the model in order to best reflect the efficacy
in reducing the incidence of PHN. As a result, the PHN
vaccine efficacy input parameter used in the model over-
estimated PHN using a 1-month definition by 0.3 per-
centage points (59.2% compared to the trial reported
58.9% [6,30]) and underestimated PHN using a 3-month
definition by 0.3 percentage points (66.2% instead of the
trial reported 66.5% [6,30]). However, as this estimation
error is quite small, we were still able to replicate the
number of PHN (3-month definition) cases in the vaccine
arm (27 cases). Therefore all primary clinical endpoints
from the SPS were successfully replicated in the model,
providing confidence that the model generates a valid
estimate of clinical benefit.
Results
Base Case
The base case results predict that the vaccination would
bring benefits in the form of reduced numbers of HZ and
PHN cases and QALYs gained at additional cost.
Over the lifetime of the current aged 50 and older UK
population, without vaccination, it is estimated that there
would be 2,307,719 cases of HZ, and either 521,616 or
477,532 cases of PHN using a 1- or 3-month definition,
respectively. By comparing this to the vaccination strat-
egy with a 40% coverage rate, there would be 22.7% fewer
HZ cases, 26.6% fewer PHN cases using a 1-month defi-
Moore et al. Cost Effectiveness and Resource Allocation 2010, 8:7
/>Page 9 of 14
nition, and 28.9% fewer PHN cases using a 3-month defi-
nition. More PHN cases are avoided when using a 3-
month definition due to the shorter duration of PHN for
the vaccinated population which results in more episodes
resolving within 3 months. Over a lifetime, a total of
57,589 quality-adjusted life years would be gained by such
vaccination strategy. The model also calculated the num-
ber needed to vaccinate in order to avoid one case of HZ
and PHN (both definitions), namely 15 and 58 respec-
tively.
The estimated costs varied according to the perspective
taken either from NHS or from society. The difference in
costs between the two perspectives provides information
on the total productivity losses due to HZ and PHN. Over
a lifetime of the current aged 50 and older UK population
(no vaccination policy population), approximately £363
million or 3.9 million workdays are lost due to HZ and
PHN. Accordingly, the ICERs for the societal perspective
are notably lower than for the NHS perspective.
The resulting ICERs, presented in Table 3, were
£13,077 per QALY gained, £1,440 per HZ avoided, £5,421
per PHN (1-month definition) avoided and £5,453 per
PHN (3-month definition) avoided from the NHS per-
spective, and £11,417 per QALY gained, £1,258 per HZ
avoided, £4,733 per PHN (1-month definition) avoided
and £4,761 per PHN (3-month definition) avoided from
the societal perspective.
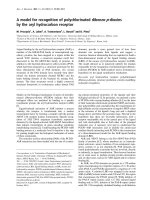
Separate ICERs per 5-year age-group over a lifetime
were also calculated, providing an overview of which age
groups are more cost-effective to vaccinate. From Figure
2, ICERs remain less than the commonly accepted
threshold £30,000/QALY gained[31] for persons aged less
than 85, with the lowest ICERs from a NHS perspective
found for those aged 65 to 69 (£10,275 per QALY gained)
and for those aged 60 to 64 (£ 10,984 per QALY gained).
By summing the incremental costs and QALYs of the vac-
cinated populations of interest, the overall ICER associ-
ated with any age-specific vaccination strategy can be
observed. For instance, vaccinating only those aged 50 to
59 results in ICERs of £12,539 and £9,043, vaccinating
only those aged 60 to 69 results in ICERs of £10,639 and
£9,742, and vaccinating all persons aged 65 and older
results in ICERS of £14,385 and £14,294, from a NHS and
societal perspectives respectively. As productivity costs
are limited to those aged less than 70 in the model, the
NHS and societal perspective costs become identical
after this age threshold.
The cost-effectiveness of vaccinating single age groups
with comparable population size (10,000 people) was also
performed; however, as the model is structured to sup-
port input data only to the detail of 5-year age bands, the
analysis of a single age group resulted in nearly identical
ICERs as that of the 5-year age group it falls within. For
example, if a vaccination strategy was applied to those
aged 66 only (a population size of 557,469), the ICERs
would be £10,179 and £9,938 for the NHS and societal
perspectives, respectively. The ICER differs slightly from
that of the aged 65 to 69 ICER due to the slight difference
in the gender ratio of this smaller population as well as
differential mortality rates, utility values, employment
rates, and incidence of HZ.
Sensitivity Analysis
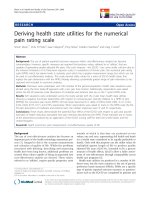
Deterministic sensitivity analyses were performed to
assess scenario uncertainty in the model. The tornado
diagram in Figure 3 illustrates the difference from the
base case in the lifetime cost per QALY observed for a
number of selected sensitivity analyses performed from a
NHS perspective. Societal perspective results are not pre-
sented, as the relative sensitivity of changes to this per-
spective is similar to those from a NHS perspective.
A number of analyses were performed to explore the
uncertainty around the base case assumptions of vaccine
efficacy, testing the applied point estimate and duration
of vaccine efficacy. The lower and upper limit of the 95%
confidence interval of the vaccine efficacy obtained from
the Oxman trial were tested in the sensitivity analysis,
indicating a moderate impact on the ICERs, i.e. an 8%
increase and a 12% decrease respectively. In addition, the
base case assumes that the efficacy of the vaccine is con-
stant over the lifetime of the population, therefore an
assumption of a limited duration of full vaccine efficacy
(20 years and 10 years) followed by a lifetime of no effi-
cacy was examined. As expected, the shorter durations of
protection have an adverse impact on the expected bene-
fits of vaccination, resulting in higher ICERs of £17,807/
QALY and £32,809/QALY gained respectively. Another
sensitivity analysis assumed a 10-year duration of full
vaccine efficacy and, in addition, that 50% of the remain-
ing healthy vaccinated population would receive a repeat
dose after 10 years, which provided them with full life-
time efficacy. From the NHS perspective, the inclusion of
a repeat dose results in an ICER of £24,511/QALY. A final
sensitivity analysis applied an 8.3% annual waning rate,
reported by Pellissier et al. as the upper limit of the wan-
ing rate [15], from the first month following vaccination.
This resulted in an ICER of £19,533/QALY gained.
Discount rates of 0% and 6.0% for both costs and bene-
fits, as well as a scenario of 3.5% for costs and 1.5% for
benefits were tested. Results were quite sensitive to the
values chosen. Lower discount rates will decrease ICERs
to a large degree. Higher discount rates tend to emphasise
vaccination costs, which are not affected by discounting
as they are incurred in the first year, while diminishing
the clinical benefits and cost savings achieved in subse-
quent years.
The vaccine coverage rate applied in the base case anal-
ysis was the same across all age groups, i.e. 40%. The use
Moore et al. Cost Effectiveness and Resource Allocation 2010, 8:7
/>Page 10 of 14
of differential coverage rates was explored, assuming that
different age groups are covered by the vaccine at differ-
ent rates, i.e. 60% of those aged 50-64, 30% of those aged
65-84, and 10% for those over 85+ years. Under this
assumption, the resulting ICER decreased to £12,483.
The GPRD analysis provided information on HZ and
PHN, covering the pain split as well as PHN duration
[11]. A sensitivity analysis explored the effect of using
GPRD data solely for all main HZ and PHN characteris-
tics [11]. As can be seen in Table 1, the values are more
conservative than the base case results. This is due pri-
marily to the decreased number of moderate and severe
pain cases of both HZ and PHN (compared to the SPS
pain split).
Several sensitivity analyses were conducted to assess
the impact of disease-specific utility values on results.
Three sources for utility weights were available for mild,
moderate, and severe pain associated with HZ and PHN.
Alternative utility values, based on an HZ population,
were available from Bala et al. [29] and the SPS [15]. For
both of these alternative utility values, their associated
decrements were lower than those reported by Oster
[13]. The difference is mainly found in the severe pain
state. Oster [13] reports a utility decrement from full
health to HZ/PHN with severe pain of 0.75 whereas the
Bala [29] and SPS [15] values imply that the decrement is
0.53 and 0.45, respectively. Because the decrements from
the alternative studies are modest relative to the Oster
[13] study, the total number of QALYs gained over the
lifetime of vaccinated individuals is lower when using the
Bala [29] and SPS [15] utility values, resulting in
increased ICERs.
Several sensitivity analyses had only a marginal effect
on results, i.e. the inclusion of HZ mortality [12], the
assumption of no hospitalisation due to HZ/PHN, the
increase of vaccine administration costs.
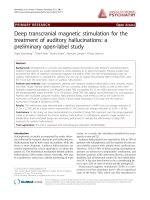
Probabilistic sensitivity analyses were performed using
Monte Carlo simulations (1,000 runs) on distributions for
those parameters described earlier. Due to the inclusion
of a new variable, the vaccine waning rate, and also since
some means used for the sensitivity analysis differed from
their corresponding base case value, the mean results of
the PSA are not identical to the base case results. The
mean result after 1,000 runs maintained the cost-effec-
tiveness of the vaccination strategy, with a mean ICER of
£19,551 (se: 58,922) for the NHS perspective. Figure 4A
shows the NHS perspective for the outcome of QALYs
gained. Presented in Figure 4B is the cost-effectiveness
acceptability curve, providing the number of simulations
which fall below given values or thresholds. The probabil-
ity of not surpassing the commonly used threshold of
£30,000/QALY from a NHS perspective is 92.7%. There-
fore, the PSA illustrates the robustness of the cost-effec-
tiveness of the vaccination policy.
Discussion
The main results of this analysis, demonstrate numerous
benefits of a vaccination strategy. These benefits include
a reduced number of HZ and PHN cases, an increase in
health-related quality of life as captured by the QALY, in
addition to a reduction in hospitalisations, consultations
and prescription costs for the vaccinated population.
While sensitivity analyses illustrated that the model
results are sensitive to some inputs, the vast majority of
scenarios resulted in ICERs well below the cost-effective-
ness thresholds commonly used in the UK [31].
This model takes into consideration a number of fac-
tors which contribute to its robustness. First, the model is
population-based and therefore of direct relevance to
decisions concerning vaccination, as this is done at the
population-level. In addition, the model takes into
account the ageing of the population over the duration of
the model, adjusting for their mortality, the likelihood of
contracting HZ and PHN and the efficacy of the vaccine.
Though it was assumed that the vaccine would have life-
time duration of efficacy, the model is able to accommo-
date any changes to vaccine durability. Also this model
incorporates epidemiological data that were obtained
from a very large dataset (GPRD) [11], these input
parameters for the model could be considered robust and
representative of clinical practice in the UK.
Similar to other cost-effectiveness models, the main
limitations of this study relate to the uncertainty sur-
rounding some parameter estimates used in this model.
One of these limitations concerns the assessment of dis-
ease severity in both HZ and PHN. The results of the
severity split in HZ and PHN is quite different when the
SPS and GPRD data are compared. For the base case we
Table 3: Base Case: Lifetime Results for the 50+ Age Group
Results Lifetime horizon TPP Societal
ICERs Cost per QALY £13,077 £11,417
Cost per HZ Case Avoided £1,440 £1,258
Cost per PHN Case Avoided (1
month def)
£5,421 £4,733
Cost per PHN Case Avoided (3
month def)
£5,453 £4,761
Moore et al. Cost Effectiveness and Resource Allocation 2010, 8:7
/>Page 11 of 14
have opted for the SPS split for both HZ and PHN as we
believe that this is the most accurate representation avail-
able from the literature, as special care was taken with
regards to diagnosis in this study due to the use of the val-
idated ZBPI questionnaire [16]. Assessment of severity in
GPRD was based on treatments prescribed [11] rather
than actual pain measured and therefore is expected to be
less reliable than SPS data, where measurements were
geared to providing clinical benefits. Experts further con-
firmed that the majority of patients experience pain at
HZ onset which confirms the higher validity of the SPS
data.
Figure 2 Base Case ICERs by Age-Group. Note: The ICERs of the two perspectives are identical after the age of 70 as there are no productivity losses
after this age.
£49,672
£73,978
£10,275
£10,984
£11,904
£13,272
£103,082
£33,692
£19,992
£14,972
£13,105
£10,033
£9,465
£8,919£9,187
£0
£20,000
£40,000
£60,000
£80,000
£100,000
£120,000
50-54 55-59 60-64 65-69 70-74 75-79 80-84 85-89 90-94 95-99 100+
Age Group
Incremental cost-effectiveness ratio (ICER)
TPP perspective Societal perspective
Figure 3 Selected Deterministic Sensitivity Analysis: Tornado Diagram.
£32,809
£25,398
£24,511
£19,533
£18,529
£18,187
£17,807
£ 17,281
£15,859
£14,608
£13,415
£12,738
£11,988
£10,097
£9,893
£8,873
£7,126
£0 £5,000 £10,000 £15,000 £20,000 £25,000 £30,000 £35,000 £40,000
Vaccine Efficacy Duration 10 years
GPRD PHN Duration/Split[13]
Vaccine Efficacy Duration 10 years & Repeat Dose
Vaccine Efficacy Waning 8.3%[15]
SPS Utilities[15]
6.0% Discount Rate
Vaccine Efficacy Duration 20 years
Vaccine Price £125
Bala Utilities[29]
Vaccine Efficacy: Lower limit of 95% CI[6]
HCRU costs 20% Decrease
HCRU costs 20% Increase
Vaccine Efficacy: Upper limit of 95% CI[6]
Edmunds/Brisson HZ Incidence[11]
3.5%/1.5% Discount Rate
Vaccine Price £65
0% Discount Rate
Moore et al. Cost Effectiveness and Resource Allocation 2010, 8:7
/>Page 12 of 14
Utility weights were available from several sources
[13,15,29] and Oster et al. [13] utilities, obtained in a
PHN population, were selected for the base case due to
the focus on neuropathic pain. A recent publication
investigating the quality of life in neuropathic pain
reported utility weights of 0.67 for mild, 0.46 for moder-
ate and 0.16 for severe pain [25], indicating that the Oster
values are appropriate for this study. In addition a recent
publication by Van Hoek et al. [8] arrived at similar utility
scores for the different pain states, i.e. 0.78, 0.61 and 0.27
for mild, moderate and severe pain respectively. In the
standard approach in economic evaluations, the utility
gain from prevention is the utility that would otherwise
be lost due to illness. An extension of the standard utility
model and analysis of prevention interventions is offered
by the utility-in-anticipation concept introduced by
Cohen and Henderson [32]. This concept acknowledges
the fact that the utility resulting from preventive mea-
sures such as vaccination follows immediately after vacci-
nation until the time when the outcomes was expected.
Furthermore this utility will depend on the anxiety asso-
ciated with both the perceived risk of infection and the
perceived effectiveness of the vaccination in reducing
that risk. This model does not include any such gains and
therefore could underestimate the total utility gained
from vaccination. Obviously, had this been included, this
would have resulted in lower ICERs.
A 3.5% discount rate for both costs and benefits was
used in the base case analysis as suggested by the current
National Institute of Health and Clinical Excellence
(NICE) guidelines. A lower discount rate of 1.5% for out-
comes was selected in the sensitivity analysis to account
for the long-lasting effects of the vaccine, resulting in
lower ICERs of £9,893 per QALY gained for the third
party payer perspective. This reflects the previous guide-
lines set by NICE, which recognised that differential dis-
counting is appropriate in certain cases [33]. This is
because vaccination programmes accrue their cost in the
present but may not observe their benefits until the
future. This can be seen in the case of the vaccine pre-
venting HZ where those vaccinated may likely be in their
early 50s and 60s, but the incidence of HZ increases with
age, thus the benefit of the vaccine may not be observed
until the medium- to long-term. Discounting health ben-
efits created by vaccines with long-term effects at the reg-
ular discount rates can negatively affect their true benefit
by underestimating the cost-effectiveness of the vaccine
[27].
Modelling the appropriate duration of vaccine efficacy
is also a significant issue. Extensive SA were conducted to
assess the impact of different duration of protection and
showed that the highest ICERs were obtained when
assuming a 10-year duration of efficacy, or utilising a
waning rate. Most of the sensitivity analyses were still
below £30,000/QALY.
Another limitation relates to the available vaccine effi-
cacy data. Firstly, as the SPS trial did not include patients
aged 50 to 59, the model assumed that the efficacy values
for those aged 60 to 69 would be relevant for this younger
population. Secondly, the SPS trial reported a 22% reduc-
tion in pain for those developing HZ [6], which may con-
sequently reduce the pain associated with PHN, but as
this effect was difficult to incorporate into the structure
of the model as such, it was not taken into account
directly.
Most of the resource use data were also taken from
GPRD [11]. Though we are confident that primary care
resource use was accurately recorded, there is less cer-
tainty over the secondary care data, as there were only a
few referrals or hospitalisations due to HZ or PHN. It is
possible therefore that the estimated treatment costs
were underestimated. The underestimation of costs does
have the advantage that it does not favour the vaccine
arm and therefore represents a conservative approach. A
sensitivity analysis which varied all health care costs 20%
above and below their base case value found that this had
minimal impact on the ICERs. Furthermore, the model
provides a conservative estimate of the value of herpes
zoster vaccination. By not incorporating the common
ocular and neurological complications (other than PHN)
of HZ, including keratitis, iritis, retinal necrosis, [34]
meningitis, encephalitis, and myelitis, [35] due to current
lack of available data, the model may underestimate the
potential health benefits and cost savings resulting from
vaccination. Therefore future analyses, in the form of
additional retrospective or prospective studies, would be
of interest in order to model more accurately such poten-
tial disease pathways following herpes zoster and their
impact on costs and quality of life.
With regards to a real-world vaccination strategy, it is
worth nothing that the results presented in this analysis
would only apply for the first years of a vaccination pro-
gramme where a "catch-up" programme would be insti-
tuted for older patients. Following this period, a
vaccination strategy would typically include younger
cohorts (for instance, those aged 50-69) as other older
adults will have already received the vaccine. As a result,
in these later years, the cost-effectiveness of vaccination
would improve, as illustrated in this study by the lower
ICERs associated with relatively lower age groups.
A health economic evaluation of the new live attenu-
ated vaccine against herpes zoster in England and Wales
was recently published by Van Hoek et al. [8] The Van
Hoek et al. model employs a different categorisation of
HZ/PHN pain states by including a state of clinically rele-
vant pain (CRP) to characterize both moderate and
severe pain, while it assumes a limited duration of effi-
cacy with the use of a waning rate,. In addition, there are
differences in several input parameters such as HZ inci-
dence rates, disease-specific utilities, and vaccine price
Moore et al. Cost Effectiveness and Resource Allocation 2010, 8:7
/>Page 13 of 14
applied. Even though a direct comparison of the base case
results of the two analyses is not possible, the reported
sensitivity analysis applying the maximum vaccine pro-
tection duration (100 years) for the cohort aged 65 in the
Van Hoek et al. study (£5,660/QALY), produced almost
identical results to our study (£5,583/QALY) when we set
the vaccine price and population size equal.
In addition, a previous model by Edmunds et al. [12]
had estimated the potential cost-effectiveness of vaccina-
tion prior to the availability of data on the clinical efficacy
of such a vaccine. Structurally, this previous model differs
from ours due to a different and less detailed utilisation of
pain states and because it was not able to model the mul-
tiple efficacies (direct and indirect) now known of the
vaccine. Despite these differences, as well as the use of
several input parameters which relied on secondary data,
considering a cohort aged 65, the base case resulted in
ICERs of similar magnitude to our study, with values
below £10,000 per QALY gained from a NHS perspective.
A third cost-effectiveness study by Pellissier et al. [15]
has been published in the US, and while results cannot be
directly compared to the UK due to differences in epide-
miology and related health care costs, the general model
structure has many similarities to the current model.
Age-specific and severity-specific data were considered
where possible. Vaccine efficacy was modelled using sev-
eral dimensions, with both models allowing the use of a
waning rate (however neither of the two studies included
this feature in the base case analysis). In both studies, ret-
rospective database analyses were performed to inform
economic inputs and the resulting ICERs were deter-
mined to be cost-effective using locally accepted thresh-
olds. Therefore, it confirms the robustness of the
methods used in this analysis.
There are a number of areas where additional research
could further improve the accuracy of the model. Contin-
ued validation of the duration of efficacy of the vaccine,
as mentioned above, remains one of the key areas for
research.
Conclusions
The main results of this cost-effectiveness analysis show
that a vaccination programme preventing HZ and PHN is
likely to lead to substantial health and economic benefits
for the UK. The model predicts that the most cost-effec-
tive strategies for the NHS are to vaccinate people
between 60-64 and 65-69 years (£10,984 and £10,275).
But beyond these age-groups, in most scenarios, the cost-
effectiveness ratios remain below the commonly accepted
cost-effectiveness threshold in the immunocompetent
population aged 50 years and more.
Additional material
Competing interests
VR and MB are employed by SPMSD who funded the study. All other authors
declare that they have no competing interests.
Authors' contributions
MM developed the cost-effectiveness model and drafted the manuscript. LM
programmed the cost-effectiveness model and drafted the manuscript. AM
validated the cost-effectiveness model and contributed to the drafting of the
manuscript. VR reviewed the design and results of the cost-effectiveness
model and participated in the drafting of the manuscript. MB reviewed the
design and results of the cost-effectiveness model and participated in the
drafting of the manuscript. All authors read and approved the final manuscript.
Acknowledgements
This study was carried out independently by i3 Innovus and was fully funded
by SPMSD.
Author Details
1
i3 Innovus, Uxbridge, UK,
2
Sanofi Pasteur MSD, Lyon, France and
3
London
School of Economics, London, UK
Additional file 1 Vaccination Characteristics. Supplemental data.
Additional file 2 Calculation of Utilities. Supplemental data.
Received: 10 March 2009 Accepted: 30 April 2010
Published: 30 April 2010
This article is available from: 2010 Moore et al; licensee BioMed Central Ltd. This is an Open Access article distributed under the terms of the Creative Commons Attribution License ( which permits unrestricted use, distribution, and reproduction in any medium, provided the original work is properly cited.Cost Effect iveness and Reso urce Allocation 2010, 8:7
Figure 4 Probabilistic Sensitivity Analysis - NHS Perspective: Scatter Plot of ICERs and Cost-Effectiveness Acceptability Curve. Note: The
points in the 4th quadrant of the scatter plot represent negative incremental outcomes, as during some of the PSA runs the vaccination policy will
result in lower outcomes than the no vaccination policy.
£720
£730
£740
£750
£760
£770
£780
£790
£800
£810
£820
-20 0 20 40 60 80 100 120
Millions
Thousands
Incremental Outcomes
Incremental Costs
0.00
0.10
0.20
0.30
0.40
0.50
0.60
0.70
0.80
0.90
1.00
£0 £10,000 £20,000 £30,000 £40,000 £50,000 £60,000
Threshold
Probability
Moore et al. Cost Effectiveness and Resource Allocation 2010, 8:7
/>Page 14 of 14
References
1. Miller E, Marshall R, Vurdien J: Epidemiology, outcome and control of
varicella-zoster infection. Rev Med Micro 1993, 4:222-230.
2. Stankus SJ, Dlugopolski M, Packer D: Management of Herpes Zoster
(Shingles) and Postherpetic Neuralgia. American Family Physician 2000,
61:2437-2448.
3. Opstelten W, Mauritz JW, de Wit NJ, van Wijck AJ, Stalman WA, van Essen
GA: Herpes zoster and postherpetic neuralgia: incidence and risk
indicators using a general practice research database. Fam Pract 2002,
19:471-475.
4. Schmader KE: Epidemiology and impact on quality of life of
postherpetic neuralgia and painful diabetic neuropathy. Clin J Pain
2002, 18:350-354.
5. Scott FT, Johnson RW, Leedham-Green M, Davies E, Edmunds WJ, Breuer J:
The burden of Herpes Zoster: a prospective population based study.
Vaccine 2006, 24:1308-1314.
6. Oxman MN, Levin MJ, Johnson GR, Schmader KE, Straus SE, Gelb LD,
Arbeit RD, Simberkoff MS, Gershon AA, Davis LE, Weinberg A, Boardman
KD, Williams HM, Zhang JH, Peduzzi PN, Beisel CE, Morrison VA, Guatelli JC,
Brooks PA, Kauffman CA, Pachucki CT, Neuzil KM, Betts RF, Wright PF,
Griffin MR, Brunell P, Soto NE, Marques AR, Keay SK, Goodman RP: A
vaccine to prevent herpes zoster and postherpetic neuralgia in older
adults. N Engl J Med 2005, 352:2271-2284.
7. Gilderman LI, Lawless JF, Nolen TM, Sterling T, Rutledge RZ, Fernsler DA,
Azrolan N, Sutradhar SC, Wang WW, Chan IS, Schlienger K, Schödel F,
Silber JL: Zostavax Protocol 010 Study Group: A double-blind,
randomized, controlled, multicenter safety and immunogenicity study
of a refrigerator-stable formulation of Zostavax. Clin Vaccine Immunol
2008, 15:314-319.
8. Van Hoek AJ, Gay N, Melegaro A, Opstelten W, Edmunds WJ: Estimating
the cost-effectiveness of vaccination against herpes zoster in England
and Wales. Vaccine 2009, 27:1454-67.
9. Nagasako EM, Johnson RW, Griffin DR, Dworkin RH: Rash severity in
herpes zoster: correlates and relationship to postherpetic neuralgia. J
Am Acad Dermatol 2002, 46:834-839.
10. Cunningham AL, Dworkin RH: The management of post-herpetic
neuralgia. BMJ 2000, 321:778-779.
11. Gauthier A, Breuer J, Carrington D, Martin M, Remy V: Epidemiology and
cost of herpes zoster and post-herpetic neuralgia in the United
Kingdom. Epidemiol Infect 2009, 137:38-47.
12. Edmunds WJ, Brisson M, Rose JD: The epidemiology of herpes zoster
and potential cost-effectiveness of vaccination in England and Wales.
Vaccine 2001, 19:3076-3090.
13. Oster G, Harding G, Dukes E, Edelsberg J, Cleary PD: Pain, medication use,
and health-related quality of life in older persons with postherpetic
neuralgia: results from a population-based survey. J Pain 2005,
6:356-363.
14. Johnson RW, Dworkin RH: Treatment of herpes zoster and postherpetic
neuralgia. BMJ 2003, 326:748-750.
15. Pellissier JM: Evaluation of the Cost-Effectiveness in the United States of
a Vaccine to Prevent Herpes Zoster and Postherpetic Neuralgia in Older
Adults. Vaccine 2007, 25:8326-8337.
16. Coplan PM, Schmader K, Nikas A, Chan IS, Choo P, Levin MJ, Johnson G,
Bauer M, Williams HM, Kaplan KM, Guess HA, Oxman MN: Development
of a measure of the burden of pain due to herpes zoster and
postherpetic neuralgia for prevention trials: adaptation of the brief
pain inventory. J Pain 2004, 5:344-356.
17. Hospital Episodes Statistics Data 2004-2005 2006 [http://
www.hesonline.nhs.uk]. 7-4-2006
18. NHS Tariff 2005-2006 2006 [ />PublicationsAndStatistics/Publications/PublicationsPolicyAndGuidance/
PublicationsPolicyAndGuidanceArticle/fs/
en?CONTENT_ID=4091529&chk=f%2Bcvh8]. 7-4-2006
19. UK National Statistics 2006 []. 7-4-2006
20. 2005 Annual Survey of Hours and Earnings (ASHE) Analysis by All
Employees Table 1.5a 2006 [ />theme_labour/ASHE_2005/2005_all_employees.pdf]. 7-4-2006
21. Kerzner B, Murray AV, Cheng E, Ifle R, Harvey PR, Tomlinson M, Barben JL,
Rarrick K, Stek JE, Chung MO, Schödel FP, Wang WW, Xu J, Chan IS, Silber
JL, Schlienger K: Safety and immunogenicity profile of the concomitant
administration of ZOSTAVAX and inactivated influenza vaccine in
adults aged 50 and older. J Am Geriatr Soc 2007, 55:1499-1507.
22. Curtis L, Netten A: Unit Costs of Health and Social Care 2005. 2006.
Personal Social Services Research Unit 2005. [http://
www.erpho.org.uk/viewResource.aspx?id=13562].
23. Health Survery for England 1996 2006 [icial-
documents.co.uk/document/doh/survey96/ehch1.htm]. 7-4-2006
24. Canada. National Population Health Survey (NPHS) 1996-1997 [http://
www.statcan.gc.ca/dli-ild/data-donnees/ftp/nphs-ensp-eng.htm]
25. McDermott AM, Toelle TR, Rowbotham DJ, Schaefer CP, Dukes EM: The
burden of neuropathic pain: results from a cross-sectional survey. Eur J
Pain 2006, 10:127-135.
26. Government Actuary's Department 2006 []. 7-4-
2006
27. Bonneux L, Birnie E: The discount rate in the economic evaluation of
prevention: a thought experiment. J Epidemiol Community Health 2001,
55:123-125.
28. Bos JM, Postma MJ, Annemans L: Discounting health effects in
pharmacoeconomic evaluations: current controversies.
Pharmacoeconomics 2005, 23:639-649.
29. Bala MV, Wood LL, Zarkin GA, Norton EC, Gafni A, O'Brien B: Valuing
outcomes in health care: a comparison of willingness to pay and
quality-adjusted life-years. J Clin Epidemiol 1998, 51:667-676.
30. Brisson M: Cost-Effectiveness of Herpes Zoster Vaccine: Flawed
Assumptions Regarding Efficacy against Postherpetic Neuralgia.
Clinical Infectious Diseases 2007, 45:1527-1529.
31. National Institute for Clinical Excellence: Guide to the methods of
technology appraisal. London. 2004 [ />niceMedia/pdf/TAP_Methods.pdf].
32. Cohen DR, Henderson JB: Health, Prevention and Economics. Oxford,
Oxford University Press; 1988.
33. Brouwer WB, Niessen LW, Postma MJ, Rutten FF: Need for differential
discounting of costs and health effects in cost effectiveness analyses.
BMJ 2005, 331:446-448.
34. Gnann JW Jr, Whitley RJ: Clinical practice. Herpes zoster. N Engl J Med
2002, 347:340-346.
35. Gilden DH, Kleinschmidt-DeMasters BK, LaGuardia JJ, Mahalingam R,
Cohrs RJ: Neurologic complications of the reactivation of varicella-
zoster virus. N Engl J Med 2000, 342:635-645.
doi: 10.1186/1478-7547-8-7
Cite this article as: Moore et al., A health economic model for evaluating a
vaccine for the prevention of herpes zoster and post-herpetic neuralgia in
the UK Cost Effectiveness and Resource Allocation 2010, 8:7