Báo cáo y học: "Economic modeling of the combined effects of HIV-disease, cholesterol and lipoatrophy based on ACTG 5142 trial data" pps
Bạn đang xem bản rút gọn của tài liệu. Xem và tải ngay bản đầy đủ của tài liệu tại đây (336.64 KB, 10 trang )
RESEARCH Open Access
Economic modeling of the combined effects of
HIV-disease, cholesterol and lipoatrophy based on
ACTG 5142 trial data
Kit N Simpson
1*
, Birgitta Dietz
3
, Robert W Baran
2
, Kevin W Garren
2
, Sharon A Riddler
4
, Menaka Bhor
2
and
Richard H Haubrich
5
Abstract
Background: This study examines the cost and consequences of initiating an ARV regimen including Lopinavir/
ritonavir (LPV/r) or Efavirenz (EFV), using data from a recent clinical trial in a previously published model of HIV-
disease.
Methods: We populated the Markov model of HIV-disease with data from ACTG 5142 study to estimate the
economic outcomes of starting ARV therapy with a PI-containing regimen as compared to an NNRTI-containing
regimen, given their virologic and immunologic efficacy and effects on cholesterol and lipoatrophy. CNS toxicities
and GI tolerability were not included in the model because of their transient nature or low cost remedies, and
therefore lack of economic impact. CD4+ T-cell counts and the HIV-1 RNA (viral load) values from the study were
used to assign a specific health state (HS) to each patient for each quarter year. The resulting frequencies used as
“raw” data directly into the model obviate the reliance on statistical tests, and allow the model to reflect actual
patient behavior in the clinical trial. An HS just below the last observed HS was used to replace a missing value.
Results: The modeled estimates (undiscounted) for the LPV/r-based regimen resulted in 1.41 quality-adjusted life
months (QALMs) gained over a lifetime compared to the EFV-based regimen. The LPV/r-based regimen incurred
$7,458 (1.8%) greater cost over a lifetime due to differences in drug costs and survival. The incremental cost
effectiveness ratio using the discounted cost and QALYs was $88,829/QALY. Most of the higher costs accrue before
the 7th year of treatment and were offset by subsequent savings. The estimates are highly sensitive to the effect
of lipoatrophy on Health-related Quality of Life (HRQOL), but not to the effect of cholesterol levels.
Conclusions: The cost effectiveness of ARV regimens may be strongly affected by enduring AEs, such as
lipoatrophy. It is important to consider specific AE effects from all drugs in a regimen when ARVs are compared.
Trial registration: (ClinicalTrials.gov number, NCT00050895http://[ClinicalTrials.gov]).
Keywords: lopinavir/ritonavir efavirenz, antiretroviral therapy, HIV, AIDS, Markov model, economics
Background
The use of combination antire troviral therapy (ART) has
led to a well-documented trend of declining AIDS-related
morbidity and mortality among HIV-positive patients
[1-3]. Treatment strategies for HIV/AIDS have changed
over time [4-6] as therapies have evolved to bec ome
more convenient and tolerable. For treatment naïve
patients, current DHHS and other guidelines recommend
regimens with two nucleoside reverse transcriptase inhi-
bitors (NRTIs) and either a protease inhibitor (PI), an
integrase strand transfer inhibitor (INSTI) or a non-
nucleoside reverse transcript ase inhibitor (NNRTI) [7,8].
Both NNRTI- and PI-based regimens result in suppres-
sion of HIV RNA levels and C D4+ T-cell increases i n a
large majority of patients [9-13]. The u se of ritonavir-
boosted PIs have led to improved virological suppression
compared to non-ritonavir PI regimens, as detailed in
clinical trials [[14,15], and [16]] and cohort studies [17],
* Correspondence:
1
Medical University of South Carolina, SC, USA
Full list of author information is available at the end of the article
Simpson et al. Cost Effectiveness and Resource Allocation 2011, 9:5
/>© 2011 Simpson et al; licensee BioMed Central Ltd. This is an Open Access article distributed u nder the terms of the Creative
Commons Attribution License ( which permits unrestricted use, distribution, and
reproduction in any medium, provided the origi nal work is properly cited.
as well as improved clinical outcomes in observational
cohort studies [18].
Head-to-head randomized clinical trials are accepted as
the most powerful tool for assessing the e ffectiveness of
medical interventions. The AIDS Clinical Tr ials Group
(ACTG) 5142 study was a large, randomized, phase III
trial that was designed to compare the efficacy of 2 recom-
mended first-line regimens-an NNRTI-based regimen
consisting of efavirenz (EFV) plus 2 NRTIs and a PI-based
regimen consisting of lopinavir/ritonavir (LPV/r) plus 2
NRTIs. In terms of virologic outcomes, the EFV-based
regimen was more effective with significantly higher rates
of virologic suppression and longer time to virologic fail-
ure than LPV/r plus 2 NRTIs [12].
In the ACTG 5142 s tudy , although patients were less
likely to experience virologic failure with the EFV-based
regimens, those who did fail on EFV-based regimen
(26%) were significantly (P < 0.001) more likely to have
mutat ions associated with resistance to two drug classes
than those who failed after receiving LPV/r plus 2
NRTIs(1%) [12]. For the two study arms used in model-
ing analysis, the resistance was 9% for the EFV-based
regimen and 6% for the LPV-based arm.
Previous retrospective and cross-study comparisons
have suggested that CD4+ T-cell recovery is better with
PI regimens than with NNRTI-based regimens [19,20].
In ACTG5142 patients had a significantly (p = 0.01)
greater CD4+ T-cell count increase from baseline to
week 96 on the LPV/r-containing regimen (287 cells per
cubic millimeter, as compared to the EFV-containing
regimen (230 cells per cubic millimeter) [12].
Lipoatrophy (fat loss usually seen in the face, arms, legs
and buttock area) remains among the most devastating,
and even stigmatizing, side effects of antiretroviral medica-
tions. Lipoatrophy is associated with a negative impact on
the Health Related Quality of Life (HRQOL) in HIV-
infected individuals [21]. The incidence of lipoatrophy can
be attributed to use of t hymidine analogues as NRTIs. In
the ACTG 5142 the NRTI of choice was Zidovudine
(ZDV) 42%, stavudine (d4T XR ) 24%, and Tenofovir
(TDF 34%). By week 96 of the ACTG 5142 trial the DEXA
defined lipoatrophy in the EFV + NRTI (32%) or LPV
+NRTI (17%) arms was predominantly seen in the d4T- or
ZDV-containing regimens; there was no significant differ-
ence (p > 0.5) in lipoatrophy between TDF- containing
(LPV-TDF 6% and EFV-TDF: 12%) and NRTI-sparing
regimens (9%). Overall EFV was associated with a 2.7
times increased risk of developing lipoatrophy (which was
defined as a loss of >20% in fat (ACTG definition)) when
used with 2 NRTIs compared to LPV/r when used with 2
NRTIs [22].
Under t hese premises, the LPV/r-containing ARV
regimen is expected to be more beneficial in terms of
genetic barrier to resistance and also a reduced
propensity to lipoatrophy compared to the EFV-based
regimen. These attributes potentially increase the value
of LPV/r in terms of health and economic outcomes.
However there was a major trade-off between the regi-
mens: Failure was less common with EFV plus 2 NRTIs,
but the impact of failure was greater in terms of
increased rate of resistance. This study examines the
expected long term cost and consequences of initiating
an ARV regimen including LPV/r or EFV, using data
from two of the three arms in the ACTG 5142 clinical
trial that compared EFV plus two NRTIs and LPV plus
2 NRTIS. These data were used as parameters in a pre-
viously published Markov model for HIV-disease which
is described below.
Methods
Study Population
The study population consisted of HIV-1-infected male
and female patients at least 13 years of age who had not
received previous ART and participated in the ACTG
5142 study. Data from the 2 NRTI-containing arms with
LPV or EFV were used for this analysis.
Study Design
A Markov model of HIV-disease [23,24,21] was popu-
lated with data (on viral load, CD4+ T-cell count, treat-
ment-emergent resistance, treatment-emergent
lipoatrophy (measured by DEXA scan) and health-related
quality of life (HRQOL) from the ACTG 5142 study to
estimate the economic outcomes of starting ARV therapy
with a PI-containing regimen as compared to an NNRTI-
containing regimen, given their virologic and immun olo-
gic efficacy and effects on cholesterol and lipoatrophy.
The effects of CNS toxicities were not included in the
model because of their often transient nature, and the
effects of diarrhea were not included in the model
because of short dur atio n which decreased overtime, th e
low cost remedies used in management, and lack o f sig-
nificant effect on patien ts’ quality of life measure (p =
.0818) in the trial data and hence lack of economic
impact on the model results.
Model Structure and Health States
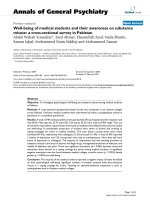
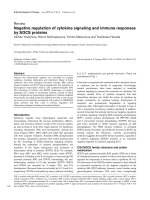
The base model structure used in this study is depicted
in Figure 1. This model has been used previously to esti-
mate economic outcomes for LPV/r, atazanavir, and
tipranavir [24,21] and its structure, assumptions and
predictive validity has been published elsewhere [23].
The main efficacy measures were based on the
observed CD4+ T-cell counts and the viral load (VL)
values from the stu dy. The baseline value for the CD4+
T-cell count was used, while the last recorded (entry)
VL value was used to define a patient’s health state (HS)
at baseline. The resulting frequencies were used as “raw”
Simpson et al. Cost Effectiveness and Resource Allocation 2011, 9:5
/>Page 2 of 10
data and populated directly into the model. This allows
the model to be based on the actual behavior of the
CD4+ T-cell counts and VL recorded in the clinical trial
instead of using a mean or median estimate as an input.
The clinical trial period after randomization (96 weeks)
was divided into 8 quarters, and a HS was assigned to
each patient for each quarter based on the recorded CD4
+ T-cell counts and viral load values. The mean quarter
valuefortheCD4+T-cellcount,andthelastrecorded
VL value in the quarter w ere used to define a patient’ s
HS. The percent distrib ution for t he model HS for the
first fo ur quarters for each regimen was used to popula te
the model HSs for those quarters. Patients without obser-
vations for a quarter were treated as failures and assigned
to an HS just below the last observed HS.
Drop-out Rate
There were no differences between the LPV/r and EFV
regimens in the distribution of dropouts by quarter in
the data used to populate the model (p = 0.2801), nor
did the distribution of dropouts for the two regimens
differ by the last HS occupied (p = 0.8674).
Failure Rate
The Markov model has in the past used a transition
matrix that was based on data from 1999 and 2000 for
antiretroviral-naïve patients. However, recent data pre-
sented for ARV-experien ced patients indicate that
average failure rates w ere reduced by about 50 percent
between 2000-2001 and 2005 [25]. This finding required
that the failure rates for the study patients after the
fourth quarter be compared to the failure rates assumed
in the model’s transition matrix. To do this the observa-
tions after 52 weeks were classified by model HS for each
subsequent quarter in the manner described above for
the early quarters. These data were then used to estimate
the failure rates (transitions) expected after the end of
the fourth quarter. While there were no significant differ-
ences in the failure rates for the two regimens ( p =
0.3691), the study failure rates were somewhat improved
over the rates used in the original model transition
matrix. Thus, the model transition matrix was updated
using the observed study failure rates for all health states
that had at least 20 transition observations. The percent
of patients in HS1, HS3, HS5 and HS8 (the undetectable
VL health states), which had VL below 50 copies/ml for
the two treatment regimens, were also examined. There
were no differences in the proportion of patients in HSs
with undetectable VL whose VL was below 50 copies/ml
for the two regimens in quarter 4 (p = 0.1021) and in
quarter 8 (p = 0.1028). Thus a transition matrix, which
was updated using the pooled study data, was used to
estimate the regimen’ s progression in the model after
end of the initial four quarters, making the failure rates
used in the model identical for the EFV and LPV/r regi-
men for the time period after the end of the study data.
Mode l Stage 1
PI
+ 2NRTIs
Mode l Stage 2
Ne w PI
pl us Ne w NRTIs
or NNRTI
Mode l Stage 3
2 New P I, new NRTIs
perhaps NNRTI
Intermediate Period 1
(3 months)
Switch to new therapy
Health state improves
Intermedia t e Period 2
(3 months)
Switch to new therapy
Health state improves,
but not as much as in 1
AIDS or
CHD
EVENTS
DEATH
absorbing
state
Figure 1 Model Structure.
Simpson et al. Cost Effectiveness and Resource Allocation 2011, 9:5
/>Page 3 of 10
Health Related Quality of Life Adjustment
The Markov model has in the past used utility weights
that were extracted from pooled EuroQoL (EQ5D) data
from about 21,000 responses from patients enrolled in a
large number of early ARV studies [26]. However, there
is anecdotal eviden ce that today’ s ARV regimens may
result in a different level of health related quality of life
than older ARV regimens. The ACTG 5142 trial data
included a generalized health-related quality of life ques-
tion which could be converted to utility weights using a
simple linear transformation where the utility u = 0.44
V + 0.49 (V = the visual analog score given by the
patient) as reported by Mrus and colleagues (2003) [27].
The resulting utilit y weights for the model health states
were generally decreasing as the CD4 + T-Cells and
VL-defined he alth states worsened. The new utility
values were used in the Base Estimate, and the effects of
using the original model utility weights tested in the
sensitivity analysis. The original model health state uti-
lityvaluesandthevaluesthatarebasedontheACTG
trial data are provided in Table 1. The ACTG 5142 uti-
lity weights exhibit less monotonicity, probably because
of a much smaller sample size for each of the health
states.
Lipoatrophy Sub-Model
The original model did not take the development of
lipoatrophy into account when estimating the health
related quality of life (HRQOL) estimated from each of
the treatment regimens. However, Haubrich and collea-
gue s (2007) [22] reported lipoatrophy-defined by DEXA
scan at 96 weeks (LPV/r = 17%; EFV = 32%). We used
the percent of patients with 20% loss of limb fat by
DEXA measurement, as defined by the study protocol as
the basis for estimating the differences in the proportion
expected to develop lipoatrophy over time for the two
regimens. Assumptions related to the effects of the rate
of lipoatrophy were tested in the sensitivity analysis.
The economic effect of lipoatrophy was assumed to be
limited to 10% of individuals with the condition, and to
develop slowly over a five year period. The effect of
lipoatrophy on HRQOL was estimated using a utility
decrement approach based on the average decrement
observed across all individuals in the study. The
ACTG5142 study collected data on participants’ reported
body changes due to lipoatrophy that included three ques-
tions. Using those data, we calculated decrements in utili-
ties due to lipoatrophy for the model. The questions of
interest were related to fat redistribution in the face, but-
tocks, arms, and legs. Patients who answered ‘yes’ to these
questions reported significantly lower utility weights than
patients who answered ‘no’ to the re-distribution of body
fat. Since there was a difference between treatments in the
proportion of patients who developed lipoatrophy based
on DEXA scan (not including facial l ipoatrophy) i n the
ACTG 5142 study, we constructed a sub-model that
assigned a decrement of 0.05 utility due to the effects of
lipoatrophy on HRQOL. The results of the analysis of the
utility values for patients with and without evidence of
lipoatrophy are provided in Table 2.
Lipoatrophy may increase cost of care for some patients.
Some patients will seek tre atment for this condition. The
mod el assumes that 1.7 and 3.2 percent (LPV/r and EFV
groups respectively) of patients seek treatment for lipoa-
trophy. Treatment consists of 30 ml Poly-lactic acid injec-
tions every 3 years at a cost of $4,190 [28] per treatment.
In the model this cost is assigned as $35 per quarter over
the time with lipoatrophy. This assumption allows the
model to accommodate the fact that clinical lipoatrophy
developed slowly over time, and that only a small fraction
of patients seek treatment for the condition.
Cost Data Sources
Cost per AIDS event is based on average costs calcu-
lated from the analysis of U.S. Medicaid payment and
hospital all-payer discharge data for patients with AIDS
diagnoses. Cost resulting from added risk of coronary
heart disease (CHD) due to increased total cholesterol
values are estimated based on hospitalization cost data
for patients with a myocardial infarction (MI) diagnosis.
Table 1 Original Model Utility Weights and Utility
Weights Based on ACTG5142 Data
Health
State
Original Model Utility
Weights
ACTG5142 Utility
Weights (SD)
HS 1 0.954 0.849 (.068)
HS 2 0.938 0.851 (.052)
HS 3 0.934 0.852 (.062)
HS 4 0.931 0.825 (.066)
HS 5 0.929 0.839 (.072)
HS 6 0.931 0.819 (.080)
HS 7 0.933 0.820 (.087)
HS 8 0.863 0.829 (.077)
HS 9 0.865 0.830 (.092)
HS 10 0.826 0.722 (.109)
HS 11 0.876 0.783 (.099)
HS 12 0.781 0.792 (.088)
Table 2 Effect of Lipoatrophy on Utility Weights
Lipoatrophy Symptoms Yes (SD) No (SD) P value*
Have your cheeks sunken? 0.811 (.073) 0.846 (.071) <0.0001
Have you lost fat in the butt? 0.813 (.079) 0.848 (.069) <0.0001
Have you lost fat in your arms
and legs?
0.815 (.080) 0.848 (.069) <0.0001
Mean utility decrement
controlling for HS
-0.052
Simpson et al. Cost Effectiveness and Resource Allocation 2011, 9:5
/>Page 4 of 10
Average cost per AIDS event is $31,881 (range $1,093
for cervical cancer to $214,280 for CMV retinitis) [29].
Cost per CHD event is $25,423 based on average costs
for hospital admissions for MI patients in the US in
2005 [30]. Cost of lipid-lowering therapy is assumed to
be $2.68 per day, and this value is used for the remain-
ing lifetime. The ART drug costs are based on the US
daily average wholesale price [31]. These are $26.54 for
LPV/r tablets, $16.65 for EFV, $26.19 for the NRTI
backbone, $30.07 f or darunavir, $68.07 for enfuvirtide,
and $14.75 for etravirine. All other model costs are
reported as the 2007 present value in US currency.
Costs and outcomes ar e discounted by 3 percent for the
calculation of the incremental cost effectiveness and
cost utility ratios. The perspective of the analysis is that
of the government/third party payer, and does not
include indirect costs in the model cost estimates. These
model input factors are summarized in Table 3.
Other Assumptions
Cholesterol levels were assumed to be equal for the two
regimens based on the published study report [12].
The 2
nd
regimen for patient who received LPV/r initi-
ally was assumed to be EFV-based, (and vice versa) based
on the stipulation in the trial pr otocol, the third regimen
in the model was assumed to be based on Darunavir.
After 96 weeks in the clinical trial, 19 percent of patients
with virologic failure on LPV/r and 30 percent of patients
on EFV were reported to have NRTI resistance [32]. The
ove rall study rate of resistant mutations observed wer e 9
percent for the EFV regimen and 6 percent for LPV/r
regimen.
Intheresistancedataforallvirologicalfailuresinthe
trial, there were no cases where a second ARV regimen
with three fully active drugs could not be constructed.
Thus, the resist ance rates were used only for estimating
the cost of the third regimen. It was assumed t hat
patients with any virus mutation that was resistant after
the first regimen (EFV = 30% and LPV/r = 19% based
on the trial resistance data for the proportion of patients
with virologic failure who had NRTI resistance) would
require a more complex drug reg imen after a second
failure. The effects of 6 and 9 percent resistance, 6 per-
cent resistance for both regimens, and no resistance
effects on the third regimen are modeled in the sensitiv-
ity analyses. The base model assumption was that 75 per-
cent of patients with resistant virus would receive
etravirine and that 25 percent would receive enfuvirtide
as part of their third regimen. This reflects the current
guideline recommendation that a new regimen should
have at least 2 and preferably 3 active drugs, if possible.
Patient Distribution at Baseline
We compared the differences in the distribution of
patients among the eight possible model HS (HS with
undetectable VL are not possible at baseline) for t he
LPV/r arm and the efavirenz (EFV) arm using a Chi
square test (Table 4). This comparison is needed because
randomization does not always assure a comparable distri-
bution of surrogate markers across a Markov model’sHS
at baseline. We found a significant difference in the distri-
bution of patients among the baseline HS, with EFV
patients being distributed mo re towards the extreme HS,
and LPV/r patients distributed more i n the middle HS
(p = 0.0301).
This significant difference in the distribution of
patients among the HS at baseline required an analysis to
estimate the effect of this potential bias on the cost effec-
tiveness of the two study regimens. To examine t his
effect the maximum observations within each baseline
HS were randomly selected for each regimen and the
data from this sm aller cohort were used in a sensitivity
analysis. The baseline distribution between health states
for this sub-population is provided in Table 5.
Results
The estimates for the Base Model are provided in Table 6.
The modeled estimates (undiscounted) for the LPV/r-
based regimen resulted in 1.41 quality-adjusted life
months (QALMs) gained over a lifetime compared to the
EFV-based regimen. The LPV/r-based regimen incurred
$7,458 (1.8%) greater cost over a lifetime due to differ-
ences in drug costs and survival. The inc remental c ost
effectiveness ratio using the discounted cost and QALYs is
$88,829/QALY. Based on the Budget Impact model (Table
6) there was a 2.7% increase in ARV budget lifetime
(undiscounted) costs for patients starting on LPV/r-based
regimen as compar ed to patients who st arted on EFV
based regimen. The estimates for the model using a
Table 3 Cost Parameters Used in the Base-Model and
Sources of Costs
Description Unit
Cost
Source
Mean cost per AIDS event $31,881 SC Medicaid population
[29]
Mean cost per MI event $25,423 SC Medicaid population
Cost per lipoatrophy treatment $4,190 Hornberger [28]
Cost per monitoring visit $334 SC Medicaid population
Cost of switching ARV regimen $334 SC Medicaid population
Lipid-lowering drugs, cost per
day
$2.68 AWP Red Book 2007 [31]
LPV/r cost per day $26.54 AWP Red Book 2007
EFV cost per day $16.65 AWP Red Book 2007
NRTI backbone, cost per day $26.19 AWP Red Book 2007
Darunavir cost per day $30.07 AWP Red Book 2007
Etravirine cost per day $14.75 AWP Red Book 2007
Enfuvirtide cost per day $68.07 AWP Red Book 2007
Simpson et al. Cost Effectiveness and Resource Allocation 2011, 9:5
/>Page 5 of 10
random selection of patients that are equally d istributed
among the health states at baseline are provided in
Table 7.
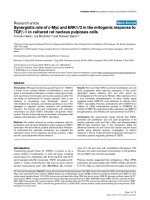
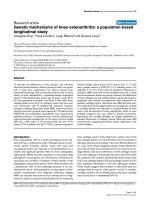
Sensitivity Analysis
The results of the sensitivity analysis of the effects of
key model assumptio ns on the Incremental Cost Effec-
tiveness Ratio (ICER) are presented in Table 8 and
Figure 2.
Discussion
This study uses a decision-analysis modeling approach
with the model inputs deriv ed from patient-level clinical
trial data to compare the expected long term economic
and HRQOL consequences of initiating ART therapy
with a n NNRTI-based vs. a PI-based regimen for treat-
ment-naive patients. The resulting modeling estimates
prov ide information on the importance of judging clini-
cal trial results for ARV regimens on more than simply
the VL suppression at 48 weeks under intent-to-treat
analytical assumptions.
The model estimated an increase of 1.41 months per
patient of quality adjusted survival for the PI-based
cohort. This difference was mainly due to the higher
rate of lipoatrophy in the NNRTI-arm of the study. It is
not the cost of treating lipoatrophy that appears to be
the most important factor in the model. When we chan-
ged the cost of treating this AE the predicted ICER
increases minimally from $88,829/QALY to $91,226/
QALY. If the cost of the EFV regimen increases by
$4.60/day then the LPV/r regimen becomes dominant.
However, when we assume a 50 percent reduction in
the HRQOL weight associated with lipoatrophy the
ICER increases from $88,829/QALY in the base model,
to $175,538/QALY (see figure 2). Thus, the effect of
lipoatrophy on patients’ quality of l ife is a much more
important variable than is the cost of treating this con-
dition. T his is an important issue, since the differential
rate of lipoatrophy reported in the study may be par-
tially due to the NRTI backbone combinations used in
ACTG5142. Since the study ev aluated NRTI-backbone
regimens that are no longer recommended by the guide-
lines [7] for initial ARV treatment and whic h are cur-
rently not used in clinical practice, the effect on the
ICER of AEs that may be more strongly associated with
specific NRTI drugs should be noted.
The results of this study makes it clear that short and
medium time cost savings resulting for a choice of ARV
therapy are not synonymous with cost effectiveness when
lifetime impacts are considered. The model estimated
mean cost savings of $11,994, $10,307, and $7,458 per
patient at y ears 5, 10, and lifetime, respectively for the
NNRTI cohort. The incremental cost effectiveness ratio
(ICER) for the LPV/r regimen in the base model was
$88,829/QA LY gained, which is considered cost effect ive
for the US under the WHO criteria [33].
However, the lifetime incre mental cost effectiveness
ratios (ICER) for the two regimens varied greatly. The
Table 4 Patient Distribution Between the Model Health States at Baseline
Base Health State CD4 Range VL Range EFV Percent LPV/r Percent Difference %*
2 >500 >400 6.4 2.8 3.6
4 350-499 >400 14.8 11.4 3.4
6 200-349 400-10,000 8.8 8.7 0.1
7 200-349 >10,000 18.8 23.2 -4.4
9 50-199 400-10,000 3.6 2.4 1.2
10 50-199 10,001-100,000 10.0 16.9 -6.9
11 50-199 >100,000 11.2 15.4 -4.2
12 <50 any 26.4 19.3 7.1
*Chi-Square 15.5; p = 0.0301
Table 5 Baseline Distribution among the Model Health States after Random Selection of Patients (n = 213 per arm)
Base Health State CD4 Range VL Range EFV Number of Patients LPV/r Number of Patients
2 >500 >400 7 7
4 350-499 >400 29 29
6 200-349 400-10,000 22 22
7 200-349 >10,000 47 47
9 50-199 400-10,000 6 6
10 50-199 10,001-100,000 25 25
11 50-199 >100,000 28 28
12 <50 Any 49 49
Simpson et al. Cost Effectiveness and Resource Allocation 2011, 9:5
/>Page 6 of 10
ICER for the LPV/r regimen depends on the cost
assumptions used in the model, the effects of different
model assumptions with regards to the second and third
ARV regimens to which the population was switched
once the initial regimen failed, and the utility values asso-
ciated with lipoatrophy. Assumptions varied in the sensi-
tivity analyses resulted in varying the ICER estimates
between $68,535 and $175,538. The adjustment of the
population at baseline that was introduced to examine
the effects of uneven dist ributio n of patient s among the
model health states at baseline changed the ICER to
$117,234/QALY. However, changing the utility weight
for patients who experienced lipoatrophy resulted in
ICERs between $68,535/QALY and $175,538/QALY for
the LPV/r group, depending on the assumptions about
the utility weight (Table 8). The ICER increases to
$171 ,187/QALY when we assume that the rates of lipoa-
trophy are 6 and 12 percent (LPV/r and EFV respectively)
as were reported for the TDF subgroup in the trial. These
findings illustrate the fact that when economic, quality of
life and p atient preferences are all considered , then there
is probably no “best” regi men for all patients. The volati-
lity of the ICER when assumptions for AE rates and the
risk of developing resistance to the third regimen are
changed indic ate that the value generated by a specific
ARV regimen choice may be greatly affected by how
much the adverse effects associated with a regimen affect
apatient’ s HRQOL, and the level of risk of the virus
becoming resistant to future regimens.
Thi s decision ana lysis study used a Markov model for
estimation, and any modeling result is only as good as
the ability of the model’s structure to capture the essen-
tial aspects of the disease an d treatment process. We
have used a peer-re viewed and previously published
model [24] in this analysis to minimize any bias which
could be caused by a poorly structured model. However,
the validity of an estimate from a model i s also highly
dependent on the validity of the parameters used i n the
model. We have used simple frequencies calculated
from the “ raw” data for the first four quarters of th e
clinical trial of the two d rug regimens [12] to populate
the model. This approach, while simplistic, has several
advantages: 1) it reflects the actual behavior of the data
in the study, including the correlation between variables;
and 2) it is simple to understand , and not dependent on
statistical tests of significance which are affected by sam-
ple size and the innate variation in measurements. We
have tested the effects of the variations in the data and
of the assumptions made in the model for progression
after the end of the cli nical trial by performing sensitiv-
ity analyses that use different assumptions and utility
weights. This approa ch helps in the identification of the
Table 6 Cost, Consequences per 100 Patients, and Cost Effectiveness of Using an Initial Antirethroviral Regimen of
LPV/r Followed by Efavirenz
Variable Estimated LPV/r EFV Difference ICER
Undiscounted QALYs 1,163 1,151 11.7
QALY months gained per person 1.41
months
QALYs discounted 944 935 9.388
Costs discounted $32,365,777 $31,531,823 $833,953
Cost per QALY $88,829/
QALY*
5 year mean total cost/patient undiscounted $115,219 $103,226 $11,994
10 year mean total cost/patient undiscounted $221,428 $211,121 $10,307
Lifetime mean total cost/patient undiscounted $413,767 $406,309 $7,458 1.8% increase
for LPV/r
ANTIRETROVIRAL BUDGET IMPACT
LPV/r EFV Difference Percent
Increase
5 year cost of ARV drugs per patient (undiscounted) $90,336 $78,536 $11,800
10 year cost of ARV drugs per patient (undiscounted) $172,421 $162,160 $10,261
Percent Lifetime ARV budget increase estimated for using LPV/r first, per patient
(undiscounted)
$279,697 $272,289 $7,408 2.7%
* Errors due to rounding
Table 7 Health Outcomes and Cost Effectiveness for the Base Model and the Baseline-adjusted Model
Variable Estimated Base Model Adjusted Baseline Model “Old” Utility Values Model
QALY months gained per person 1.41 months 1.04 months 1.44 months
Cost per QALY for LPV/r $88,829/QALY $117,234/QALY $86,256/QALY
Simpson et al. Cost Effectiveness and Resource Allocation 2011, 9:5
/>Page 7 of 10
Table 8 Base Model Estimate and Sensitivity Analysis of the Effects of Key Model Assumption on the Incremental Cost
Effectiveness Ratio
Changes of Assumptions in the Model Cost per QALY
Base estimate $88,829
This model assumes that 19% of patients who fail the LPV/r with ANY resistance and the 30% who fail EFV with ANY resistance
will have Etravirine added to Darunavir as their 3
rd
regimen
$98,581
As above but using darunavir blended price* of $43.85 per day in 3
rd
regimen $98,210
Base model but using the utility values from the published Simpson model $95,432
This model assumes that the 1% of patients who fail the LPV/r with 2 class resistance and the 26% who fail EFV with 2 class
resistance will have Etravirine added to Darunavir as their 3
rd
regimen
$53,095
This model assumes that 6% of patients fail the LPV/r with NRTI resistance and 9% fail EFV with NRTI resistance, and that these
patients will have Etravirine added to Darunavir as their 3
rd
regimen
$116,797
This model assumes that there is no effect of choice of first regimen on the cost of the 3
rd
treatment due to resistance $116,774
Change AIDS event cost +20% or -20% $99,238 and
97,924
Change heart disease cost +20% or -20% $98,583 and
$98,579
Change Lipoatrophy cost +20% or - 20% $98,108 and
$99,054
No cost of treating lipoatrophy $91,226
Lipoatrophy rates 6% and 12% as observed in the TDF sub-groups $171,187
Change Lipoatrophy QALY to “+50% and -50%” (from 052 in base model to 026 or 078) $175,538 and
$68,535
* Blended price is average selling price (ASP) across all the channels of market
$20,000 $40,000 $60,000 $80,000 $100,000 $120,000 $140,000 $160,000 $180,000
Blended Darunavir price
Simpson model utilities
Correction for baseline imbalance
1% LPV/r and 26% EFV two-class resistance
6% LPV/r and 9% EFV resistance in 3rd regimen
No resistance in 3rd regimen
AIDS cost +20%
AIDS costs - 20%
Heart disease costs +20%
Heart Disease cost - 20%
Lipoatrophy cost + 20%
Lipoatrophy cost - 20%
Lipoatrophy as reported for TDF regimens
Lipoatrophy QALY penalty 50% increased
Lipoatrophy QALY penalty 50% decreased
Adjustment Made to Base Model Assumption
Figure 2 Effects of Sensitivity Analysis on the Incremental Cost Effectiveness Ratio Estimates for the Model.
Simpson et al. Cost Effectiveness and Resource Allocation 2011, 9:5
/>Page 8 of 10
most important factors that may affect the modeling
estimates.
Thus, the modeling estimates capture many of the
major variations in long term cost and health related
quality of life that may be expected from the cohorts of
patients that contributed to the trial data. The model is
limited in that CNS and gastrointestinal side effects
(which can sometimes be chronic) are not included in
the model. Randomized clinical trial results are the gold
standard for defining safety and efficacy of therapy, but
are limited t o the relatively short duration of the study
in comparison with l ife-long treatment currently needed
for HIV- infection. This study illustrates the fact that
costs, health related quality of life, adverse events, and
the effect of resistance on the mixture of drugs in subse-
quent regimens intera ct and may affect long term cost
and consequences.
Conclusions
Based on the assumptions m ade in the model, it appears
that the choice of an initial ART regimen for treatment-
naive patients should consider how adverse an individual
patient is to specific side effects of a regimen, i n addition
to more commonly recogni zed issues, such as the rate of
adverse effects, AIDS-related events and opportunistic
infections that warra nt highly expensive treatments, as
well as the ART-regimen’ s acquisition cost, expected
effects on viral load suppression, CD4 + T-cell increase,
and resistance induced to subsequent regimens.
Acknowledgements
Special thanks to ACTG 5142 protocol team, study volunteers, the investigators
and study staff from 55 participating ACTG sites, SDAC, Specialty Laboratories,
pharmaceutical sponsors: Abbott Laboratories, Bristol Myers Squibb and Gilead
Sciences, and NIH/NIAID. We also wish to thank Rukmini Rajagopalan for her
assistance in the development of the initial study concept.
Supported by grants (AI 068636 [AIDS Clinical Trials Group Central Grant], AI
068634, AI 069471, AI 27661, AI 069439, AI 25859, AI 069477, AI 069513, AI
069452, AI 27673, AI 069470, AI 069474, AI 069411, AI 069423, AI 069494, AI
069484, AI 069472, AI 38858, AI 069501, AI 32783, AI 069450, AI 32782, AI
069465, AI 069424, AI 38858, AI 069447, AI 069495, AI 069502, AI 069556, AI
069432, AI 46370, AI 069532, AI 46381, AI 46376, AI 34853, AI 069434, AI
060354, AI 064086, AI 36214, AI 069419, AI 069418, AI 50410, AI 45008, RR
00075, RR 00032, RR 00044, RR 00046, RR 02635, RR 00051, RR 00052, RR
00096, RR 00047, RR 00039, and DA 12121) from the National Institute of
Allergy and Infectious Diseases, National Institutes of Health.
Author details
1
Medical University of South Carolina, SC, USA.
2
Abbott Laboratories, Abbott
Park, IL, USA.
3
Abbott GmbH & Co KG, Ludwigshafen, Germany.
4
University
of Pittsburgh, Pittsburgh, PA, USA.
5
University of California, San Diego, CA,
USA.
Authors’ contributions
KS analyzed the ACTG 5142 data, conceptualized and programmed the
economic model, and lead the writing of the manuscript. BD and RB
provided model cost input data and collaborated on writing the manuscript.
MB drafted parts of the manuscript. KG SR and RH participated in the design
of the study, lead the interpretation of the ACTG 5142 data and collaborated
on writing the manuscript. All authors read and approved the final
manuscript.
Competing interests
KS was the principal investigator on a grant by Abbott to MUSC to perform
the study. BD, RB KG and MB are Abbott employees. SR and RH have no
competing interests.
Received: 27 May 2010 Accepted: 8 May 2011 Published: 8 May 2011
References
1. Palella FJ Jr, Delaney KM, Moorman AC, et al: Declining morbidity and
mortality among patients with advanced human immunodeficiency
virus infection. HIV Outpatient Study Investigators. N Engl J Med 1998,
338:853-60.
2. Hogg RS, Yip B, Kully C, et al: Improved survival among HIV-infected
patients after initiation of triple-drug antiretroviral regimens. CMAJ 1999,
160:659-65.
3. Arici C, Ripamo nti D, Ravasio V, et al: Long-term clinical benefit after
highly active antiretroviral therapy in advanced HIV-1 infection, even
in patients without imm une reconstitution. Int J STD AIDS 2 001,
12:573-81.
4. Carpenter CC, Fischl MA, Hammer SM, et al: Antiretroviral therapy for HIV
infection in 1996. Recommendations of an international panel.
International AIDS Society-USA. JAMA 1996, 276:146-54.
5. Carpenter CC, Cooper DA, Fischl MA, et al: Antiretroviral therapy in adults:
updated recommendations of the International AIDS Society-USA Panel.
JAMA 2000, 283:381-90.
6. Hammer SM, Saag MS, Schechter M, et al: Treatment for adult HIV
infection: 2006 recommendations of the International AIDS Society-USA
Panel. JAMA 2006, 296:827-43.
7. Panel on Clinical Practices for Treatment of HIV Infection. Guidelines for
the use of antiretroviral agents in HIV-1-infected adults and adolescents.
2009 [ />12-26-09.
8. Yeni PG, Hammer SM, Hirsch MS, et al: Treatment for adult HIV infection:
2004 recommendations of the International AIDS Society-USA Panel.
JAMA 2004, 292:251-265.
9. Gulick RM, Ribaudo HJ, Shikuma CM, et al: Three- vs four-drug
antiretroviral regimens for the initial treatment of HIV-1 infection: a
randomized controlled trial. JAMA 2006, 296(7):769-81.
10. Gallant JE, Staszewski S, Pozniak AL, et al: Efficacy and safety of tenofovir
DF vs stavudine in combination therapy in antiretroviral-naïve patients:
a 3-year randomized trial. JAMA 2004, 292(2):191-201.
11. Staszewski S, Morales-Ramirez J, Tashima KT, et al: Efavirenz plus
zidovudine and lamivudine, efavirenz plus indinavir, and indinavir plus
zidovudine and lamivudine in the treatment of HIV-1 infection in adults.
N Engl J Med 1999, 341(25):1865-73.
12. Riddler SA, Haubrich R, DiRienzo AG, Peeples L, Powderly WG, Klingman KL,
Garren KW, George T, Rooney JF, Brizz B, Lalloo UG, Murphy RL, Swindells S,
Havlir D, Mellors JW, AIDS Clinical Trials Group Study A5142 Team: Class-
sparing regimens for initial treatment of HIV-1 infection. N Engl J Med
2008, 358(20):2095-106.
13. Squires K, Lazzarin A, Gatell JM, et al
: Comparison
of
Once-Daily
Atazanavir With Efavirenz, Each in Combination With Fixed- Dose
Zidovudine and Lamivudine, As Initial Therapy for Patients Infected With
HIV. J Acquir Immune Defic Syndr 2004, 36(5):1011-9.
14. Walmsley S, Bernstein B, King M, et al: Lopinavir-ritonavir versus nelfinavir
for the initial treatment of HIV infection. N Engl J Med 2002, 346:2039-46.
15. Nachman SA, Stanley K, Yogev R, et al: Nucleoside analogs plus ritonavir
in stable antiretroviral therapy-experienced HIV-infected children: a
randomized controlled trial. Pediatric AIDS Clinical Trials Group 338
Study Team. JAMA 2000, 283:492-8.
16. Eron J Jr, Yeni P, Gathe J Jr, et al: The KLEAN study of
fosamprenavirritonavir versus lopinavir-ritonavir, each in combination
with abacavirlamivudine for initial treatment of HIV infection over 48
weeks: a randomized non-inferiority trial. Lancet 2006, 368:476-82.
17. Wood E, Hogg RS, Yip B, Moore D, Harrigan PR, Montaner JS: Superior
virological response to boosted protease inhibitor-based highly active
antiretroviral therapy in an observational treatment programme. HIV Med
2007, 8:80-5.
18. Lima VD, Hogg RS, Harrigan PR, et al: Continued improvement in survival
among HIV-infected individuals with newer forms of highly active
antiretroviral therapy. AIDS 2007, 21:685-92.
Simpson et al. Cost Effectiveness and Resource Allocation 2011, 9:5
/>Page 9 of 10
19. Barreiro P, Soriano V, Casas E, Gonzalez-Lahoz J: Different degree of
immune recovery using antirretroviral regimens with protease inhibitors
or non-nucleosides. AIDS 2002, 16:245-249.
20. Yasdanpanah Y, Sissoko D, Egger M, et al: Clinical efficacy of antiretroviral
combination therapy based on protease inhibitors or non-nucleoside
analogue reverse transcriptase inhibitors: indirect comparison of
controlled trials. BMJ 2004, 328:249-256.
21. Simpson KN, Jones WJ, Rajagopalan R, Dietz B: Cost-effectiveness of
lopinavir/ritonavir compared to atazanavir plus ritonavir in antiretroviral-
experienced patients in the U.S.: Modeling the combined effects of HIV
and Heart Disease. Clin Drug Invest 2007, 27(7):443-452.
22. Haubrich R, Riddler S, DiRienzo G, et al: Metabolic outcomes of ACTG
5142: A prospective, randomized, phase III trial of NRTI-, PI-, and NNRTI-
sparing regimens for initial treatment of HIV-1 infection. AIDS 14th
Conference on Retroviruses and Opportunistic Infections, Los Angeles; 2007,
Abstract 38.
23. Simpson KN, Roberts G, Hicks CB, Finnern HW: Cost-effectiveness of
Tipranavir in Treatment Experienced HIV Patients in the US. HIV Clinical
Trials 2008, 9(4):225-37.
24. Simpson KN, Luo MP, Chumney ECG, Sun E, Brun S, Ashraf T: Cost
effectiveness of using lopinavir vs. nelfinavir as the first highly active
antiretroviral therapy regimen for HIV infection. HIV Clinical Trials 2004,
5(5):294-304.
25. Simpson KN, Strassburger A, Jones WJ, Dietz B, Rajagopalan R: Comparison
of Markov Model and Discrete Event Simulation (DES) Techniques for
HIV Disease. PharmacoEconomics 2009, 27(2):159-165.
26. Dolan P: Modeling valuations for EuroQoL health states. Med Care 1998,
35:1095-108.
27. Mrus JM, Yi MS, Freedberg KA, et al: Utilities derived from visual analog
scores in patients with HIV/AIDS. Med Decision Making 2003, 23(5):414-421.
28. Hornberger J, Shewade A, Loutfy MR, Rajagopalan R: Cost consequences of
HIV-associated lipoatrophy. AIDS Care .
29. Simpson KN: Unpublished Medicaid costs data for South Carolina, USA.
2002.
30. Castiel D, Herve C, Gaillard M, et al: Cost-utility analysis of early
thrombolytic therapy. PharmacoEconomics 1992, 1(6):438-42.
31. Fleming T: Red Book: Pharmacy’s Fundamental reference. Montvale, PDR
Network; 2007.
32. Swindells S, Jiang H, Mukherjee L, et al: AIDS Clinical Trials Group.
Virologic Drug Resistance Is Not Associated with AIDS-defining Events or
Mortality: An ACTG Longitudindal Linked Randomized Trials Analysis.
16th Conference on Retroviruses and Opportunistic Infections (CROI) Montreal,
Canada; 2009, abstract 659.
33. WHO: Cost-effectiveness thresholds. 2008 [ />costs/CER_thresholds/en/index.html].
doi:10.1186/1478-7547-9-5
Cite this article as: Simpson et al.: Economic modeling of the combined
effects of HIV-disease, cholesterol and lipoatrophy based on ACTG 5142
trial data. Cost Effectiveness and Resource Allocation 2011 9:5.
Submit your next manuscript to BioMed Central
and take full advantage of:
• Convenient online submission
• Thorough peer review
• No space constraints or color figure charges
• Immediate publication on acceptance
• Inclusion in PubMed, CAS, Scopus and Google Scholar
• Research which is freely available for redistribution
Submit your manuscript at
www.biomedcentral.com/submit
Simpson et al. Cost Effectiveness and Resource Allocation 2011, 9:5
/>Page 10 of 10