Báo cáo y học: "Insomnia - treatment pathways, costs and quality of life" docx
Bạn đang xem bản rút gọn của tài liệu. Xem và tải ngay bản đầy đủ của tài liệu tại đây (688.88 KB, 10 trang )
RESEARC H Open Access
Insomnia - treatment pathways, costs and quality
of life
Guy W Scott
1*
, Helen M Scott
2
, Karyn M O’Keeffe
3
and Philippa H Gander
3
Abstract
Background: Insomnia is perhaps the most common sleep disorder in the general population, and is characterised
by a range of complaints around difficulties in initiating and maintaining sleep, together with impaired waking
function. There is little quantitative information on treatment pathways, costs and outcomes. The aims of this New
Zealand study were to determine from which healthca re practitioners patients with insomnia sought treatment,
treatment pathways followed, the net costs of treatment and the quality of life improvements obtained.
Methods: The study was retrospective and prevalence based, and was both cost effectiveness (CEA) and a cost
utility (CUA) analysis. Micro costing techniques were used and a societal analytic perspective was adopted. A
deterministic decision tree model was used to estimate base case values, and a stochastic version, with Monte
Carlo simulation, was used to perform sensitivity analysis. A probability and cost were attached to each event
which enabled the costs for the treatment pathways and average treatment cost to be calculated. The inputs to
the model were prevalence, event pro babilities, resource utilisations, and unit costs. Direct costs and QALYs gained
were evaluated.
Results: The total net benefit of treating a person with insomnia was $482 (the total base case cost of $145 less
health costs avoided of $628). When these results were applied to the total at-risk popul ation in New Zealand
additional treatment costs incurred were $6.6 million, costs avoided $28.4 million and net benefits were $21.8
million. The incremental net benefit when insomnia was “successfully” treated was $3,072 per QALY gained.
Conclusions: The study has brought to light a number of problems relating to the treatment of insomnia in New
Zealand. There is both inadequate access to publicly funded treatment and insufficient pub licly available
information from which a consumer is able to make an informed decision on the treatment and provider options.
This study suggests that successful treatment of insomnia leads to direct cost savings and improved quality of life.
Background
Insomnia is a disorder defined by difficulty initiating or
maintaining sleep, or non-restorative sleep, along with
impaired daytime function. These problems arise despite
adequate time and opportu nity for sleep [1,2]. Insomnia
may occur as primary insomnia or insomnia comorbid to
other medical or psychological conditions, substance
abuse, or other sleep disorders. The outcomes of untreated
insomnia are not well understood but it is known that
insomnia is associated with a number of adverse health
outcomes such as poor physical health, poor mental health
including symptoms of anxiety and depression, and
decreased quality of life [3,4]. There is currently no sys-
tematic national approach to insomnia diagnosis or treat-
ment in New Zealand, and no requirement for treatment
providers to have formal training or registration.
Aims
The study aims are encapsulated in the following
questions.
Policy question: in New Zealand, from which health-
care practitioners do patients seek treatment for insom-
nia, to whom are they referred, and wh at is the net cost
and provider-assessed outcome of this treatment?
Research question: What are the effects of successful
insomnia treatment on quality of life and health resource
utilisation?
* Correspondence:
1
School of Economics and Finance, Massey University, Wellington, New
Zealand
Full list of author information is available at the end of the article
Scott et al. Cost Effectiveness and Resource Allocation 2011, 9:10
/>© 2011 Scott et al; licensee BioMed Central Ltd. This is an Open Access article distributed under the terms of the Creative Commons
Attribution License (http://crea tivecommons.org/licenses/by/2.0), which permits unrestricted use, distribution, and reproduction in
any medium, provided the original work is properly cited.
Literature review
The following search engines were used to identify the
literature t hat investigated t he economic dimensions of
insomnia; MEDLINE, Cochrane Library, AHRQ (Agency
for Healthcare Research and Quality) Google Scholar
and relevant New Zealand and Australian sites. Key
words searched on included the following used alone
and in various combinations; insomnia, cost, economic,
analysis, Australia, New Zealand, UK, USA, America.
We reviewed and summarised the main findings of rele-
vant papers published from 1996 onwards. The literature
was then groupe d into four c ategories; those papers that
considered the prevalence of insomnia, the burden or cost
of illness, resource utilisations, and quality of life. There
was a wide variation in the data within each of these cate-
gories because the studies differed in their definition of
insomnia. The literature reviewed aided in the selection of
the b ase case values and ranges for the incremental
resource utilisations and outcomes.
From the international literature, insomnia prevalence
was estimated at 5-35% [5]. This wide range in prevalence
stems in most part from the many definitions of insomnia
used in previous research. Thirty percent of individuals
report symptoms of insomnia and 15-20% report insomnia
symptoms with daytime impairment, whereas 5-10% meet
criteria for a diagnosis of insomnia accordi ng to standar-
dised diagnostic criteria [1,2]. New Zealand prevalence
data align well with the international literature. Based on a
national survey of insomnia symptoms [6,7], 25% of New
Zealanders report having a sleep problem lasting longer
than six months. From these data, we have estimated that
13% of New Zealanders are affected by at least one symp-
tom of insomnia often/always, together with excessive day-
time sleepiness [8]. Considerable disparity in estimated
insomnia prevalence was observed between Māori (19.1%)
and non-Māori (8.9%).
The burden of illness cost estimates for insomnia ran-
ged from 0.2% to 0.5% of Gross Domestic Product
(GDP), with a mean and median of 0.3% [9-13]. The
Australian study [9] calculated that all sleep disorders
represented 1.3% of GDP.
There were greater numbers of more recent studies
that compared resource utilisations (direct and indirect)
of individuals with insomnia with those of good sleepers.
The differences in direct health costs b etween these two
groups ranged from 5% to 200% (mea n 57%, median
24%) [14-20]. Two high outliers [15,16] were eliminated
resulting in a plausible range of 5-25%, with a mean of
18% and median of 21%. Insomniacs’ absences from work
(indirect costs) were higher by 15% to 142% (mean 86%,
median 68%) compared with good sleepers [14,16,18,21].
The quality of life (QoL) studies in the international
literature varied in the terminology they used to
describe insomnia, some using descriptors that were not
in accord with accepted diagnostic criteria. However, as
most of the quality of life studies used the SF-36 on a
scale of 0 to 100 points, the reduction i n quality of life
for the “physical functioning” and “ mental health”
domains/dimensions, or QoL scores, for insomniacs
compared with good sleepers was able to be assessed
[22-24]. Approximately 20% of all motor vehicle acci-
dents are associated with driver sleepiness (independent
of alcohol) [25]. Those reporting disrupted sleep were
almost twice as likely (relative risk 1.89) to die in a
work related accident [26] and 69% more likely to have
a serious accident [27].
There were no reported studies of the proportion of
insomniacs treated in New Zealand but findings from the
United States suggest the majority of people (85%) who
suffer from insomnia do not seek treatment [28]. A United
Kingdom study [29] (sample size 85) investigated where
insomniacs sought treatment and found that the providers
most likely to have been consulted were; pharmacist
(16.5%), gene ral practitioner (41. 2%), psychiatrist (3.5%),
psychologist (7.1%), nurse (3.5%), counsellor (10.6%), herb-
alist (8.2%), acupuncturist (8.2%), and hypnotist (4.7%).
Methods
This economic evaluation was a combination of cost
effectiveness (CEA) and cost utility (CUA) analyses. The
study used micro costing techniques, and was retrospec-
tive and prevalence-based. A societal analytic perspective
was a dopted and all costs were measured incrementally
compared with the counterfactual (no intervention). As
a time horizon of one year was used, discounting of
costs and effects was not undertaken.
This study was informed by both the international litera-
ture and a series of key informant interviews [30] to can-
vas the range of treatment options offered in New Zealand
and to estimate the proportion of people with insomnia
who seek treatment. In order to ensure the interview data
were repr esentative of the range of insomnia diagnostic
and treatment options available in New Zealand, infor-
mants were categorised as specialist physician (appropri-
ately qualified physician working in specialty medical
practice other than general practice), general practitioner
(GP), psychologist, pharmacist, health practitioner (a
medically-trained GP or other qualified health practitioner
who has taken an interest, or undergone some training, in
sleep) and alternative health practitioner (a treatment pro-
vider with any level of training in alternative medicine,
practising insomnia treatment). An equal number of infor-
mants from each category were sought for interview.
Information was sought on the profile of patients (who
had they previously consulted, number of new/referred
patients, patient demographics), clinical practice (diagno-
sis, kn owledge, treatments), patient outcomes (consulta-
tions, referrals, treatment effectiveness), and fees charged.
Scott et al. Cost Effectiveness and Resource Allocation 2011, 9:10
/>Page 2 of 10
Treatment effectiveness was self-rated by the interviewees
and could not be independently verified.
The interviews were not sufficient to accurately
describe insomnia patient treatment pathways and there
is a paucity of data in the international literature. For
the purposes of the m odel, findings from Stinson et al.
[29] were used to estimate the percentage of patie nts
approachin g each provider type in the first instance. To
correspond with the study of Stinson et al. (2006),
patients approaching a nurse or counsellor were
grouped in the category ‘health practitioner’,and
patients approaching a herbalist, acupuncturist and hyp-
notist were grouped in the category ‘alternative health
practitioner’.
A decision tree was dev eloped to reflect treatment
options for insomnia and modified when the findings of
the key informant interviews were completed. The
deterministic model developed was used to estimate
base case values, and a stochastic version (with Monte
Carlo simulation) was used to perform multivar iate sen-
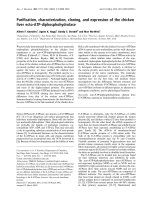
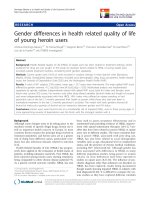
sitivity analysis. Key methodological steps are shown in
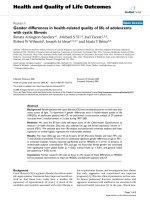
Figure 1. The decision tree represents a simplification of
reality in that not every possible branch that a patient
may follow has been included and the model w as lim-
ited to one level of on-referral. The inputs to the mo del
were prevalence, event probabilities, resource utilisations
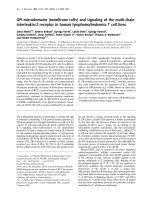
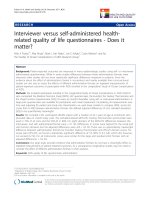
and unit costs. A schematic description of the
calculations performed by the decision tree model is
represented in Figure 2.
An individual with suspected insomnia may choose
between two pathways; that is, they do not seek treat-
ment or they seek treatment from a healthcare p racti-
tioner/provider. If they do not seek treatment, different
outcomes may occur resulting in increased use of health
resources, reduced productivity and reduced quality of
life. The person with insomnia may have any or all of
these outcomes in any combination. Based on the
national prevalence data [6-8] the population at risk
used for the model was 20-59 yea rs (2.317 milli on) [31]
and the prevalence of insomnia 13%. Eve nt probabilities,
costs and the referral pathways were determined from
the literature [29] and interviews. While the interna-
tional literature suggests that insomnia is associated
with a range of other medical conditions, the cost of co-
morbidities has not been included as the causal relation-
ships between insomnia and comorbid conditions are
not well understood.
Two of the insomnia practitioners who had partici-
pated in the interviews completed a EuroQol 5D (EQ-
5D) questionnaire relating to their insomnia p atients
both before treatment and after practitioner-rated suc-
cessful treatmen t. The EQ-5D was scored using the New
Zealand-specific tariff (utility weights, tariff 2) [32]. The
SF-36 scores for the two domai ns (“physical functioning”
and “mental health”) were converted from 0 - 100 to the
scale 0 - 1 a nd then averaged. Scores from the literature
taken from groups with the closest approximation t o a
standard clinical definition of insomnia (for example,
‘severe” or “level II” inso mnia) [19,22,23] and the EQ-5D
clinician scores w ere combined into one dataset (range
0.078 to 0.373, mean 0.157). The dataset provided the
base case (mean) and the high value, and 0 was assumed
for the low value.
Direct medical pro vider costs and the indirect medical
cost of transport to seek treatment were quantified but
indirect costs (loss of productivity including travel time)
and the non-health costs of accidents we re not eva lu-
ated. It was assumed that t he cost of any behavioural or
psychological therapy, if given by any of the healthcare
pract itioners, was included in the fee for the initial visit.
Unit resource cost estimates are described in table 1.
The interviews provided data on medicines prescribed
and this was supplemented with information from the
Pharmaceutical Management Agency of New Zealand
(PHARMAC)tocostthemostprescribed medicine for
insomnia, Zopiclone [33]. The interviews also supplied
information on non-prescription products ( over-the-
counter preparation s sold by Pharm acist s) and the unit
costs were taken from the website of Pharmacy Direct
[34]. Blackmores Valerian Forte 2000 mg was used for
the base case. Private motor vehicle costs incurred
D
ec
i
s
i
on tree mo
d
e
l
Ļ
Interviews
Ļ
Tree pathways modified
Ļ
Data inputs
Ļ
Base case – deterministic tree model
Ļ
Sensitivity analysis – stochastic model
Figure 1 Methodological steps.
Scott et al. Cost Effectiveness and Resource Allocation 2011, 9:10
/>Page 3 of 10
(travel for diagnosis and treatment) were calculated by
multiplying the average cost per kilom etre of $0.56 [35]
by the average distance travelled for a round trip
(29.83 km) to a GP or hospital clinic [36].
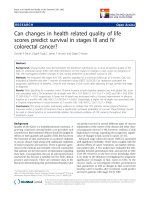
The event probabilities are summarised in Figure 3. At
each node choices are made, events take place and
resource utilisations are changed. If, for example, a person
who has insomnia consults their Pharmacist they may pur-
chase an over-the-counter (OTC) medication and incur
transport costs. (See table 2) The average increase in
health resource utilisations for those with insomnia versus
non-insomniacs were derived from the literature (table 3).
Figure 2 Decision tree descriptions of calc ulations. (1) Decision tree cost = the sum of all pathway costs (2) Cost of an event = the sum of
(the unit costs of all resources utilised by the event multiplied by the volume of resources utilised) (3) Probability of a pathway = (pE
1
×pE
2
xpE
I
xpE
n
) where E
I
= event
I
, and n = the total number of events in the pathway (4) Cost of a pathway = the sum of the cost of all events in
pathway (5) A decision tree enables a method of modelling, in chronological order, all possible events (6) Resources = consultations, medicines,
and transport, E = event, p = probability (7) ● = Chance node which has a branch for each possible outcome or event. Each event ha s an
associated probability and value. (8) ◀= End node which does not have any succeeding braches. Each end node returns a probability and a
value for the associated pathway. Upper value = probability of reaching the end point of the pathway. Lower value = cost incurred in reaching
the end point of the pathway.
Table 1 Unit resource cost estimates in 2009 NZ dollars
Resource Base case $ Year of data Notes
Direct medical
General Practitioner 48.89 2009 (1)
Specialist Physician initial 222.22 2009 (1)
Specialist Physician follow up 99.56 2009 (1)
Psychologist 88.89 2009 (1)
Health Practitioner 120.00 2009 (1)
Alternative Health Practitioner 75.56 2008 (2)
Prescription medicine 6.42 2009 (3)
Non prescription medicine 16.00 2009 (4)
Increase in cost per capita for those with insomnia versus non-insomniacs 627.52 2008 (5)
Direct non-medical
Transport for treatment (round trip) 16.71 2009 (6)
Notes:
(1) Registered health care providers [40]. General Practitioner, medical practitioner band 1. Specialist Physician, medical practitioner band 2; high case
(interviews). The medical fees do not include any government patient subsidy as this varies between providers and patients.
(2) Alternative Health Practitioner from Interviews.
(3) Prescription medicine, Zopiclone, base case 7.5 mg @ 30 days plus dispensing fee, low case = base case × 0.5 plus dispensing fee, high case = two
prescriptions plus 2 dispensing fees (Interviews) and dispensing fee [39], prices [33].
(4) Non prescription medicine (Interviews) and [34], low case = base case less 25%, high case = base case × 2.
(5) See Table 3.
(6) Transport for treatment: Cost per km × km travelled for round trip = $0.63/9 × 8 × 29.83 km = $16.71. [Cost per km $0.63/9 × 8: 1500-2000 cc petrol: [35].
Time to hospital (17.9 minutes): [36]. Distance for round trip (km): 17.9 minutes @ 50 km/hour × 2 = 29.83 km.]
Ranges: if not specifically stated ranges = base case plus or minus 25%.
All costs have had GST of 12.5% deducted and calculations are based on unrounded data.
Scott et al. Cost Effectiveness and Resource Allocation 2011, 9:10
/>Page 4 of 10
Sensitivity analysis (rather than statistical methods) was
used to investigate uncertainty in the model inputs (unit
costs, resource ut ilisations, QALYs, and prevalence). A
stochastic version of the insomnia costing model, using
Monte Carlo sampling from triangular distributions, was
used for multivaria te sensitivity analysis [37]. Triangular
distributions were used because there was insufficient
information from which to define specific distributions
(for example, normal or Pareto distributions). Unless
otherwise stated, all estimates subject to uncertainty were
0.050 0.008
$72.02 $104.72
0.165 1 Pharmacist
$32.71 $36.31
0.950 0.157
$0.00 $32.71
0.350 0.144
$0.00 $65.60
0.412 2 GP
$65.60 $98.26
0.875 0.234
$0.00 $72.02
0.650 Treat
$6.42 $115.85
0.400 0.013
$422.38 $494.40
0.125 Refer
$0.00 $422.66
0.200 0.007
$361.61 $433.63
0.400 0.013
$273.41 $345.43
Mean cost per patient treated (weighted over all treatment modalities in the decision outcome tree)
$145.16
0.050 0.007
$0.00 $136.71
0.141 (3) HP
$136.71 $212.91
0.775 0.104
$0.00 $139.92
0.950 Treat
$3.21 $216.92
0.333 0.010
$422.38 $562.30
0.225 Refer
$0.00 $482.14
0.333 0.010
$361.61 $501.53
0.167 0.005
$72.02 $211.93
0.167 0.005
$413.33 $553.2
5
0.025 0.002
$0.00 $105.60
0 071
4 Psychologist
1.2 Success
1.1 Refer GP
2.2 Treat
2.2.1 Success
2.1 No further action
3.2 Treat
3.2.1 Success
3.1 No further action
4.1 No further action
1 Pharmacist
2 GP
3 HP
4 Psychologist
Insomnia treatment
2.2.2.1 Psychologist
2.2.2.2 Specialist Physician
2.2.2.3 Health Practitioner
2.2.2 Refer
3.2.2.1 Psychologist
3.2.2 2 .Specialist Physician
3.2.2.3 GP
3.2.2.4 Health Practitioner
3.2.2 Refer
0
.
071
4 P
syc
h
o
l
og
i
s
t
$105.60 $134.27
0.838 0.058
$0.00 $105.60
0.975 Treat
$0.00 $135.01
0.133 0.001
$422.38 $527.98
0.162 Refer
$0.00 $287.15
0.267 0.003
$361.61 $467.21
0.400 0.004
$72.02 $177.61
0.200 0.002
$0.00 $105.60
0.000 0.000
$0.00 $92.26
0.211 5 Alt HP
$92.26 $280.26
0.963 0.203
$0.00 $276.79
1.000 Treat
$184.52 $280.26
0.375 0.003
$184.52 $461.31
0.037 Refer
$0.00 $370.58
0.375 0.003
$65.60 $342.38
0.250 0.002
$0.00 $276.79
1.2 Success
1.1 Refer GP
2.2 Treat
2.2.1 Success
2.1 No further action
3.2 Treat
3.2.1 Success
3.1 No further action
4.1 No further action
5.1 No further action
5.2.1 Success
5.2 Treat
5.2.2.1 Other Alt HP
5.2.2.2 GP
5.2.2.3 No further action
5.3.2 Refer/ no further action
4.2.2.1 Other Psychologist
4.2.2.2 Specialist Physician
4.2.2.3 GP
4.2.2.4 No further action
1 Pharmacist
2 GP
3 HP
4 Psychologist
5 Alt HP
Insomnia treatment
4.2.1 Success
4.2.2 Refer/ no further action
4.2 Treat
2.2.2.1 Psychologist
2.2.2.2 Specialist Physician
2.2.2.3 Health Practitioner
2.2.2 Refer
3.2.2.1 Psychologist
3.2.2 2 .Specialist Physician
3.2.2.3 GP
3.2.2.4 Health Practitioner
3.2.2 Refer
Figure 3 Insomnia treatment model.
Scott et al. Cost Effectiveness and Resource Allocation 2011, 9:10
/>Page 5 of 10
varied 25% up and down from the base case to provide
high and low limits. Ten thousand iterations of
the model were run. The Monte Carlo simulations used
Palisade’s Decision Tools Suite software.
All unit costs were valued in 2009 NZ dollars (or the lat-
est available data) and were exclusive of GST (goods and
services tax, a transfer payment from one sector of society
to another). New Zealand dolla r conversions; mid rates
end Dec 2009 NZD1 = AUD0.7929, €0.4901, USD0.7162
[38].
Results
The interviews revealed little a wareness of international
best practice standards for insomnia treatment. Alternative
Table 2 Resource utilisations by event
Events (a) (b) (c) (d) (e) (f) (g) (h) (i)
Do not seek treatment
Seek treatment
1 Pharmacist 1.0 1.0
1.1 Refer General Practitioner 1.0 1.0 1.0
1.2 Success
2 General Practitioner 1.0 1.0
2.1 No further action
2.2 Treat 1.0
2.2.1 Success
2.2.2 Refer
2.2.2.1 Psychologist 4.0 4.0
2.2.2.2 Specialist Physician 1.0 1.0 1.0 2.0
2.2.2.3 Health Practitioner 2.0 2.0
3 Health Practitioner 1.0 1.0
3.1 No further action
3.2 Treat 0.5
3.2.1 Success
3.2.2 Refer
3.2.2.1 Psychologist 4.0 4.0
3.2.2.2 Specialist Physician 1.0 1.0 1.0 2.0
3.2.2.3 General Practitioner 1.0 1.0 1.0
3.2.2.4 Other Health Practitioner 3.0 0.5 3.0
4 Psychologist 1.0 1.0
4.1 No further action
4.2 Treat
4.2.1 Success
4.2.2 Refer/no further action
4.2.2.1 Other Psychologist 4.0 4.0
4.2.2.2 Specialist Physician 1.0 1.0 1.0 2.0
4.2.2.3 General Practitioner 1.0 1.0 1.0
4.2.2.4 No further action
5 Alternative Health Practitioner 1.0 1.0
5.1 No further action
5.2 Treat 2.0 2.0
5.2.2 Success
5.2.3 Refer/no further action
5.2.3.1 Other Alternative Health Practitioner 2.0 2.0
5.2.3.2 General Practitioner 1.0 1.0
5.2.3.3 No further action
Notes:
Events: (a) General Practitioner consultation, (b) Specialist Physician Initial consultation, (c) Specialist Physician follow-up consultation, (d ) Psychologist
consultation, (e) Health Practitioner consultation, (f) Alternative Health Practitioner consultation, (g) Prescription medicine, (h) Non prescription medicine, (i)
Transport for treatment (round trip)
Base case values were derived from the current study. Monte Carlo simulation runs used base case, and ranges base case plus or minus 25%.
Scott et al. Cost Effectiveness and Resource Allocation 2011, 9:10
/>Page 6 of 10
health practitioners, pharmacists and GPs (when com-
pared with specialist physicians, health practitioners) and
had poorer knowledge of the types of insomnia and sleep
terminology, were less likely to use any structured diag-
nostic tools and offered the most limited range of treat-
ment options. The effectiveness of treatment provided was
formally assessed by 57%. The interviewees suggested that
patients had frequently consulted multiple practitioners. It
was considered that there was an unmet need for insom-
nia treatment and a lack of accurate information on treat-
ment options and providers.
The decision tree (Figure 3) is the final version devel-
oped and used for modelling treatment pathways and
costs. The pathways and events depicted are the domi-
nant and most relevant for which local data existed.
Treatment cost over all treatments (the tree cost) aver-
aged $145 per patient. The mean treatment cost for each
branch or mode of treatment designated by the health
practitioner first consulted was as follows; pharmacist
$36, GP $98, psychologist $134, health practitioner $213,
and alternative health practitioner $280. The total direct
costs for each treatmen t outcome or pathway that ended
in a terminatio n node ran from a low of $33 ( cost of an
OTC product and travel, pharmacist pathway) to a high
of $562 (psychologist accessed through a health practi-
tioner pathway). The direct costs of treatment by a spe-
cialist physician depended upon the referral pathway
taken and ra nged from $434 (accessed through a GP) to
$502 (when accessed through a health practitioner).
The total net benefit of treating a person with insom-
nia was $482 (the total base case cost of $145 less costs
avoided of $628). Wh en these results were applied to
the total at-risk population in New Zealand treatment
costs incurred were $6.6 million, costs avoided $28.4
million and net benefits were $21.8 million. The incre-
mental net direct benefit per QALY gained when insom-
nia was successfully treated was $3,072 (table 4). When
multivariate sensitivity analysis was undertaken on the
Table 3 Health care cost of those with insomnia versus non-insomniacs
Item Base Case Year of data Notes
Per capita health care resource cost ($) of all ages New Zealand population (TP$) 3,568 2008 (1)
Personal medical services ($M) 15,313 2008 (2)
Population all ages (M) 4.292 2008 (3)
Proportion of New Zealand population suffering from insomnia (Ip) 0.13 (4)
% Increase in cost per capita of those with insomnia versus non-insomniacs 18.0% (5)
Ratio of health resource cost of those with insomnia to non-insomniacs (R) 1.18 (5)
Mean health care resource cost ($) of non-insomniacs (Y) 3,486 (6)
Mean health care resource cost ($) of those with insomnia (X) 4,114 (6)
Increase in cost per capita those with insomnia versus non-insomniacs 628 (6)
Notes:
Data sources
(1) = (2) ÷ (3)
(2) Personal medical services: excludes expenditure on prevention and public health, administration and insurance premiums [41].
(3) Population: Total resident population[31]
(4) [8]
(5) [14,17-20]
(6) Derivation of “Y” and “X” from “Ip”“R” and TP$
Unknown
X = Mean health care resource cost ($) of those with insomnia
Y = Mean health care resource cost ($) of non-insomniacs
Known (Statements S1, S2, S3)
(S1): Ip = Proportion of New Zealand population suffering from insomnia, [base case 0.13]
(S2): R = Ratio of health resource cost of those with insomnia to others, [base case 1.18]
(S3): TP$ = Mean health care resource cost of total all ages New Zealand population, [base case $3,568]
Solution
(S1) and (S3) may be used to derive equation (E1): TP$ = Ip × X + [(1 - Ip) × Y] (S2) may be written as equation (E2): × = R × Y
Substitute (E2) into (E1)
TP$ = [Ip × R × Y] + [(1 - Ip) × Y]
TP$ = Y × [(Ip × R) +1 - Ip)]
Solve for Y
Y = TP$/[(Ip × R) + 1 - Ip]
Using base case values as an example
Y = $3,568/[(0.13 × 1.18)+1-0.13] = $3,486
X = ($3,486 × 1.18) = $4,114
All calculations are based on unrounded data.
Scott et al. Cost Effectiveness and Resource Allocation 2011, 9:10
/>Page 7 of 10
netbenefitsoftreatment,itwasfoundthatfor90%of
the Monte Carlo 10,000 simulations the net benefit of
treatment per person fell between $41 and $679, and for
New Zealand as a whole between $2 million to $33 mil-
lion. The net ben efit per QALY gained ranged between
$240 and $8,102.
Discussion
We now have a greater understanding of the treatment
of insomnia in New Zealand in t erms of the types of
diagnostic and treatment options being used. Both the
information on the impact on health resource utilisation
and improved quality of life (if insomnia is successfully
treated) should assist in identifying cost-effective treat-
ments and policies. The model developed may be used
to investigate population subgroups and evaluate differ-
ent treatment options.
The cost of each treatment path varied, depending not
only on the fees charged and the number of consultations
per course of treatment but also upon the number of
encounters with different healthc are practitioners/treat-
ment providers (referrals). The study assumed a successful
treatment outcome (no further additional impact on
health resource utilisations) at each termination node. As
individuals with insomnia are more likely to consult their
Pharmacist or GP in the first instance, it is important that
bot h these practitioners have clear guidelines and proto-
cols to identify potential insomnia and where appropriate,
on-refer a patient to a trained treatment provider.
There are no publicly funded treatment options for
insomnia in New Zealand. Market failure caused by
insufficient patient information is indicated in that the
interviews found that it was not uncommon for patients
with insomnia to have independently consulted several
practitioners. It was considered that those with insomnia
lacked sufficient accurate and unbiased information from
which they were able to make an informed decision.
Sensitivity analys is demonstrated that the results were
robust with respect to changes in key assumptions and
determinants of cost and effects (over 90% of all itera-
tions wer e both more effective and less costly). By way
of comparison, the cumulati ve average cost-effectiveness
threshold of PHARMAC funding decisions for new
medicines made b etween 1999 and 2 005 was $6,865
[39].
The study is the first in New Zealand to attempt to
ascertain the treatment pathways that a person with
insomnia may follow. It also sought to underst and the
treatment provided (based on interviews of healthcare
practitione rs) and to q uantify the costs of insomnia and
its impact on quality of life.
Limitations
Individuals with insomnia access health care services more
often than others, and insomnia is associated with a range
of other medical conditions. However, the causal relation-
ship between insomnia and these comorbid conditions is
not well understood. Thus, the costing model in this study
did not specifically account for conditions that may be
caused by insomnia but ins tead evaluated the impact on
total health resource utilisation, using information from
international studies. Costs of non-prescription medicines
from health food stores and supermarkets or from web-
based vendors were not considered.
Individuals with insomnia may be at increased risk for
decreased performance and accident or injury. This is best
described in relation to motor vehicle accidents; those
with ins omnia have a higher motor vehicle accident rate
than controls [27]. However, the relative risk of decreased
performance in those with insomnia is not well under-
stood. This study has taken a conservative approach. For
example, a person with insomnia has increased non-health
costs of having an accident, injuring others and/or dama-
ging property but this was not considered. In addition, the
analyses did not quantify exte rnalities that impact on
others in the community such as the effect on productivity
and quality of life of having an insomniac within a family
setting. Thus, we did not calculate the burden of illness as
a percentage of GDP.
As healthcare practitioners were interviewed (and not
patients), it is their judgements on pathways, and patient
outcomes that have been used to define the model.
Thus, the true success of treatment by these providers
remains unknown. Costs incurred by th ose 60 years and
older were not included as the at risk populatio n was
limited by t he available insomnia prevalence estimates
for New Zealanders aged 20-59 years.
Table 4 Economic evaluation of insomnia treatment
versus no treatment
Per person
treated
NZ total
million
At risk population (1) 2.317
Prevalence of insomnia (2) 13%
Proportion seeking treatment (2) 15.0%
Number seeking treatment (M) (3) 0.045
Costs incurred ($) 145 6.6
Costs avoided ($) 628 28.4
Net benefit ($) 482 21.8
QALYs gained (#) 0.157 0.007
Net benefit per QALY gained
($)
3,072 21.8
Notes:
(1) December 2008 [31]
(2) [8]
Ranges (1) and (2) The high values are the base case plus 25% and the low
values the base case minus 25%.
(3) = (1) × (2) × (3)
Calculations are based on unrounded data.
Scott et al. Cost Effectiveness and Resource Allocation 2011, 9:10
/>Page 8 of 10
Recommendations
A larger nationwide survey of those offering insomnia
treatments would provide a greater understanding of diag-
nostic, treatment and referral practices in New Zea land,
and would give a more comprehensive sample on which
to base QALY estimates. A large survey of individuals in
New Zealand who identify as having insomnia would pro-
vide a means to more accurately identify the difference in
healthcare resource utilisations and productivity between
those people with untreated insomnia, treated insomnia
and those without insomnia and to determine patients’
evaluation of the effectiveness of the various treatments
and treatment pathways followed. The existing model,
augmented by additional national survey data, could be
modified and used to evaluate the cost of alternative fund-
ing policies and treatment options.
Conclusions
The interviews highlighted the unsystematic approach to
insomnia treatment in New Zealand. It is concerning
that there is insufficient publicly available information
from which a consumer is able to make an informed
decision on treatment provider options and provider
competence. A standardised approach to insomnia treat-
ment requires a multi-disciplinary t eam of treatment
providers who have sufficient knowledge to diagnose
insomnia, imple ment treatment and measure treatment
efficacy. This would reduce the direct and indirect costs
of insomnia and improve quality of life.
A number of study limitations resulted in a conserva-
tive estimate of the costs of insomnia tre atment in New
Zealand. Despite this conservative approach, this study
confirms that successfu l treatment of insomnia is highly
cost effective.
Acknowledgements
We would like to thank the New Zealand Lottery Grants Board for the
funding that made this research possible. We would also like to thank the
interview participants who kindly volunteered their time and expertise.
Researchers from the Sleep/Wake Research Centre and School of Economics
and Finance, Massey University, and ScottEconomics Limited collaborated on
this project.
Author details
1
School of Economics and Finance, Massey University, Wellington, New
Zealand.
2
ScottEconomics, Wellington, New Zealand.
3
Sleep/Wake Research
Centre, Massey University, Wellington, New Zealand.
Authors’ contributions
All authors contributed equally to the study and all have read and approved
the final manuscript.
Competing interests
The authors declare that they have no competing interests.
Received: 3 February 2010 Accepted: 21 June 2011
Published: 21 June 2011
References
1. American Academy of Sleep Medicine: The international classification of
sleep disorders: Diagnostic and coding manual (ICSD-2). 2 edition.
Westchester, IL: American Academy of Sleep Medicine; 2005.
2. American Psychiatric Association: Diagnostic and statistical manual of mental
disorders (DSM-IV-TR). 4 edition. Washington, DC: American Psychiatric
Association; 2000.
3. Morin CM, LeBlanc M, Daley M, Gregoire JP, Merette C: Epidemiology of
insomnia: Prevalence, self-help treatments, consultations, and
determinants of help-seeking behaviors. Sleep Medicine 2006, 7:123-130.
4. Kyle SD, Morgan K, Espie CA: Insomnia and health-related quality of life.
Sleep Medicine Reviews 2010, 14:69-82.
5. Ohayon MM: Epidemiology of insomnia: What we know and what we
still need to learn. Sleep Med Rev 2002, 6:97-111.
6. Paine SJ, Gander PH, Harris R: Who reports insomnia? Relationships with
age, sex, ethnicity, and socioeconomic deprivation. Sleep 2004,
27:1163-1169.
7. Paine SJ, Gander PH, Harris RB: Prevalence and consequences of insomnia
in New Zealand: disparities between Maori and non-Maori. Aust N Z J
Public Health 2005, 29:22-28.
8. Sleep/Wake Research Centre Massey University: Data on file Wellington:
Massey University; 2011.
9. Hillman DR, Murphy AS, Pezzullo L: The economic cost of sleep disorders.
Sleep 2006, 29:299-305.
10. Leger D, Levy E, Paillard M: The direct costs of insomnia in France. Sleep
1999, S394-s401.
11. OECD: OECD Factbook 2008: Economic, Environmental and Social Statistics
Organisation for Economic Co-operation and Development; 2008.
12. Walsh JK, Engelhardt CL: The direct economic costs of insomnia in the
United States for 1995. Sleep 1999, 22(Suppl 2):S386-393.
13. Chilcott LA, Shapiro CM: The socioeconomic impact of insomnia. An
overview. PharmacoEconomics 1996, 10(Suppl 1):1-14.
14. Ozminkowski RJ, Wang S, Walsh JK: The direct and indirect costs of
untreated insomnia in adults in the United States (Provisional record).
Sleep 2007, 263-273.
15. Susman E: APSS: extra health cost of insomnia reaches $3,2000 ann
employee. MedPage Today 2007.
16. Novak M, Mucsi I, Shapiro CM, Rethelyi J, Kopp MS: Increased utilization of
health services by insomniacs–an epidemiological perspective. J
Psychosom Res 2004, 56:527-536.
17. Kapur VK, Redline S, Nieto FJ, Young TB, Newman AB, Henderson JA: The
relationship between chronically disrupted sleep and healthcare use.
Sleep 2002, 25:289-296.
18. Leger D, Guilleminault C, Bader G, Levy E, Paillard M: Medical and socio-
professional impact of insomnia. Sleep 2002, 25:625-629.
19. Hatoum HT, Kania CM, Kong SX, Wong JM, Mendelson WB: Prevalence of
insomnia: a survey of the enrollees at five managed care organizations.
The American journal of managed care 1998, 4:79-86.
20. Simon GE, VonKorff M: Prevalence, burden, and treatment of
insomnia in primary care. The American journal of psychiatry 1997,
154:1417-1423.
21. Godet-Cayre V, Pelletier-Fleury N, Le Vaillant M, Dinet J, Massuel M-A,
Leger D: Insomnia and absenteeism at work. Who pays the cost? Sleep
2006, 29:179-184.
22. Katz DA, McHorney CA: The relationship between insomnia and health-
related quality of life in patients with chronic illness. J Fam Pract 2002,
51:229-235.
23. Leger D, Scheuermaier K, Philip P, Paillard M, Guilleminault C: SF-36:
evaluation of quality of life in severe and mild insomniacs compared
with good sleepers. Psychosomatic Medicine 2001, 63:49-55.
24. Hatoum HT, Kong SX, Kania CM, Wong JM, Mendelson WB: Insomnia,
health-related quality of life and healthcare resource consumption. A
study of managed-care organisation enrollees. PharmacoEconomics 1998,
14:629-637.
25. Institute of Medicine of the National Academies Committee on Sleep
Medicine and Research Board on Health Sciences Policy: Functional and
economic impact of sleep loss and sleep-related disorders. In Sleep
disorders and sleep deprivation: an unmet public health problem. Edited by:
Colten HR, Altevogt BM. Washington, DC: National Academies Press; 2006:.
Scott et al. Cost Effectiveness and Resource Allocation 2011, 9:10
/>Page 9 of 10
26. Akerstedt T, Fredlund P, Gillberg M, Jansson B: A prospective study of fatal
occupational accidents – relationship to sleeping difficulties and
occupational factors. J Sleep Res 2002, 11:69-71.
27. Leger D, Massuel MA, Metlaine A: Professional correlates of insomnia.
Sleep 2006, 29:171-178.
28. National Sleep Foundation: 2008 Sleep in America Poll Washington, DC:
National Sleep Foundation; 2008.
29. Stinson K, Tang NK, Harvey AG: Barriers to treatment seeking in primary
insomnia in the United Kingdom: A cross-sectional perspective. Sleep
2006, 29:1643-1646.
30. O’Keeffe KM, Gander PH, Scott WG, Scott HM: Insomnia treatment in New
Zealand. New Zealand Medical Journal 2011.
31. National population estimates: December 2008 quarter. [ts.
govt.nz/browse_for_stats/population/estimates_and_projections/
nationalpopulationestimates_hotpdec08qtr.aspx].
32. Devlin NJ, Hanson P, Kind P: The health state preferences and logical
inconsistencies of New Zealanders: A tail of two tariffs. University of York
Centre for Health Economics Discussion paper 2000.
33. Pharmaceutical Management Agency of New Zealand: Zopiclone. New
Zealand Pharmaceutical Schedule 2009, 16:128.
34. Blackmores Valerian Forte 2000 mg tabs 30 s. [http://www.
pharmacydirect.co.nz/search.php?mode=search&page = 1].
35. Fuel & car running costs, petrol compact 1500 cc-2000 cc. [http://www.
aa.co.nz/SiteCollectionDocuments/pdf/car_running_costs/petrol_08.pdf].
36. Brabyn L, Skelly C: Modeling population access to New Zealand public
hospitals. Int J Health Geogr 2002, 1:3.
37. Palisade Corporation: @ Risk version 4.5 Risk analysis and simulation add-in
for Microsoft Excel Newfield NY; 2004.
38. Exchange rates (mid-point rates). [ />exandint/b1/data.html].
39. Pharmaceutical Management Agency of New Zealand: Prescription for
pharmacoeconomic analysis: methods for cost-utility analysis. Final version 2
edition. Wellington: Pharmaceutical Management Agency of New Zealand;
2007.
40. Ultra Care Plan. [ />v14120_3.pdf].
41. New Zealand Ministry of Health: Health expenditure trends in New Zealand
1998-2008 Wellington: NZ Ministry of Health; 2010.
doi:10.1186/1478-7547-9-10
Cite this article as: Scott et al.: Insomnia - treatment pathways, costs
and quality of life. Cost Effectiveness and Resource Allocation 2011 9:10.
Submit your next manuscript to BioMed Central
and take full advantage of:
• Convenient online submission
• Thorough peer review
• No space constraints or color figure charges
• Immediate publication on acceptance
• Inclusion in PubMed, CAS, Scopus and Google Scholar
• Research which is freely available for redistribution
Submit your manuscript at
www.biomedcentral.com/submit
Scott et al. Cost Effectiveness and Resource Allocation 2011, 9:10
/>Page 10 of 10