Báo cáo y học: "Entropy and bispectral index for assessment of sedation, analgesia and the effects of unpleasant stimuli in critically ill patients: an observational study" potx
Bạn đang xem bản rút gọn của tài liệu. Xem và tải ngay bản đầy đủ của tài liệu tại đây (680.66 KB, 12 trang )
Open Access
Available online />Page 1 of 12
(page number not for citation purposes)
Vol 12 No 5
Research
Entropy and bispectral index for assessment of sedation,
analgesia and the effects of unpleasant stimuli in critically ill
patients: an observational study
Matthias Haenggi
1
, Heidi Ypparila-Wolters
2
, Christine Bieri
1
, Carola Steiner
1
, Jukka Takala
1
,
Ilkka Korhonen
2
and Stephan M Jakob
1
1
Department of Intensive Care Medicine, Bern University Hospital and University of Bern, Freiburgstrasse, CH-3010 Bern, Switzerland
2
VTT Technical Research Centre of Finland, Tekniikankatu, Tampere, FI-02044 VTT, Finland
Corresponding author: Stephan M Jakob,
Received: 18 Apr 2008 Revisions requested: 18 Jun 2008 Revisions received: 26 Aug 2008 Accepted: 16 Sep 2008 Published: 16 Sep 2008
Critical Care 2008, 12:R119 (doi:10.1186/cc7015)
This article is online at: />© 2008 Haenggi et al.; licensee BioMed Central Ltd.
This is an open access article distributed under the terms of the Creative Commons Attribution License ( />),
which permits unrestricted use, distribution, and reproduction in any medium, provided the original work is properly cited.
Abstract
Introduction Sedative and analgesic drugs are frequently used
in critically ill patients. Their overuse may prolong mechanical
ventilation and length of stay in the intensive care unit.
Guidelines recommend use of sedation protocols that include
sedation scores and trials of sedation cessation to minimize
drug use. We evaluated processed electroencephalography
(response and state entropy and bispectral index) as an adjunct
to monitoring effects of commonly used sedative and analgesic
drugs and intratracheal suctioning.
Methods Electrodes for monitoring bispectral index and entropy
were placed on the foreheads of 44 critically ill patients requiring
mechanical ventilation and who previously had no brain
dysfunction. Sedation was targeted individually using the
Ramsay Sedation Scale, recorded every 2 hours or more
frequently. Use of and indications for sedative and analgesic
drugs and intratracheal suctioning were recorded manually and
using a camera. At the end of the study, processed
electroencephalographical and haemodynamic variables
collected before and after each drug application and tracheal
suctioning were analyzed. Ramsay score was used for
comparison with processed electroencephalography when
assessed within 15 minutes of an intervention.
Results The indications for boli of sedative drugs exhibited
statistically significant, albeit clinically irrelevant, differences in
terms of their association with processed
electroencephalographical parameters. Electroencepha-
lographical variables decreased significantly after bolus, but a
specific pattern in electroencephalographical variables before
drug administration was not identified. The same was true for
opiate administration. At both 30 minutes and 2 minutes before
intratracheal suctioning, there was no difference in
electroencephalographical or clinical signs in patients who had
or had not received drugs 10 minutes before suctioning. Among
patients who received drugs, electroencephalographical
parameters returned to baseline more rapidly. In those cases in
which Ramsay score was assessed before the event, processed
electroencephalography exhibited high variation.
Conclusions Unpleasant or painful stimuli and sedative and
analgesic drugs are associated with significant changes in
processed electroencephalographical parameters. However,
clinical indications for drug administration were not reflected by
these electroencephalographical parameters, and barely by
sedation level before drug administration or tracheal suction.
This precludes incorporation of entropy and bispectral index as
target variables for sedation and analgesia protocols in critically
ill patients.
Introduction
Pain, physical discomfort and anxiety are common in critically
ill patients. The underlying disease, care procedures, pro-
longed immobility and sleep deprivation all contribute to this
[1,2]. Both the stress response and its treatment may have a
negative impact on outcome [3-9]. Strategies aiming to
reduce the amount of sedatives and analgesics administered
may improve outcome and reduce the need for mechanical
EEG: electroencephalogram; ICU: intensive care unit; RE: response entropy; ROC: receiver operating characteristic; RSS: Ramsay Sedation Scale;
Critical Care Vol 12 No 5 Haenggi et al.
Page 2 of 12
(page number not for citation purposes)
ventilation [8,10,11]. Accordingly, a reliable, objective assess-
ment of sedation and analgesia during the course of critical ill-
ness would be very valuable.
Ideally, sedation in the intensive care unit (ICU) should result
in a calm patient who can easily be aroused and has a main-
tained sleep-wake cycle. Reaching this ideal target is difficult
[12], and some patients require deeper levels of sedation, for
instance to facilitate circulatory and respiratory support [12].
In addition, patients' requirements for sedative and analgesic
drugs vary substantially during the disease process and during
therapeutic and supportive interventions.
The clinical assessment of sedation relies on the patient's
response to external stimuli. However, the stimulus itself alters
the patient's level of sedation. Monitoring electroencephalo-
gram (EEG)-based variables can allow continuous assess-
ment of the level of sedation, and thereby predict the patient's
responsiveness. Methods and devices based on processed
EEG signals are widely used to monitor the depth of anaesthe-
sia. They have also been advocated for monitoring sedation in
intensive care, although the results are controversial. Early
observational studies found a good correlation between the
Sedation Agitation Scale and bispectral index (BIS) or entropy
values [13,14], but other reports could not confirm better per-
formance when compared with standard subjective assess-
ment scores [15-19]. A major drawback of these studies was
the fact that the assessment of the sedation score and com-
parison with the EEG was done in patients who were clinically
stable and did not have adjustments to sedation before the
assessment. This reflects the difficulties of incorporating proc-
essed EEG variables into sedation protocols, because in eve-
ryday practice patients need sedation adjustment. The need
for these adjustments is usually evaluated by the care teams,
with the bedside nurse having a leading role in this assess-
ment because they are with the patient most of the time. The
so-called 'gold standard' of sedation can thus be considered
to be protocol guided, with goals established by the physician
and adjustments made by the bedside nurse.
In clinical routine, many other parameters are used (together
with or without a sedation score) to decide whether analgesic
or sedative drugs should be administered (including haemody-
namic parameters, previous reactions to similar interventions,
and sympathetic and parasympathetic reactions). In our expe-
rience, these variables do not necessarily correlate with Ram-
say Sedation Scale (RSS) score. Reducing the whole
sedation process to a single number is not promising; we
therefore aimed to describe the indications for drug adminis-
tration, and monitored patterns in clinical signs and EEG, in
order to evaluate whether these patterns can predict the
responses in EEG variables. We believe that it is useful to
characterize how different interventions and their combina-
tions affect EEG variables in the real-world ICU environment.
Studies such as ours can determine the potential of these var-
iables for monitoring various aspects of sedation and analge-
sia in the context of unpleasant stimuli.
The aim of this observational study was to evaluate different
processed EEG parameters as predictors of response to sed-
ative and opiate drugs and intratracheal suctioning, alone or in
combination with drugs, during nurse-driven, protocol-guided
sedation and analgesia. The interventions were administration
of a sedative drug or opiate, clinically indicated endotracheal
suctioning, and a combination of both. Specifically, we evalu-
ated whether BIS and state entropy monitoring allow detec-
tion of clinically relevant distinctions between light and deep
grades of sedation, and help to predict the response to
unpleasant care interventions. We hypothesized that there are
thresholds beyond which drugs and intratracheal suctioning
do not result in significant changes in the respective proc-
essed EEG parameters, and that the thresholds for reactions
to intratracheal suctioning are modified by prior drug applica-
tion.
Materials and methods
The study was approved by the ethics committee of the Can-
ton of Bern, and written informed consent was obtained from
the next of kin and, if possible, from the patient after recovery.
Inclusion criteria were mechanical ventilation for 48 hours or
less and expected need for further ventilation for at least 24
hours. Exclusion criteria were need for muscle relaxation, trau-
matic brain injury, deep coma due to intoxication or neurologi-
cal injuries, severe neuropathies or myopathies, and surgery
using cardiopulmonary bypass without confirmation of normal
neurology before inclusion.
Routine haemodynamic monitoring and treatment were per-
formed according to the decision of the treating physician and
standard protocols. In addition, a Datex-Ohmeda S/5 Monitor
(Datex-Ohmeda, GE, Helsinki, Finland) was used for measure-
ment and storage (via WinCollect
®
software [Datex-Ohmeda,
GE Healthcare, Helsinki, Finland]) of the following parameters:
heart rate, arterial blood pressure (systolic, diastolic and
mean), pulse oximetry, end-tidal carbon dioxide tension, and
respiratory pressures and volumes. BIS-Index, a processed
EEG [20], was recorded via the BIS-Module of the S/5 moni-
tor (XP-Level, smoothing time 15 seconds, using Quattro
®
Sensor [Datex-Ohmeda, GE Healthcare, Helsinki, Finland]).
Entropy is an EEG-derived parameter that uses nonlinear sta-
tistics to describe the order of random repetitive signals. The
Entropy
®
Module (Datex-Ohmeda, GE) calculates two indices:
the state entropy (SE) and the response entropy (RE). The RE
includes additional information about the electromyographic
activity (activity higher than 32 Hz) of the face muscles [21].
The SE (range 90 to 0) and the RE (range 100 to 0) are nor-
malized in such a way that the RE becomes equal to the SE
when there is no electromyographic activity [22]. Both EEG
sensors were attached on the patient's forehead in accord-
ance with the manufacturer's recommendations. BIS and
Available online />Page 3 of 12
(page number not for citation purposes)
entropy sensors were randomly attached on both sides with
the Fz electrode to the upper and lower forehead, respectively.
A simple computer program (annotation board) was devel-
oped to help nurses to record the following interventions,
defined as events: sedative and analgesic drug bolus, increas-
ing or decreasing continuous sedation and analgesia, intratra-
cheal suctioning, and other potentially painful interventions (for
example, chest tube insertion). In addition, the reasons for
pharmacological interventions were recorded, as follows: agi-
tation with threat to patient or nurse; agitation; insufficient
sedation according to prescription; under-sedation/medical
reasons (fighting the ventilator, heart-lung interaction); reduc-
tion because of over-sedation level according to prescription;
anticipated painful stimulus; pain, as either indicated by the
patient or perceived by the nurse subjectively, or based on
vegetative signs exhibited by the patient; or opiates to sedate
the patient.
A web camera with movement detector was attached above
the patient's bed to facilitate the post hoc identification of the
exact time of the event. Sedative and analgesic drugs were
given in accordance with a standard protocol, using sedation
goals (RSS score [23]) and regular assessment of sedation
and pain at 2-hour intervals or more frequently. Standard
doses of fentanyl were 25 to 50 μg, of midazolam were 1 to 2
mg, and of propofol were 10 to 20 mg. If more than six boli
were needed in a 4-hour period, continuous infusion of the
respective drug was started. A daily sedation stop was con-
ducted unless the attending physician explicitly ordered other-
wise. Reduction in continuous medication at 2-hour intervals
was encouraged. Screening for delirium was not routinely con-
ducted at that time, and so only overt delirium was detected,
but no patient in this study received an antipsychotic drug
(haloperidol). All medications were prescribed by the treating
physician and applied by the bedside nurse, both of whom
were blinded to the EEG parameters. The bedside nurse was
free to administer drugs within the prescribed limits before a
painful stimulus, such as intratracheal suctioning. The main
reasons for administering drugs were anticipation of arterial
oxygen desaturation, pain, or heart-lung interaction. The EEG-
derived variables (BIS-Index, RE, SE, 60 sec mean values) and
physiological parameters were recorded continuously, and
were analyzed at 30 and 2 minutes before the event (time
points -30 and -2), and at 2, 5 and 10 minutes after the event
(time points +2, +5, +10).
The study was performed for 24 hours or until extubation, if
earlier. Afterward, the camera recordings were analyzed and
any missing annotations were completed. For all recorded
haemodynamic, respiratory and neurological parameters,
mean values over 60 seconds were calculated at 30 and 2
minutes before the intervention (stimulus or drug) and at 2, 5
and 10 minutes after the intervention. Because the events
were not planned, RSS score were not available at all time
points of EEG processing. Only RSS scores assessed shortly
before the event (< 15 minutes) were used for further analysis.
Because BIS-Index and Entropy are ordinal scale based, non-
parametric tests for independent or repeated measures were
used. Dunn's method was used for multiple pair-wise compar-
isons. Comparisons of continuous variables were conducted
after running a normality test (Kolmogorov-Smirnov), with the
appropriate parametric or nonparametric test, as indicated in
the tables. Receiver operating characteristic (ROC) curves
were used to define best cut-off values for definition of
responders to medication (decrease of the BIS-Index or SE/
RE), with the increase in the processed EEG variable between
the time points -30 minutes and -2 minutes as test variable.
Statistical analyses were conducted using the SigmaStat for
Windows Version 3.1 software package (Systat Software Inc.,
Point Richmond, CA, USA). A P value under 0.05 was consid-
ered statistically significant. ROC curves were constructed
with the SigmaPlot for Windows Version 10.0 software pack-
age (Systat Software Inc.).
Results
Fifty-one patients were included in the study (Table 1). Seven
patients were excluded after the study because of withdrawal
of informed consent (n = 1), insufficient EEG quality (n = 4)
and intermittent, unanticipated use of muscle relaxants (n = 2).
The median recording time was 23 hours (from 12:30 to
27:10 hours). Altogether, 1,722 events were identified, of
Table 1
Patient characteristics, and sedative and analgesic drugs used
Characteristic Value
Age (years median [range]) 66 (38 to 83)
Diagnosis (n)
ACS/circulatory failure 12
Respiratory failure (pneumonia, COPD) 11
Sepsis (other than pneumonia) 9
Trauma/major emergency surgery 4
Other 8
Sedation (n)
Midazolam 24
Propofol 17
Opiate only 3
Opiate (n)
Fentanyl 41
Sedation only 3
A total of 44 patients were included in the study. ACS, acute
coronary syndrome; COPD, chronic obstructive pulmonary disease.
Critical Care Vol 12 No 5 Haenggi et al.
Page 4 of 12
(page number not for citation purposes)
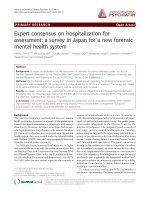
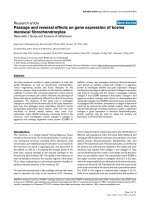
which 388 (23%) had to be excluded from analysis, mostly
because of missing annotations and failure to classify the
event clearly despite using video recordings. For in-depth anal-
yses, we considered the 407 endotracheal suctioning epi-
sodes, the 417 sedation boli and the 378 opiate boli (Figure
1). RSS score assessments in close proximity to time point -2
(2 minutes before an event) were available for 695 events.
Events with low incidences (< 5% of total) were excluded from
detailed analysis (Figure 1).
Relationship between EEG-derived variables and clinical
sedation level
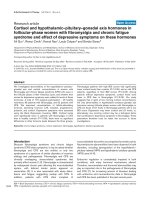
All EEG-derived variables correlated with the clinical level of
sedation (r = -0.372 for RE [n = 679]; r = -0.360 for SE [n =
679]; and r = -0.426 for BIS [n = 604]; all P < 0.001), but the
overlap between the clinical sedation levels was wide (Figure
2). None of the processed EEG variables was able to discrim-
inate between light to moderate sedation (RSS scores 1 to 4)
and deep sedation (RSS scores 5 to 6; Figure 2 and Table 2).
Although the differences were statistically significant, the first
quartiles of the light to moderately sedated patients' EEG
parameters were below the third quartiles of the other groups,
indicating clinically important overlap. Analysis of subgroups
of the events, namely sedation bolus, opiate bolus and
endotracheal suction, did not reveal any groups in which the
processed EEG performed better (see Additional data file 1).
Evaluation of the individual correlation coefficients of 22
patients in whom at least eight simultaneous measurements of
RSS score and processed EEG could be recorded did not
reveal any patients who had high coefficients (data not
shown). Therefore, the existence of some individuals with
good correlations of EEG parameters and RSS score appears
unlikely.
Reasons for increasing the level of sedation and
analgesia and the effect on EEG-derived variables
We recorded 417 events for which sedation boli were admin-
istered. The most common indication was agitation (n = 149),
followed by anticipation of unpleasant intervention (n = 116)
Figure 1
Diagram showing the numbers of patients and events ultimately used for analysisDiagram showing the numbers of patients and events ultimately used for analysis. NMB, neuromuscular blockade. ICD: informed consent (docu-
ment).
Available online />Page 5 of 12
(page number not for citation purposes)
and fighting the ventilator/heart-lung interactions/adverse cir-
culatory effects (n = 86). No specific reason was recorded for
57 events. For the agitation indication, all EEG-derived varia-
bles 2 minutes before drug administration, sedation levels
(RSS score) and the blood pressure differed in comparison
with the other indications (P < 0.001; Table 3). The EEG-
derived variables indicated deepest sedation in patients
receiving additional sedation due to fighting the ventilator or
heart-lung interactions (medical reasons in Table 3).
The indication for the administration of the 378 opiate boli was
most often anticipated pain during planned nursing (n = 73),
followed by agitation as a sign of pain (rated subjective by
nurse; n = 60) and agitation as a sign of pain (rated objective
as indicated by clinical signs; n = 56). The patient asked for
pain relief in 39 cases. Anticipation of pain during surgical
tasks (for example, wound dressing) was rare (n = 20), and
administration of opiate boli to reduce sedation was the excep-
tion (n = 9). No indication was noted 60 times, and various
indications were given in 49 events. Deepest processed EEG
values were registered with the anticipated pain indications, in
the sedation-sparing indication and in agitated patients with
objective signs of pain (Table 4).
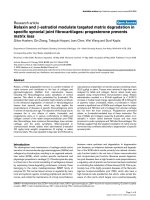
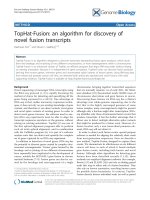
Patients responded to a sedation bolus with a significant
decrease in all processed EEG values. When endotracheal
suctioning was performed within 10 minutes after a sedation
bolus, the effect on processed EEG variables was attenuated
(Figure 3).
Neither increase in RE nor that in BIS from time point -30 min-
utes to -2 minutes was a good predictor of a strong response
10 minutes after the sedation bolus. ROC curves with a seda-
tion response (defined as a decrease in the processed EEG
variable of at least 15%, 20% and 25% after sedation bolus)
are shown in the Additional data file 2. The areas under the
Table 2
Processed EEG parameters at 2 minutes before the event, separated by patients with light versus deep sedation
RE SE BIS P values
All events
RSS score 1 to 4 (n = 539) 79 (35 to 97) 61 (30 to 86) 66 (48 to 89) All P < 0.001 (Mann-Whitney)
RSS score > 4 (n = 160) 34 (26 to 58) 31 (24 to 48) 41 (34 to 58)
Sedation boli
RSS score 1 to 4 (n = 192) 85 (39 to 97) 73 (34 to 86) 67 (49 to 91) All P < 0.001 (Mann-Whitney)
RSS score > 4 (n = 60) 33 (26 to 48) 31 (33 to 51) 40 (33 to 51)
Opiate boli
RSS score 1 to 4 (n = 179) 56 (30 to 96) 43 (26 to 85) 59 (46 to 83) All P < 0.001 (Mann-Whitney)
RSS score > 4 (n = 60) 31 (23 to 41) 29 (31 to 44) 40 (31 to 44)
ETS
RSS score 1 to 4 (n = 168) 89 (45 to 97) 75 (36 to 86) 74 (50 to 91) RE: P = 0.012
RSS score > 4 (n = 40) 50 (30 to 92) 44 (27 to 80) 60 (44 to 80) SE: P = 0.018
BIS: P = 0.058
RSS score 1 to 4 indicates light sedation, and RSS score > 4 indicates deep sedation. Values are expressed as median (interquartile range). BIS,
bispectral index; EEG, electroencephalogram; ETS, endotracheal suctioning; RE, response entropy; RSS, Ramsay Sedation Scale; SE, state
entropy.
Figure 2
Response entropy/BIS-Index/state entropy at different Ramsay Seda-tion Scale scoresResponse entropy/BIS-Index/state entropy at different Ramsay Seda-
tion Scale scores. The 1,932 data points (about 660 events) are at -2
minutes (2 minutes before an event). Boxes show median, 25th and
75th percentiles; whiskers indicate the 10th and 90th percentiles. RE,
response entropy; RS, Ramsay Sedation Scale; SE, state entropy.
Critical Care Vol 12 No 5 Haenggi et al.
Page 6 of 12
(page number not for citation purposes)
ROC curve were between 0.70 and 0.75 for RE and between
0.74 and 0.80 for BIS.
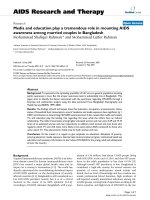
Response to unpleasant stimuli
In 103 instances patients received sedative and/or analgesic
drugs before intratracheal suctioning, whereas in 282
instances patients did not. EEG-derived variables exhibited no
difference between the groups at -30 minutes or -2 minutes
before the unpleasant stimulus (Figure 4 and Table 5). There
were also no significant or clinically relevant differences in
physiological parameters, such as heart rate, blood pressure
and respiration 2 minutes before endotracheal suctioning
(Table 5). Patients who never received medication before suc-
tioning, or who received medication less than 50% of the time,
did not differ with respect to age, Simplified Acute Physiology
Score or length of stay in the ICU from patients who always or
almost always received medication before suctioning (Table
4).
Patients with a 20% or greater increase in the processed EEG
variables between -30 minutes and -2 minutes reached their
baseline level faster if they had medication before suctioning,
whereas patients with an increase of less than 20% did not
show any difference (see Figure 5).
As with sedation bolus alone, neither increase in RE nor that
in BIS from time point -30 minutes to -2 minutes was a good
predictor of a response 10 minutes after the endotracheal suc-
tion with pre-medication. ROC curves with different sedation
responses are shown in the Additional data file 2. The areas
under the ROC curve were between 0.77 and 0.83 for RE and
between 0.78 and 0.80 for BIS.
Because several patients had sepsis, delirium or septic
encephalopathy was likely. We therefore divided the patients
into a nonseptic and a septic group, which revealed that proc-
essed EEG readings are lower in septic patients in some
occasional clinical scenarios, whereas the RS at -2 minutes
was the same throughout (see Additional data file 3).
Discussion
In the present observational study, which included additional
verification through a camera, we have created an unprece-
dented and large database of sedation events and unpleasant
stimuli in real-life patients. Furthermore, the decision not to
allocate study personnel for bedside annotations has mini-
mized effects of the study set-up (per se) on the nurses' deci-
sions. These data probably represent the largest study of
EEG-derived parameters in an ICU population outside the set-
Table 3
Processed EEG and physiological variables and RSS score 2 minutes before sedation boli
Variable Indication P Test
Agitation with
threat
Agitation Medical reasons Anticipated
nursing procedure
No annotation
n 20 129 86 116 57
Response entropy 91 (61 to 97) 91 (44 to 98) 35 (22 to 65) 48 (28 to 96) 65 (32 to 96) < 0.001 Kruskal-Wallis
State entropy 79 (54 to 86) 79 (40 to 88) 32 (21 to 56) 43 (26 to 74) 59 (29 to 85) < 0.001 Kruskal-Wallis
BIS-Index 81 (71 to 91) 76 (54 to 91) 48 (40 to 62) 57 (47 to 72) 72 (46 to 92) < 0.001 Kruskal-Wallis
RSS score 1 (1 to 2) 2 (1 to 4 to) 4 (3 to 5) 4 (2 to 4) 4 (2 to 4) < 0.001 Kruskal-Wallis
Heart rate
(beats/minute)
83 (69 to 104) 90 (73 to 104) 96 (90 to 107) 92 (72 to 100) 96 (85 to 107) 0.011 Kruskal-Wallis
etCO
2
(mmHg) 45 (37 to 62) 42 (34 to 55) 47 (35 to 57) 41 (36 to 53) 34 (33 to 50) 0.043 Kruskal-Wallis
Fi
O
2
(%) 48 (40 to 62) 47 (39 to 58) 50 (39 to 61) 48 (40 to 59) 39 (38 to 54) 0.062 Kruskal-Wallis
Respiratory rate
(breaths/minute)
19.0
(16.3 to 19.8)
15.5
(12.0 to 20.0)
17.8
(12.0 to 20.0)
14.3
(11.8 to 18.3)
17.7
(11.7 to 20.4)
0.025 Kruskal-Wallis
Sp
O
2
(%) 95 (92 to 98) 96 (92 to 98) 97 (95 to 98) 95 (93 to 98) 96 (95 to 98) 0.116 Kruskal-Wallis
SBP (mmHg) 115 ± 22 113 ± 21 96 ± 28 110 ± 26 113 ± 29 < 0.001 RM-ANOVA
MBP (mmHg) 79 (71 to 82) 70 (63 to 79) 63 (57 to 69) 69 (59 to 79) 70 (63 to 84) < 0.001 Kruskal-Wallis
DBP (mmHg) 60 (55 to 64) 50 (44 to 59) 46 (39 to 52) 50 (41 to 58) 52 (45 to 60) < 0.001 Kruskal-Wallis
The sedation boli were given for various indications, according to the nurses' notes. Values are expressed as median (interquartile range) or as
mean ± standard deviation. BIS, bispectral index; SBP, MBP, DBP, systolic, mean, diastolic blood pressure; EEG, electroencephlogram; etCO
2
,
end-tidal barbon dioxide; FiO2, fractional inspired oxygen; RM-ANOVA, repeated measures analysis of variance; RSS, Ramsay Sedation Scale;
SpO
2
, pulse oximetry.
Available online />Page 7 of 12
(page number not for citation purposes)
ting of a controlled study. Sedation is a multidimensional con-
cept, encompassing consciousness, amnesia, arousal,
analgesia and other parameters, and is difficult to represent
using a single scale. Failure in clinical practice to capture all
aspects of sedation and analgesia within a sedation scale is an
unsolved problem, as corroborated by the present study. The
RSS score [23], for example, is unbalanced and favours seda-
tion aspects; the Richmond Agitation and Sedation Score [17]
and the Sedation-Agitation Score [24] are more balanced, but
they lack the means to detect delirium or pain as a cause of
agitation. No score can predict arousal in ICU patients. It is
possible that failure to monitor all aspects of sedation in the
present study accounts for the proportion of missing details
regarding reasons for drug administration, and especially the
large proportion of additional comments given as reasons for
opioid administration. For example, nurses gave medication for
the indication 'heart-lung interaction/fighting the ventilator'
based on their observations of patient response during previ-
ous interventions despite deep sedation. The relatively high
frequency of opiate and sedative administration despite deep
sedation in anticipation of interventions and for diverse medi-
cal reasons (for instance, fighting ventilator and heart-lung
interactions) represents further evidence of the problems
associated with current sedation scores.
Taking a broader view, this might be the reason why, even
now, not all sedated patients in the ICU are monitored and
guided using a sedation score, as was recently confirmed by
Payen and coworkers [25]. As pointed out by Carlon and
Combs [26], 'If you cannot measure it, you cannot improve it.'
Table 4
Processed EEG and physiological variables, and RSS score 2 minutes before opiate boli
Variable Indication P
0: left
blank/
missing
1: patient
asks
2: agitation,
nurse thinks
of pain
3: agitation,
objective
signs of pain
4:
anticipated
pain
(surgical)
5:
anticipated
pain
(nursing)
6: to reduce
sedatives
7:
comment
N 60 39 60 56 16 73 9 49
Response
entropy
73
(27 to 97)
94 (35 to
98
53 (30 to 96 36 (25 to 63 28 (19 to 34 32 (25 to 81 17 (11 to
25
81 (33 to
96
< 0.001
State entropy 61
(25 to 87)
81
(25 to 84)
40 (24 to 87) 30 (22 to 56) 24
(18 to 29)
28
(23 to 71)
15
(10 to 19)
65
(31 to 83)
< 0.001
BIS-Index 66
(45 to 92)
77
(62 to 93)
62 (43 to 82) 51 (40 to 59) 49
(40 to 52)
53
(42 to 73)
46
(40 to 56)
54
(32 to 73)
< 0.001
RSS score 4 (2 to 5) 2 (2 to 3) 3 (1 to 4) 3 (2 to 4) 5 (3 to 5) 4 (3 to 4) 4 (2 to 4) 4 (2 to 5) < 0.001
Heart rate
(beats/
minute)
92
(81 to 102)
90
(72 to 101)
96
(90 to 107)
100
(94 to 109)
97
(90 to 110)
93
(85 to 100)
95
(93 to 100)
86
(74 to 95)
< 0.001
etCO
2
(mmHg)
36
(33 to 55)
34
(32 to 46)
41 (34 to 50) 48 (36 to 55) 43
(41 to 49)
41
(35 to 48)
54
(47 to 56)
34
(27 to 45)
< 0.001
Fi
O
2
(%) 41
(38 to 59)
39
(38 to 53)
44 (39 to 53) 53 (41 to 57) 46
(45 to 52)
45
(39 to 53)
58
(51 to 60)
39
(34 to 48)
< 0.001
Respiratory
rate
(breaths/
minute)
14.0
(11.8 to
19.9)
12.8
(10.0 to
19.0)
16.8
(12.2 to
20.9)
19.8
(16.6 to 22.0)
16.7
(13.6 to
20.0)
16.5
(12.0 to
19.8)
18.3
(13.5 to
19.0)
13.6
(12.0 to
18.0)
< 0.001
Sp
O
2
(%) 96
(93 to 98)
96
(93 to 97)
95 (94 to 98) 95 (93 to 97) 98
(96 to 98)
96
(94 to 98)
96
(94 to 97)
95
(94 to 97)
0.053
SBP (mmHg) 111
(99 to 126)
119
(104 to
146)
113
(102 to 133)
101
(91 to 113)
94
(76 to 102)
109
(96 to 120)
65
(53 to 116)
105
(99 to 116)
< 0.001
MBP (mmHg) 69
(61 to 78)
77
(71 to 83)
70 (66 to 81) 66 (62 to 73) 56
(48 to 68)
70
(62 to 75)
51
(44 to 79)
67
(62 to 74)
< 0.001
DBP (mmHg) 51
(42 to 59)
55
(48 to 59)
53 (47 to 59) 50 (45 to 54) 38
(28 to 44)
51
(43 to 58)
34
(34 to 43)
50
(47 to 55)
< 0.001
The opiate boli were given for various indications, according to the nurses' notes. Values are expressed as median (interquartile range). All P
values were calculated using the Kruskal-Wallis test. BIS, bispectral index; DBP, diastolic blood pressure; EEG, electroencephlogram; etCO
2
,
end-tidal barbon dioxide; FiO2, fractional inspired oxygen; MBP, mean blood pressure; RSS, Ramsay Sedation Scale; SBP, systolic blood
pressure; Sp
O
2
, pulse oximetry.
Critical Care Vol 12 No 5 Haenggi et al.
Page 8 of 12
(page number not for citation purposes)
Unfortunately, with the use of our sedation protocol, EEG-
derived parameters do not add helpful information in terms of
guiding the administration of sedatives or analgesics for the
most frequently occurring indication, namely agitation. With
respect to the second most used indication for sedatives and
opiates, namely anticipated pain during nursing or endotra-
cheal suctioning, neither EEG-derived parameters, an
increase in these parameters before suctioning, nor RSS
score can identify which patients might profit from prophylac-
tic drug administration. Because patients receiving prophylac-
tic drugs have statistically significant but clinically only slightly
worse lung function parameters, and because the EEG-
derived parameters reach their baseline levels faster after drug
administration, we could speculate that nurses have previously
noted a clinical benefit for some patients and have used pro-
phylactic drugs in those patients who benefit most. However,
these patients cannot be identified using processed EEG
parameters, and it is likely that prophylactic use of drugs is an
aspect of individual nurse behavior and has no rationale. For
the third most often used indication for sedation, namely fight-
ing the ventilator/heart-lung interaction, we also identified a
correlation between lower EEG-derived parameters and lower
sedation levels, but these parameters are unhelpful in deciding
whether to extend the sedation protocol, because neither the
clinical score nor the EEG parameters identify the indication
and precise time point when the drug should be given.
Regarding endotracheal suctioning, it was surprising that
patients who received drugs before the unpleasant stimulation
had a lower RSS score than those who did not receive the
medication, reflected in higher processed EEG variables,
although both of these associations were not statistically sig-
nificant. They also had a slightly lower EEG reading at +2 min-
utes as compared with -2 minutes, which mirrors the effect of
the sedation bolus. It could be argued that patients receiving
medication before the event have a lower EEG reading, and
that this is certainly due to the medication. However, if the time
between -30 minutes and -2 minutes is taken into account,
then the principal component of the rise in RE/SE/BIS lies
before the intervention, and so the need for suctioning elicits
more arousal than the suctioning itself. In turn, the use of med-
ication to attenuate the response to suctioning is less respon-
sible for the return of RE/SE/BIS to baseline than the
cessation of suctioning itself. So, it may be debated whether
prophylactic use of drugs before suctioning should be limited
to special groups of patients who cannot tolerate suctioning,
such as those with heart-lung interactions or high intracranial
pressure. This might reduce the total amount of drugs given to
the patients and therefore decrease the total ventilation time,
as demonstrated by various investigators [8,11].
The wide overlap of the parameters RE/SE and BIS-Index pre-
cludes the use of these variables as crude parameters for dis-
crimination of light/moderate/deep sedation in our patient
population. After initial enthusiasm over the use of the BIS-
Index as a parameter of sedation in ICU patients [13,14], con-
firmatory studies have found the wide overlap of the BIS-Index
to be problematic, although the BIS-XP technology can iden-
tify and better integrate artifactual EEGs in ICU patients [15-
17]. Still less has been published with regard to Entropy
®
in
ICU patients, but its use in this patient population was also dis-
couraged in a recent report [18].
Figure 3
Time courses of response entropy and BIS-Index after sedation bolusTime courses of response entropy and BIS-Index after sedation bolus. Black lines and red lines indicate stimulus (endotracheal suction) and no stim-
ulus within 10 minutes of the sedation bolus. Dots are medians, and the error bars indicate the 25th and 75th percentiles. The asterisk denotes a
significant difference (P < 0.05) between the groups at 10 minutes. RE, response entropy.
Available online />Page 9 of 12
(page number not for citation purposes)
The strength of studying real patients and patient-nurse inter-
actions is also a potential weakness of this study. Adherence
to the sedation protocol was not stringent, and a significant
portion of drug administration was recorded only in the nurses'
notes and not in the annotation board, especially with regard
to analgesic drug administration.
The lack of RSS scores collected concomitantly with proc-
essed EEG variables at all recording time points is also a limi-
tation of the study. Concomitant assessment of the clinical
degree of sedation and EEG parameters would have allowed
the relationship between the two to be addressed in greater
detail. Our study design did not allow this because the 'event'
could not be precisely anticipated. In addition, evaluating the
RSS score changes the EEG per se. There is a wide variation
in methods of timing and interpretation of EEG in conjunction
with clinical sedation assessment in the literature. Some
authors used a steady state at least 15 minutes from the event,
and manually averaged EEG values were only used when
there was a stable period [13]; others collected the EEG val-
ues during the assessment [14,17] or before assessment
[15,18], and still others took values only if the patient was not
arousable (at RSS score 6) [16].
Conclusion
Unpleasant or painful stimuli and use of sedative and analgesic
drugs are associated with significant changes in processed
EEG parameters. However, clinical indications for drug admin-
istration were not reflected by these EEG parameters, and
were barely reflected by sedation level before drug administra-
tion or tracheal suction. The use of a sedation score, as rec-
ommended in a recent guideline [12], is far from perfect, and
the need for sedation in special circumstances such as heart-
lung interactions or when patients fight the ventilator is not
reflected in sedation scores. Given that the poor quality of
sedation and difficulties in reaching and maintaining sedation
targets cannot be resolved with currently available processed
EEG methods or scores, how to achieve optimal sedation
remains a major problem in the ICU.
Key messages
• Sedation scores do not predict arousal and may not be
helpful in guiding sedation in some clinical settings.
• BIS-Index and Entropy do not add information which
can be used to guide sedation in the general ICU popu-
lation.
Table 5
Processed EEG and physiological parameters 2 minutes before endotracheal suctioning, with and without medication given up to
10 minutes before endotracheal suctioning
Variable Without medication With medication P Test
N 282 103
Response entropy 91 (47 to 97) 82 (39 to 97) 0.111 Mann-Whitney
State entropy 78 (42 to 87) 66 (31 to 85) 0.101 Mann-Whitney
BIS-Index 80 (57 to 93) 76 (49 to 91) 0.078 Mann-Whitney
Heart rate (beats/minute) 83 (70 to 99) 91 73–100) 0.09 Mann-Whitney
etCO
2
(mmHg) 37 (33.44) 41 (34 to 53) < 0.01 Mann-Whitney
Fi
O
2
(%) 40 (38 to 49) 47 (38 to 58) 0.02 Mann-Whitney
Respiratory rate (breaths/minute) 14.0 (11.0 to 18.0) 14.5 (11.6 to 19.0) 0.43 Mann-Whitney
Sp
O
2
(%) 95 (93 to 79) 95 (93 to 97) 0.92 Mann-Whitney
SBP (mmHg) 116 (103 to 138) 117 (103 to 134) 0.83 Mann-Whitney
MBP (mmHg) 74 (67 to 83) 75 (65 to 81) 0.45 Mann-Whitney
DBP (mmHg) 55 (49 to 61) 53 (44 to 60) 0.19 Mann-Whitney
RSS score 2 (2 to 4; n = 147) 3 (2 to 4; n = 61) 0.25 Mann-Whitney
Age (years) 66.6 ± 12.3 60.0 ± 10.9 0.11 t-test
SAPS II score 47.7 ± 19.2 42.2 ± 16.0 0.40 t-test
LOS (minutes) 10,750 (5,230 to 195,90) 10,305 (6,600 to 12,210) 0.99 Mann-Whitney
Because of the unbalanced numbers of events, age, SAPS and LOS were divided into two groups: endotracheal suctioning without medication or
with medication less than 50% of the time, and endotracheal suctioning with medication more than 50% of the time or always with medication.
Values are expressed as median (interquartile range) or as mean ± standard deviation. BIS, bispectral index; DBP, diastolic blood pressure; EEG,
electroencephlogram; etCO
2
, end-tidal barbon dioxide; FiO2, fractional inspired oxygen; LOS, length of stay; MBP, mean blood pressure; RSS,
Ramsay Sedation Scale; SAPS, Simplified Acute Physiology Score; SBP, systolic blood pressure; Sp
O
2
, pulse oximetry.
Critical Care Vol 12 No 5 Haenggi et al.
Page 10 of 12
(page number not for citation purposes)
Competing interests
The study was funded by an unrestricted grant from Instrumen-
tarium/Datex-Ohmeda, now GE Healthcare, Helsinki, Finland.
The study design was approved, but not influenced, by GE
Healthcare. Instrumentarium/Datex-Ohmeda was not involved
in any way in collection, analysis and interpretation of data, in
writing of the manuscript, or in the decision to submit this man-
uscript.
In relation to MH, CB, CS, JT and SMJ, the Department of
Intensive Care Medicine has received research funding from
GE Healthcare to carry out research projects related to depth
of anaesthesia monitoring. A part of the work reported here
resulted from these projects.
In relation to HY and IK, the VTT Technical Research Centre
of Finland have received funding from GE Healthcare to carry
out research projects related to depth of anaesthesia monitor-
ing. Both authors have been working on these research
projects, and part of the work reported here resulted from
these projects.
Authors' contributions
MH conceived and designed the study, contributed to acqui-
sition, analysis and interpretation of data, performed the statis-
tical analysis, and drafted the manuscript. HY made
substantial contributions to data acquisition and interpretation.
CB and CS planned the study, and collected and analyzed the
data. This manuscript represents their thesis for Medical
Degrees at the University of Bern. JT contributed to study
design, data interpretation and drafting of the manuscript. IK
contributed to data analysis and revised the manuscript. SJ
conceived of the study, and contributed substantially to all
parts of the study and manuscript preparation. All authors gave
final approval of the version to be published.
Acknowledgements
The authors would like to thank Klaus Maier, RN, and Patrick Munch, RN,
for their invaluable help as study nurses. We also thank Jeannie Wurz
(Department of Intensive Care Medicine, Bern University Hospital) for
editorial assistance and Dr Ulrich Kreuter, Consult AG Bern, for statisti-
cal advice (reimbursed by departmental funds).
Financial support was received from Datex-Ohmeda, now GE Health-
care, Helsinki, Finland.
References
1. Fraser GL, Prato BS, Riker RR, Berthiaume D, Wilkins ML: Fre-
quency, severity, and treatment of agitation in young versus
elderly patients in the ICU. Pharmacotherapy 2000, 20:75-82.
2. Treggiari-Venzi M, Borgeat A, Fuchs-Buder T, Gachoud JP, Suter
PM: Overnight sedation with midazolam or propofol in the ICU:
effects on sleep quality, anxiety and depression. Intensive
Care Med 1996, 22:1186-1190.
3. Epstein J, Breslow MJ: The stress response of critical illness.
Crit Care Clin 1999, 15:17-33.
4. Conti J, Smith D: Haemodynamic responses to extubation after
cardiac surgery with and without continued sedation. Br J
Anaesth 1998, 80:834-836.
Figure 4
Time course of RE and BIS-Index during endotracheal suctioning episodesTime course of RE and BIS-Index during endotracheal suctioning episodes. (a) Time course of RE during the endotracheal suctioning episodes (ET),
without (black) and with (red) medication before ET. Asterisks denote significant differences (P < 0.05) between the groups at these time points. (b)
Time course of BIS-Index during the ETs, without (black) and with (red) medication before ET. Asterisks denote significant differences (P < 0.05)
between the groups at these time points. RE, response entropy.
Available online />Page 11 of 12
(page number not for citation purposes)
5. Fraser GL, Riker RR, Prato BS, Wilkins ML: The frequency and
cost of patient-initiated device removal in the ICU. Pharmaco-
therapy 2001, 21:1-6.
6. Atkins PM, Mion LC, Mendelson W, Palmer RM, Slomka J, Franko
T: Characteristics and outcomes of patients who self-extubate
from ventilatory support: a case-control study. Chest 1997,
112:1317-1323.
7. Parker SD, Breslow MJ, Frank SM, Rosenfeld BA, Norris EJ, Chris-
topherson R, Rock P, Gottlieb SO, Raff H, Perler BA: Catecho-
lamine and cortisol responses to lower extremity
revascularization: correlation with outcome variables. Periop-
erative Ischemia Randomized Anesthesia Trial Study Group.
Crit Care Med 1995, 23:1954-1961.
8. Kollef MH, Levy NT, Ahrens TS, Schaiff R, Prentice D, Sherman G:
The use of continuous i.v. sedation is associated with prolon-
gation of mechanical ventilation. Chest 1998, 114:541-548.
Figure 5
Time course of EEG variables during endotracheal suctioning episodesTime course of EEG variables during endotracheal suctioning episodes. Findings are stratified by the increase in EEG parameters (> 20% versus <
20%) before endotracheal suctioning episodes (ET), with and without medication before ET. Asterisks denote significant differences between the
groups at these time points (P < 0.05). EEG, electroencephalogram.
Critical Care Vol 12 No 5 Haenggi et al.
Page 12 of 12
(page number not for citation purposes)
9. Shafer A: Complications of sedation with midazolam in the
intensive care unit and a comparison with other sedative reg-
imens. Crit Care Med 1998, 26:947-956.
10. Chastre J, Fagon JY: Ventilator-associated pneumonia. Am J
Respir Crit Care Med 2002, 165:867-903.
11. Kress JP, Pohlman AS, O'Connor MF, Hall JB: Daily interruption
of sedative infusions in critically ill patients undergoing
mechanical ventilation. N Engl J Med 2000, 342:1471-1477.
12. Jacobi J, Fraser GL, Coursin DB, Riker RR, Fontaine D, Wittbrodt
ET, Chalfin DB, Masica MF, Bjerke HS, Coplin WM, Crippen DW,
Fuchs BD, Kelleher RM, Marik PE, Nasraway SA Jr, Murray MJ,
Peruzzi WT, Lumb PD, Task Force of the American College of Crit-
ical Care Medicine (ACCM) of the Society of Critical Care Medi-
cine (SCCM), American Society of Health-System Pharmacists
(ASHP), American College of Chest Physicians: Clinical practice
guidelines for the sustained use of sedatives and analgesics
in the critically ill adult. Crit Care Med 2002, 30:119-141.
13. Simmons LE, Riker RR, Prato BS, Fraser GL: Assessing sedation
during intensive care unit mechanical ventilation with the Bis-
pectral Index and the Sedation-Agitation Scale. Crit Care Med
1999, 27:1499-1504.
14. Riker RR, Fraser GL, Simmons LE, Wilkins ML: Validating the
Sedation-Agitation Scale with the Bispectral Index and Visual
Analog Scale in adult ICU patients after cardiac surgery. Inten-
sive Care Med 2001, 27:853-858.
15. Walder B, Suter PM, Romand JA: Evaluation of two processed
EEG analyzers for assessment of sedation after coronary
artery bypass grafting. Intensive Care Med 2001, 27:107-114.
16. De Deyne C, Struys M, Decruyenaere J, Creupelandt J, Hoste E,
Colardyn F: Use of continuous bispectral EEG monitoring to
assess depth of sedation in ICU patients. Intensive Care Med
1998, 24:1294-1298.
17. Ely EW, Truman B, Shintani A, Thomason JW, Wheeler AP, Gor-
don S, Francis J, Speroff T, Gautam S, Margolin R, Sessler CN, Dit-
tus RS, Bernard GR: Monitoring sedation status over time in
ICU patients: reliability and validity of the Richmond Agitation-
Sedation Scale (RASS). JAMA 2003, 289:2983-2991.
18. Walsh TS, Ramsay P, Lapinlampi TP, Sarkela MO, Viertio-Oja HE,
Merilainen PT: An assessment of the validity of spectral entropy
as a measure of sedation statein mechanically ventilated crit-
ically ill patients. Intensive Care Med 2008, 34:308-315.
19. Roustan JP, Valette S, Aubas P, Rondouin G, Capdevila X: Can
electroencephalographic analysis be used to determine seda-
tion levels in critically ill patients? Anesth Analg 2005,
101:1141-1151.
20. Rampil IJ: A primer for EEG signal processing in anesthesia.
Anesthesiology 1998, 89:980-1002.
21. Viertio-Oja H, Maja V, Sarkela M, Talja P, Tenkanen N, Tolvanen-
Laakso H, Paloheimo M, Vakkuri A, Yli-Hankala A, Merilainen P:
Description of the Entropy algorithm as applied in the Datex-
Ohmeda S/5 Entropy Module. Acta Anaesthesiol Scand 2004,
48:154-161.
22. Liu N, Chazot T, Huybrechts I, Law-Koune JD, Barvais L, Fischler
M: The influence of a muscle relaxant bolus on bispectral and
Datex-Ohmeda entropy values during propofol-remifentanil
induced loss of consciousness. Anesth Analg 2005,
101:1713-1718.
23. Ramsay MA, Savege TM, Simpson BR, Goodwin R: Controlled
sedation with alphaxalone-alphadolone. BMJ 1974,
2:656-659.
24. Riker RR, Picard JT, Fraser GL: Prospective evaluation of the
Sedation-Agitation Scale for adult critically ill patients. Crit
Care Med 1999, 27:1325-1329.
25. Payen JF, Chanques G, Mantz J, Hercule C, Auriant I, Leguillou JL,
Binhas M, Genty C, Rolland C, Bosson JL: Current practices in
sedation and analgesia for mechanically ventilated critically ill
patients: a prospective multicenter patient-based study.
Anesthesiology 2007, 106:687-695.
26. Carlon GC, Combs AH: 'If you cannot measure it, you cannot
improve it'. Crit Care Med 2005, 33:1146-1147.