Báo cáo y học: "a comparison with reference values and the effect of positive end-expiratory pressure in intensive care unit patients with different lung condition" ppsx
Bạn đang xem bản rút gọn của tài liệu. Xem và tải ngay bản đầy đủ của tài liệu tại đây (309.15 KB, 6 trang )
Open Access
Available online />Page 1 of 6
(page number not for citation purposes)
Vol 12 No 6
Research
End-expiratory lung volume during mechanical ventilation: a
comparison with reference values and the effect of positive
end-expiratory pressure in intensive care unit patients with
different lung conditions
Ido G Bikker, Jasper van Bommel, Dinis Reis Miranda, Jan Bakker and Diederik Gommers
Department of Intensive Care Medicine, Erasmus MC, 's Gravendijkwal 230, 3015 CERotterdam, The Netherlands
Corresponding author: Diederik Gommers,
Received: 25 Jun 2008 Revisions requested: 31 Jul 2008 Revisions received: 30 Oct 2008 Accepted: 20 Nov 2008 Published: 20 Nov 2008
Critical Care 2008, 12:R145 (doi:10.1186/cc7125)
This article is online at: />© 2008 Bikker et al.; licensee BioMed Central Ltd.
This is an open access article distributed under the terms of the Creative Commons Attribution License ( />),
which permits unrestricted use, distribution, and reproduction in any medium, provided the original work is properly cited.
Abstract
Introduction Functional residual capacity (FRC) reference
values are obtained from spontaneous breathing patients, and
are measured in the sitting or standing position. During
mechanical ventilation FRC is determined by the level of positive
end-expiratory pressure (PEEP), and it is therefore better to
speak of end-expiratory lung volume. Application of higher levels
of PEEP leads to increased end-expiratory lung volume as a
result of recruitment or further distention of already ventilated
alveoli. The aim of this study was to measure end-expiratory lung
volume in mechanically ventilated intensive care unit (ICU)
patients with different types of lung pathology at different PEEP
levels, and to compare them with predicted sitting FRC values,
arterial oxygenation, and compliance values.
Methods End-expiratory lung volume measurements were
performed at PEEP levels reduced sequentially (15, 10 and then
5 cmH
2
O) in 45 mechanically ventilated patients divided into
three groups according to pulmonary condition: normal lungs
(group N), primary lung disorder (group P), and secondary lung
disorder (group S).
Results In all three groups, end-expiratory lung volume
decreased significantly (P < 0.001) while PEEP decreased from
15 to 5 cmH
2
O, whereas the ratio of arterial oxygen tension to
inspired oxygen fraction did not change. At 5 cmH
2
O PEEP,
end-expiratory lung volume was 31, 20, and 17 ml/kg predicted
body weight in groups N, P, and S, respectively. These
measured values were only 66%, 42%, and 34% of the
predicted sitting FRC. A correlation between change in end-
expiratory lung volume and change in dynamic compliance was
found in group S (P < 0.001; R
2
= 0.52), but not in the other
groups.
Conclusions End-expiratory lung volume measured at 5 cmH
2
O
PEEP was markedly lower than predicted sitting FRC values in
all groups. Only in patients with secondary lung disorders were
PEEP-induced changes in end-expiratory lung volume the result
of derecruitment. In combination with compliance, end-
expiratory lung volume can provide additional information to
optimize the ventilator settings.
Introduction
Monitoring end-expiratory lung volume (EELV) might be a val-
uable tool to optimize respiratory settings in mechanical venti-
lation [1]. However, determining EELV at the bedside in
critically ill patients is not without difficulties. EELV can be
measured using computed tomography [2,3], but this tech-
nique is not available for routine application at the bedside.
Traditionally, EELV measurement techniques are based on
dilution of tracer gases, such as sulfur hexafluoride washout
[4], closed circuit helium dilution [5], or open circuit multi-
breath nitrogen washout [6]. All of these techniques still need
expensive and/or complex instrumentation and are in general
not suitable for routine EELV measurements in the ICU. An
alternative is the simplified helium dilution method, using a re-
breathing bag with a helium mixture. However, an important
disadvantage of this technique is that it requires interruption of
mechanical ventilation for a short period of time [7]. Recently,
Stenqvist and colleagues [8] introduced a novel method to
ALI: acute lung injury; ARDS: acute respiratory distress syndrome; EELV: end-expiratory lung volume; FiO
2
: inspired oxygen fraction; FRC: Functional
residual capacity; NMBW: nitrogen multiple breath washout; Pao
2
: arterial oxygen tension; PEEP: positive end-expiratory pressure.
Critical Care Vol 12 No 6 Bikker et al.
Page 2 of 6
(page number not for citation purposes)
measure EELV without interruption of mechanical ventilation,
based on a simplified and modified nitrogen multiple breath
washout (NMBW) technique, which is integrated into a
mechanical ventilator. This method requires a step change in
the inspired oxygen fraction (Fio
2
), without the need for sup-
plementary tracer gases or specialized additional monitoring
equipment [8].
Functional residual capacity (FRC) during spontaneous
breathing is normally measured in the sitting or standing posi-
tion and is length and age dependent. It has been shown that
FRC is decreased by 25% in spontaneous breathing healthy
volunteers after changing from the sitting to the supine posi-
tion [9].
In critically ill patients receiving mechanical ventilation, FRC is
determined by the level of positive end-expiratory pressure
(PEEP), and it is therefore better to speak of EELV. Application
of higher levels of PEEP leads to increased EELV values as a
result of recruitment or further distention of already ventilated
alveoli. To differentiate between recruitment and distention,
EELV changes are combined with compliance values.
In this study, we used the modified NMBW technique to meas-
ure EELV at three different PEEP levels in mechanically venti-
lated patients with either non-acute respiratory failure or with a
primary or secondary lung disorder. The results were com-
pared with reference predicted FRC values, arterial oxygena-
tion, and dynamic compliance.
Materials and methods
The study population consisted of a convenient sample of 45
sedated and mechanically ventilated patients. For all patients,
chest radiographs and, if available, computed tomography
scans were retrospectively evaluated and related to clinical
history and data to divide the patients into three groups:
patients without acute respiratory failure (group N), those with
respiratory failure due to primary lung disorders (group P), and
those with respiratory failure due to secondary lung disorders
(group S). With the approval of the local institutional human
investigations committee, and after obtaining written informed
consent, patients were enrolled in this study within 48 hours
after intubation. Exclusion criteria were as follows: pneumoth-
orax, pneumectomy, lung transplantation, and severe cardio-
vascular instability. Also, severe airflow obstruction due to
chronic obstructive pulmonary disease (defined as forced
expired volume in 1 second or vital capacity below predicted
value minus 2 standard deviations) and patients with major
inhomogeneous alveolar ventilation, as indicated by a signifi-
cant upslope in phase III of the capnogram, were excluded.
This was because gas wash out/in time could possibly be too
short and end-tidal carbon dioxide could become unstable,
potentially leading to errors in EELV measurement. We were
unable to include patients with severe acute respiratory dis-
tress syndrome requiring a PEEP of 20 cm H
2
O in our protocol
because a pressure limitation of the COVX module (GE
Healthcare, Helsinki, Finland) at around 18 to 20 cmH
2
O
PEEP.
During the study period patients were ventilated with an Eng-
ström Carestation ventilator (GE Healthcare, Madison, USA).
EELV measurements were carried out with the COVX module
(GE Healthcare, Helsinki, Finland) integrated within the venti-
lator. This module was described in detail previously [9]. At
baseline, patients were switched to the Engström ventilator
and ventilated according to their original settings before any
measurements were performed. PEEP was increased to 15
cm H
2
O and the inspiratory pressure was adjusted to maintain
tidal volume and without changing other ventilator settings.
After a steady state had been achieved for at least 20 minutes,
EELV was measured twice (wash-out and wash-in). This was
repeated after a steady state lasting 10 minutes at both PEEP
10 cmH
2
O and PEEP 5 cmH
2
O. In all patients the same
sequence of PEEP steps was used. Before each EELV meas-
urement, hemodynamic and ventilatory parameters were
recorded and arterial blood gas analysis performed (ABL 700;
Radiometer, Copenhagen, Denmark) in order to calculate the
arterial oxygen tension (Pao
2
)/Fio
2
ratio. Arterial blood sam-
ples were taken 10 minutes after the PEEP change and just
before the EELV measurement to avoid any influence of the
step change in Fio
2
required for the nitrogen wash-out/wash-
in test. At the time of the EELV measurement, no muscle relax-
ation was used in the patients evaluated.
In all patients, EELV values were indexed according to pre-
dicted body weight (PBW) using the ARDSnet formula [10],
which was calculated for men as 50 + 0.91 × (height [cm] –
152.4), and for women as 45.5 + 0.91 × (height [cm] –
152.4). In order to compare EELV values, reference EELV was
calculated for each patient. Predicted sitting EELV was calcu-
lated for men as 2.34 × height (m) + 0.009 × age (years) –
1.09, and for women as 2.24 × height (m) + 0.001 × age
(years) – 1.00 [11].
Statistical analysis
Statistical analysis was performed with SPSS version 14.0
(SPSS Inc., Chicago, IL, USA). Data are expressed as mean ±
standard deviation. Comparisons between the three groups
were performed using one-way analysis of variance. When
appropriate, post hoc analyses were performed with Bonfer-
roni's test. To test whether and how EELV and Pao
2
/Fio
2
ratio
decreased with lower PEEP levels, we used analysis of vari-
ance for repeated measurements. Again, Bonferroni's test was
used for post hoc analyses if appropriate. Correlation between
EELV and the Pao
2
/Fio
2
ratio or dynamic compliance was ana-
lyzed using Pearson's correlation. For all comparisons P <
0.05 was considered significant.
Available online />Page 3 of 6
(page number not for citation purposes)
Results
We examined 45 mechanically ventilated patients, retrospec-
tively divided into three groups. Group N (n = 19) consisted of
patients with traumatic brain injury (seven), cerebrovascular
accident (seven), postoperative condition after neurosurgery
(three), Fournier gangrene without evidence for pulmonary
complications (one), and diagnostic laparotomy, without evi-
dence for intra-abdominal hypertension (one). Group P (n =
16) consisted of patients with pneumonia (12), aspiration
pneumonia (three) and major atelectasis (one). In group S (n =
10) all patients had abdominal sepsis. In the latter group, three
out of the 10 patients had an open abdomen after decompres-
sion for intra-abdominal hypertension; the remainder of the
patients with abdominal sepsis had an intra-abdominal pres-
sure ranging from 10 to 15 cmH
2
O. Patient's baseline data
were comparable between the three groups, except for Lung
Injury Score and baseline PEEP. Baseline Pao
2
/Fio
2
ratio and
baseline dynamic compliance were lower in the two groups
with lung disorders (groups P and S; Table 1).
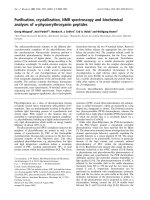
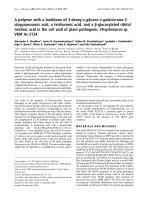
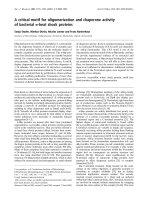
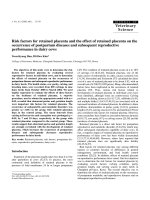
Measured EELV is presented in Figure 1. In group N, meas-
ured EELV at 5 cmH
2
O PEEP was 66% of the predicted sit-
ting FRC (Figure 2). In both groups with lung disorders
(groups P and S), EELV was significantly (P < 0.001) reduced
to 42%, and 35% of the predicted sitting FRC, respectively.
Mean EELV values at 15, 10, and 5 cmH
2
O PEEP were 40.9,
37.1, and 31.3 ml/kg PBW, respectively, in group N; 26.0,
23.6, and 20.2 ml/kg PBW in group P; and 23.4, 20.6, and
17.2 ml/kg PBW in group S.
The effect of the stepwise reduction in PEEP on the change in
EELV in each patient in the three study groups is shown in Fig-
ure 1. Irrespective of group, EELV decreased linearly with
reductions in PEEP; only in some patients was an increase or
Table 1
Data on the study patients by subgroup
Parameter Normal lung function (group N) Primary lung disorder (group P) Secondary lung disorder (group S)
n 19 16 10
Female sex (%) 36.8 31.3 30.0
Age (years) 49 ± 16 52 ± 17 52 ± 18
Height (cm) 176 ± 9 177 ± 10 169 ± 6
Weight (kg) 73.6 ± 11.6 76.4 ± 15.0 78.7 ± 27.3
PBW (kg) 69.8 ± 10.6 71.0 ± 10.8 64.4 ± 7.2
LIS 0.9 ± 0.5 2.4 ± 0.8 2.1 ± 0.3
Tint (hours) 20.2 ± 16.6 28.9 ± 46.9 30.1 ± 26.2
Survival (n/n [%]) 16/19 (84%) 13/16 (81%) 4/10 (40%)
Baseline PEEP (cmH
2
O) 6.2 ± 2.1 11.3 ± 4.1** 11.1 ± 2.6**
Baseline Pao
2
/Fio
2
ratio (kPa) 49.7 ± 11.9 26.1 ± 11.2** 32.7 ± 13.1*
Baseline compliance dynamic (ml/
cmH
2
O)
50.3 ± 13.0 35.6 ± 12.1* 38.8 ± 12.2*
Predicted sitting EELV (l) 3.3 ± 0.4 3.4 ± 0.4 3.2 ± 0.2
Ventilation mode
Pressure control 7 8 4
Pressure support 5 6 6
Volume control 1 0 0
Pressure controlled – volume
guaranteed
62 0
Unless otherwise stated, values are presented as mean ± standard deviation. The LIS (Murray) is based on dynamic compliance. *P = 0.05, **P =
0.001, versus group N. LIS, Lung Injury Score; PBW, predicted body weight; PEEP, positive end-expiratory pressure; Tint, time between
intubation and inclusion.
Critical Care Vol 12 No 6 Bikker et al.
Page 4 of 6
(page number not for citation purposes)
decrease in the slope observed after stepwise reduction in
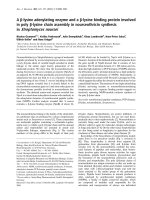
PEEP level. In all three groups, EELV decreased significantly
(P < 0.001) while decreasing PEEP from 15 to 5 cm H
2
O,
whereas the Pao
2
/Fio
2
ratio did not change (Figures 1 and 3).
Patients in group S had lower EELV, but higher Pao
2
/Fio
2
ratio,
compared with group P (Figures 1 and 3). EELV was corre-
lated with the Pao
2
/Fio
2
ratio in group P (R
2
= 0.40; P = 0.02),
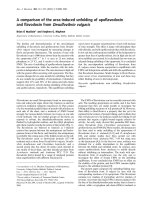
but not in groups N and S. Correlation between change in
EELV and change in compliance was significant in group S (P
< 0.001; R
2
= 0.52), but not in groups N (P = 0.51) and P (P
= 0.94; Figure 4).
Discussion
In mechanically ventilated patients with and without acute res-
piratory failure, measured EELV was markedly reduced in com-
parison with the predicted sitting FRC. Only in patients with
secondary lung disorders were EELV changes accompanied
by compliance changes, indicating derecruitment after reduc-
ing the PEEP. In addition, we did not identify a good correla-
tion between measured EELV and the Pao
2
/Fio
2
ratio in any of
the three study groups.
Blood gases are frequently used to monitor the patient's lung
function during mechanical ventilation. One should note that
determining lung collapse by Pao
2
/Fio
2
ratio assumes minimal
extrapulmonary shunt. Cressoni and coworkers [12] have
shown that variation in gas exchange cannot be used with suf-
ficient confidence to assess anatomical lung recruitment in
patients with acute lung injury (ALI)/acute respiratory distress
syndrome (ARDS). It therefore seems reasonable to monitor
lung volume changes caused by alveolar recruitment or alveo-
lar collapse by repeated measurements of FRC instead of arte-
rial oxygenation. FRC is defined as the relaxed equilibrium
volume of the lungs when there is no muscle activity and no
pressure difference between alveoli and the atmosphere [13].
FRC is determined in spontaneously breathing, resting normal
individuals at the end of a normal expiration, and therefore
EELV is used to denote 'FRC' during mechanical ventilation.
Most studies addressing EELV in the ICU describe new tech-
niques with good accuracy and good repeatability, but without
presenting their data on the measured EELV values for the
individual ICU patient [5-7,14,15]. Olegard and colleagues [8]
measured EELV in a mixed ICU population and found EELV
volumes ranging from 1,153 to 5,468 ml, but they did not
report on the PEEP levels used. Only Neumann and coworkers
[16] presented the measured mean EELV data for postopera-
tive patients, and patients with ALI and chronic obstructive pul-
monary disease at different PEEP levels (0, 5, and 10 cmH
2
O).
In their study, at a PEEP of 5 cmH
2
O the measured EELV val-
ues were 2.5 l and 1.5 l in the postoperative and ALI groups,
respectively. We found comparable EELV data for the similarly
defined groups of patients (groups N and P) at comparable
PEEP levels.
Normally, FRC reference values are obtained from spontane-
ously breathing patients in the standing or sitting position [11],
but no reference values are available for supine mechanically
ventilated patients. Ibanez and colleagues [9] showed that
FRC decreased by 25% after changing the patient's position
from sitting to supine during spontaneous breathing in healthy
volunteers. If one assumes that ventilation of a 'healthy' lung at
Figure 1
Progression of EELV in individual patients over three stepwise reduc-tions in PEEPProgression of EELV in individual patients over three stepwise
reductions in PEEP. Mean EELV values at each PEEP level are pre-
sented as black dots. Patients are divided according to the type of lung
condition. Patients in group N had normal lungs, those in group P had a
primary lung disorder, and those in group S had a secondary lung dis-
order. EELV, end-expiratory lung volume; PBW, predicted body weight;
PEEP, positive end-expiratory pressure.
Figure 2
Measured EELV as percentage of predicted sitting FRC at three PEEP levelsMeasured EELV as percentage of predicted sitting FRC at three
PEEP levels. The black dotted line represent predicted sitting FRC
(100%). Patients in group N had normal lungs, those in group P had a
primary lung disorder, and those in group S had a secondary lung dis-
order. Values are expressed as mean ± standard deviation. EELV, end-
expiratory lung volume; Fi
O
2
, inspired oxygen fraction; FRC, functional
residual capacity; Pao
2
, arterial oxygen tension; PEEP, positive end-
expiratory pressure.
Available online />Page 5 of 6
(page number not for citation purposes)
a PEEP of 5 cmH
2
O occurs approximately at FRC level, then
we found a reduction of 34% in group N (measured EELV
compared with predicted sitting FRC). This extra reduction in
EELV (34% versus 25%) is probably due to loss of muscle
tension attributed to the use of sedation in our ICU patients.
Furthermore, we opted not to use the regression equations of
Ibanez and colleagues [9] to calculate predicted supine FRC
for our patients, because their study population consisted of
relatively short (mean 1.65 m) and young people (mean 35
years), and age was not included in their regression equations,
whereas our ICU population consisted mainly of tall, elderly
people. Instead, we decided to use the predicted sitting FRCs
[11] and to reduce these based on the reduction observed in
patients without lung disorders at 5 cmH
2
O PEEP (34%) to
estimate the predicted supine FRC. In groups P and S, meas-
ured EELV values were 63% and 53%, respectively, of the
predicted supine FRC at a PEEP of 5 cmH
2
O.
EELV measurements alone cannot be used to define optimal
ventilator settings, because EELV can be increased without
recruitment (already open alveoli are further inflated). There-
fore, increases in both EELV and dynamic compliance should
be used to identify successful recruitment. In our study, we did
not perform a recruitment maneuver but applied 15 cmH
2
O
PEEP in all patients. In group N (without lung disorders), the
Pao
2
/Fio
2
ratio at 5 cmH
2
O PEEP was already 49.7 kPa (373
Torr), indicating that the lung was almost entirely open at this
PEEP level and therefore application of higher PEEP levels
would only further inflate the already open alveoli. Gatinnoni
and coworkers [17] showed that ARDS from extrapulmonary
origin had an abnormally increased chest wall elastance and a
major response to the application of 15 cmH
2
O PEEP,
whereas ARDS from primary pulmonary origin showed a lack
of recruitment and an increase in total respiratory elastance
with the application of PEEP. The group with primary lung dis-
orders could be compared to ARDS from pulmonary origin
with consolidation, whereas group S could be compared to
ARDS from extrapulmonary origin with prevalent edema and
lung collapse. In our study we found a significant correlation
between EELV and compliance in group S, but not in groups
N and P (Figure 4). This change in lung volume accompanied
by compliance indicates recruitment or derecruitment. In this
study, patients with secondary lung disorders benefitted from
higher PEEP, whereas patients with primary or without lung
disorders did not, and application of higher PEEP in this set-
ting would lead to overdistention.
Surprisingly, patients with secondary lung disorders due to
abdominal sepsis had the lowest EELV values at the PEEP lev-
els we used (Figure 1). From obese patients, we have learned
Figure 3
Pao
2
/Fio
2
ratio in different types of lung conditions at three PEEP levelsPao
2
/Fio
2
ratio in different types of lung conditions at three PEEP levels. Patients in group N had normal lungs, those in group P had a primary
lung disorder, and those in group S had a secondary lung disorder. Values are expressed as mean ± standard deviation. EELV, end-expiratory lung
volume; Fi
O
2
, inspired oxygen fraction; Pao
2
, arterial oxygen tension; PBW, predicted body weight; PEEP, positive end-expiratory pressure.
Figure 4
Correlation between change in EELV and change in dynamic compli-anceCorrelation between change in EELV and change in dynamic com-
pliance. Data are presented as the difference between the lowest
PEEP level (5 cmH
2
O) and 10 or 15 cmH
2
O PEEP. Patients in group N
had normal lungs, those in group P had a primary lung disorder, and
those in group S had a secondary lung disorder. EELV, end-expiratory
lung volume; PEEP, positive end-expiratory pressure.
Critical Care Vol 12 No 6 Bikker et al.
Page 6 of 6
(page number not for citation purposes)
that increased intra-abdominal pressure leads to decreased
chest wall compliance and a cranial shift of the diaphragm,
with consequent reduction in lung volume and atelectasis for-
mation, especially in the basal parts of the lung. In group P
(patients with pneumonia), EELV was also decreased but this
was due to consolidation in a part of the lung.
For our measurements we used the NMBW method with a
step change of 0.2 in Fio
2
to measure EELV. With this method,
the alveolar EELV is calculated without the anatomical dead
space [8]. We were able to perform stable measurements in
both controlled and partial support ventilatory modes, and we
found no significant difference in EELV between the two
modes. Using this NMBW method, it is assumed that there is
no transfer of nitrogen from alveoli to blood during the EELV
measurement, but this can be eliminated by an EELV measure-
ment during wash-out and one during wash-in.
Conclusion
We conclude that in mechanically ventilated and sedated
patients, EELV is markedly reduced compared with predicted
sitting FRC values. In addition, it has become clear that PEEP-
induced changes in EELV not only represent recruitment or
derecruitment, but they can also be the result of inflation or
deflation of already ventilated lungs. Therefore, EELV alone is
not the 'magic' bullet, but in combination with compliance it
can provide additional information to optimize the ventilator
settings.
Competing interests
We received an unrestricted grant from GE Healtcare.
Authors' contributions
IB carried out the data acquisition, analysis, statistical analysis,
and participated in drafting the manuscript. DRM participated
in the statistical analysis and drafting the manuscript. DG par-
ticipated in the data acquisition and drafting the manuscript.
JvB and JB participated in drafting the manuscript. All authors
read and approved the final manuscript.
Acknowledgements
The authors thank Laraine Visser-Isles for English language editing.
References
1. Hedenstierna G: The recording of FRC: is it of importance and
can it be made simple? Intensive Care Med 1993, 19:365-366.
2. Drummond GB: Computed tomography and pulmonary meas-
urements. Br J Anaesth 1998, 80:665-671.
3. Gattinoni L, Caironi P, Pelosi P, Goodman LR: What has com-
puted tomography taught us about the acute respiratory dis-
tress syndrome? Am J Respir Crit Care Med 2001,
164:1701-1711.
4. East TD, Wortelboer PJ, van Ark E, Bloem FH, Peng L, Pace NL,
Crapo RO, Drews D, Clemmer TP: Automated sulfur hexafluo-
ride washout functional residual capacity measurement sys-
tem for any mode of mechanical ventilation as well as
spontaneous respiration. Crit Care Med 1990, 18:84-91.
5. Di Marco F, Rota SL, Milan B, Stucchi R, Centanni S, Brochard L,
Fumagalli R: Measurement of functional residual capacity by
helium dilution during partial support ventilation: in vitro accu-
racy and in vivo precision of the method. Intensive Care Med
2007, 33:2109-2115.
6. Fretschner R, Deusch H, Weitnauer A, Brunner JX: A simple
method to estimate functional residual capacity in mechani-
cally ventilated patients. Intensive Care Med 1993, 19:372-376.
7. Patroniti N, Bellani G, Manfio A, Maggioni E, Giuffrida A, Foti G,
Pesenti A: Lung volume in mechanically ventilated patients:
measurement by simplified helium dilution compared to quan-
titative CT scan. Intensive Care Med 2004, 30:282-289.
8. Olegard C, Sondergaard S, Houltz E, Lundin S, Stenqvist O: Esti-
mation of functional residual capacity at the bedside using
standard monitoring equipment: a modified nitrogen wash-
out/washin technique requiring a small change of the inspired
oxygen fraction. Anesth Analg 2005, 101:206-212.
9. Ibanez J, Raurich JM: Normal values of functional residual
capacity in the sitting and supine positions. Intensive Care Med
1982, 8:173-177.
10. Knoben JE, Anderson PO: Handbook of Clinical Drug Data 7th
edition. Hamilton, IL: Drug Intelligence; 1993.
11. Quanjer PH, Tammeling GJ, Cotes JE, Pedersen OF, Peslin R, Yer-
nault JC: Lung volumes and forced ventilatory flows. Report
Working Party Standardization of Lung Function Tests, Euro-
pean Community for Steel and Coal. Official Statement of the
European Respiratory Society. Eur Respir J Suppl
1993,
16:5-40.
12. Cressoni M, Caironi P, Polli F, Carlesso E, Chiumello D, Cadring-
her P, Quintel M, Ranieri VM, Bugedo G, Gattinoni L: Anatomical
and functional intrapulmonary shunt in acute respiratory dis-
tress syndrome. Crit Care Med 2008, 36:669-675.
13. Lumb AB: Nunn's Applied Respiratory Physiology 5th edition.
Elsevier; 2006.
14. Eichler W, Schumacher J, Roth-Isigkeit A, Braun J, Kuppe H, Klotz
KF: Automated evaluation of functional residual capacity by
oxygen washout. J Clin Monit Comput 2002, 17:195-201.
15. Zinserling J, Wrigge H, Varelmann D, Hering R, Putensen C:
Measurement of functional residual capacity by nitrogen
washout during partial ventilatory support. Intensive Care Med
2003, 29:720-726.
16. Neumann P, Zinserling J, Haase C, Sydow M, Burchardi H: Evalu-
ation of respiratory inductive plethysmography in controlled
ventilation: measurement of tidal volume and PEEP-induced
changes of end-expiratory lung volume. Chest 1998,
113:443-451.
17. Gattinoni L, Pelosi P, Suter PM, Pedoto A, Vercesi P, Lissoni A:
Acute respiratory distress syndrome caused by pulmonary
and extrapulmonary disease. Different syndromes? Am J
Respir Crit Care Med 1998, 158:3-11.
Key messages
• EELV is markedly reduced in critically ill patients.
• EELV in ICU patients without lung disorders ventilated
at 5 cmH
2
O PEEP is reduced with 34% compared with
FRC reference values in sitting position.
• Compliance and EELV are correlated only in patients
with respiratory failure because of secondary lung disor-
ders, indicating successful recruitment.
• During mechanical ventilation, EELV in combination with
compliance can provide additional information that can
help in optimizing ventilator settings.