Báo cáo y học: "Association between administered oxygen, arterial partial oxygen pressure and mortality in mechanically ventilated intensive care unit patients" doc
Bạn đang xem bản rút gọn của tài liệu. Xem và tải ngay bản đầy đủ của tài liệu tại đây (201.81 KB, 8 trang )
Open Access
Available online />Page 1 of 8
(page number not for citation purposes)
Vol 12 No 6
Research
Association between administered oxygen, arterial partial oxygen
pressure and mortality in mechanically ventilated intensive care
unit patients
Evert de Jonge
1
, Linda Peelen
2,3
, Peter J Keijzers
4
, Hans Joore
4
, Dylan de Lange
4
, Peter HJ van der
Voort
5
, Robert J Bosman
5
, Ruud AL de Waal
6
, Ronald Wesselink
7
and Nicolette F de Keizer
2
1
Department of Intensive Care, Academic Medical Center, Meibergdreef 9, 1105 AZ Amsterdam, The Netherlands
2
Department of Medical Informatics, Academic Medical Center, Meibergdreef 9, 1105 AZ Amsterdam, The Netherlands
3
Department of Epidemiology, Julius Center for Health Sciences and Primary Care, University Medical Center, Heidelberglaan 100, 3584 CX Utrecht,
The Netherlands
4
Intensive Care, University Medical Center, Heidelberglaan 100, 3584 CX, Utrecht, The Netherlands
5
Intensive Care, Onze Lieve Vrouwe Gasthuis, Oosterpark 91091 AC Amsterdam, The Netherlands
6
Intensive Care, Amphia Medical Center, Molengracht 21, 4818 CK Breda, The Netherlands
7
Intensive Care, St. Antonius Hospital Koekoekslaan 1, 3435 CM Nieuwegein, The Netherlands
Corresponding author: Evert de Jonge,
Received: 4 Jul 2008 Revisions requested: 8 Sep 2008 Revisions received: 12 Nov 2008 Accepted: 10 Dec 2008 Published: 10 Dec 2008
Critical Care 2008, 12:R156 (doi:10.1186/cc7150)
This article is online at: />© 2008 de Jonge et al.; licensee BioMed Central Ltd.
This is an open access article distributed under the terms of the Creative Commons Attribution License ( />),
which permits unrestricted use, distribution, and reproduction in any medium, provided the original work is properly cited.
Abstract
Introduction The aim of this study was to investigate whether in-
hospital mortality was associated with the administered fraction
of oxygen in inspired air (FiO
2
) and achieved arterial partial
pressure of oxygen (PaO
2
).
Methods This was a retrospective, observational study on data
from the first 24 h after admission from 36,307 consecutive
patients admitted to 50 Dutch intensive care units (ICUs) and
treated with mechanical ventilation. Oxygenation data from all
admission days were analysed in a subset of 3,322 patients in
5 ICUs.
Results Mean PaO
2
and FiO
2
in the first 24 h after ICU
admission were 13.2 kPa (standard deviation (SD) 6.5) and
50% (SD 20%) respectively. Mean PaO
2
and FiO
2
from all
admission days were 12.4 kPa (SD 5.5) and 53% (SD 18).
Focusing on oxygenation in the first 24 h of admission, in-
hospital mortality was shown to be linearly related to FiO
2
value
and had a U-shaped relationship with PaO
2
(both lower and
higher PaO
2
values were associated with a higher mortality),
independent of each other and of Simplified Acute Physiology
Score (SAPS) II, age, admission type, reduced Glasgow Coma
Scale (GCS) score, and individual ICU. Focusing on the entire
ICU stay, in-hospital mortality was independently associated
with mean FiO
2
during ICU stay and with the lower two quintiles
of mean PaO
2
value during ICU stay.
Conclusions Actually achieved PaO
2
values in ICU patients in
The Netherlands are higher than generally recommended in the
literature. High FiO
2
, and both low PaO
2
and high PaO
2
in the
first 24 h after admission are independently associated with in-
hospital mortality in ICU patients. Future research should study
whether this association is causal or merely a reflection of
differences in severity of illness insufficiently corrected for in the
multivariate analysis.
Introduction
It is generally acknowledged that mechanical ventilation may
cause or exacerbate lung damage in critically ill patients with
acute lung injury (ALI) or acute respiratory distress syndrome
(ARDS). Many studies have examined the effects of different
settings of ventilation, such as low vs high tidal volumes, prone
positioning and high-frequency oscillation on outcome of
intensive care unit (ICU) patients [1]. Lung-protective mechan-
ical ventilation strategies in patients with ALI/ARDS, applying
lower tidal volumes and sufficient levels of positive end expira-
APACHE II: Acute Physiology and Chronic Health Evaluation II; FiO
2
: fraction of oxygen in the inspired air; MPM II: Mortality Prediction Model II; NICE:
National Intensive Care Evaluation; PaO
2
: partial pressure of oxygen; SAPS II: Simplified Acute Physiology Score II; SOFA: Sequential Organ Failure
Assessment.
Critical Care Vol 12 No 6 de Jonge et al.
Page 2 of 8
(page number not for citation purposes)
tory pressure (PEEP) [2,3], have been shown to improve out-
come.
The mode of mechanical ventilation and the oxygenation tar-
gets may influence the outcome for patients. Traditionally, arte-
rial oxygen concentration (measured as partial oxygen
pressure, PaO
2
) and oxygen saturation by pulse oximetry are
used as targets. Common recommendations for oxygenation
propose PaO
2
values to be between 7.3 and 10.6 kPa [2,4].
The deleterious effects of hypoxia are well known and physi-
cians may be mostly concerned about avoiding hypoxia and
give additional oxygen 'to be on the safe side'. Hyperoxia, how-
ever, is also to be avoided as oxygen may be toxic. First, it is
long known that high fraction of oxygen in inspired air (FiO
2
)
may be toxic for the lungs. In animals, prolonged hyperoxia
causes histopathological changes similar to those seen in
ARDS [5]. Baboons exposed to 100% oxygen demonstrated
a progressive reduction in forced vital capacity and functional
residual capacity [6] and proliferative epithelial changes and
interstitial fibrosis [7]. In healthy humans, exposure to 100%
oxygen may lead to atelectasis, impaired mucocilliary clear-
ance and tracheobronchitis, alveolar protein leakage and
enhanced expression of leukotrienes by alveolar macrophages
and increases in alveolar neutrophils [8]. Apart from its effects
on the lungs, oxygen may also lead to systemic toxicity. It has
been associated with an increase in vascular resistance and a
decrease in cardiac output [9]. Hyperoxia may result in the
generation of central nervous system, hepatic and pulmonary
free radicals. Cardiopulmonary resuscitation following cardiac
arrest in a canine model is associated with a worsened neuro-
logic outcome when performed in the presence of hyperoxia vs
normoxia [8,10].
The aim of the present study was to describe the present oxy-
genation targets applied in ICUs in The Netherlands, and to
determine whether outcome of ICU patients was associated
with differences in administered oxygen (FiO
2
) or achieved
arterial PaO
2
.
Materials and methods
Patient data
This study is based on retrospective analysis of all consecutive
patients admitted between 1 January 1999 and 30 June 2006
to the ICUs of 50 university, teaching and non-teaching hospi-
tals in The Netherlands who were on mechanical ventilation
within the first 24 h after ICU admission. Data were collected
as part of the Dutch National Intensive Care Evaluation (NICE)
registry. Within this registry data collection takes place in a
standardised manner according to strict definitions and is sub-
ject to stringent data quality checks, which has been shown to
result in a high quality of data [11]. The data have been
encrypted in a way that all patient identifying information, such
as name and patient identification number, has been removed.
In The Netherlands, there is no need to obtain consent to make
use of registries when patient identifying information is not
used. According to the Dutch Medical Research Involving
Human Subjects Act, there is no need for approval by ethical
committees [12]. The NICE initiative is officially registered
according to the Dutch Personal Data Protection Act.
The variables are used to calculate probabilities of death for
each patient using the Acute Physiology and Chronic Health
Evaluation (APACHE) II [13], the Simplified Acute Physiology
Score (SAPS) II [14], and the Mortality Probability Models
(MPM) II at admission and 24-h scoring systems [15]. In this
study the SAPS II was used for case mix adjustment as previ-
ous research has shown that this scoring system fits best to
the patient population of the NICE registry [16]. The database
contains 108 demographic, diagnostic and physiologic varia-
bles collected within the first 24 h of ICU admission and out-
come data on ICU and in-hospital mortality.
In analogy with the exclusion criteria commonly used in analy-
ses based on the SAPS II scoring system, patients admitted
after cardiac surgery, patients admitted with severe burns and
patients aged under 18 were excluded from the analyses. For
patients with multiple ICU admissions during a hospitalisation
period only the first ICU admission was used.
In the analyses focusing on oxygenation in the first 24 h of ICU
stay, information of all patients was used. For the analyses
related to oxygenation during the entire ICU stay a selection of
the patients was used, as only five of the ICUs participating in
the NICE registry provide information to the registry database
on the patient's condition on a daily basis using the Sequential
Organ Failure Assessment (SOFA) score [17]. For this analy-
sis only patients with a minimum length of ICU stay of 3 days
were included into the analyses. Mean PaO
2
and mean FiO
2
values were calculated based on the entire ICU stay.
If more than one blood gas analysis was available for a patient
during the first 24 h after ICU admission, PaO
2
, FiO
2
and par-
tial CO
2
(PaCO
2
) values were from the arterial sample with the
lowest PaO
2
/FiO
2
ratio. Likewise, oxygenation data in the
SOFA scores was based on samples with lowest PaO
2
/FiO
2
ratios in the particular 24 h period.
Statistical analyses
The relation between the oxygenation parameters and in-hos-
pital mortality was assessed using logistic regression analysis.
As PaO
2
and FiO
2
are both continuous variables, univariate
regression analyses using polynomial functions and spline
functions [18,19] were performed to investigate the relation
between each of these variables and in-hospital mortality. For
PaO
2
a model including PaO
2
as a natural spline with five
degrees of freedom turned out to result in the best fit. To
enhance interpretation of the results, in subsequent analyses
PaO
2
was categorised. As no standard cut-off points are in
use for PaO
2
, categorisation of PaO
2
values into five catego-
Available online />Page 3 of 8
(page number not for citation purposes)
ries was based on the distribution of the data, using quintiles
as cut-off values between categories. For FiO
2
inclusion into
the model in a linear fashion showed to be optimal fit.
Multivariable logistic regression analyses were performed
both for the first 24 h of ICU stay and for the entire ICU stay.
Potential confounders in the association of oxygenation with
hospital mortality (age, SAPS II, Glasgow Coma Scale (GCS)
score below 15 and admission type) were included into the
models. Also a specific variable denoting the 'hospital' was
included into these models to correct for potential differences
in overall in-hospital mortality between the five hospitals. In the
model focusing on the entire ICU stay, the PaO
2
/FiO
2
ratio
during the first 24 h of admission was added as additional con-
founder. In the modelling process the presence of multicoline-
arity between the oxygenation parameters was verified based
on the standard errors of the parameters in the model.
The Standardised Mortality Ratio (SMR) was calculated as the
ratio of the number of observed deaths to the number of
deaths expected according to the SAPS II model [13].
In all analyses a p value of 0.05 was considered to represent
a statistically significant difference. The analyses were per-
formed using SPSS version 14.0 (SPSS Inc., Chicago, IL,
USA) and S-plus version 7.0 (Insightful Corp., Seattle, WA,
USA).
Results
Analysis of data from first 24 h after admission
In total, 36,307 patients from 50 ICUs were included in the
analysis. All patients were treated with mechanical ventilation
within the first 24 h after ICU admission. Data on the severity
of illness, reason for admission and referring specialty are
given in Table 1. Mean PaO
2
was 13.2 kPa (standard deviation
(SD) 6.5). Mean FiO
2
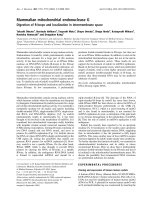
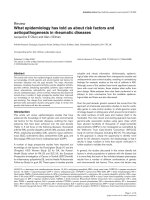
was 50% (SD 20). Regression analysis
using PaO
2
as a continuous variable showed that with increas-
ing PaO
2
the average in-hospital mortality first decreased and
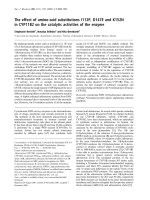
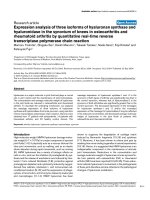
subsequently started to rise again (Figure 1). Figure 2 denotes
the relation between PaO
2
and in-hospital mortality when cor-
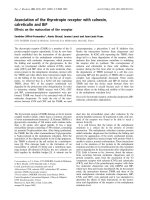
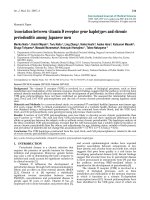
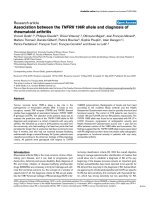
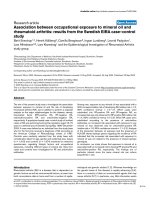
recting for SAPS II (by means of the SMRs). Figures 3 and 4
show the association between SMR and FiO
2
or PaO
2
/FiO
2
ratio respectively. Multivariate regression analysis indicated
that the U-shaped relation between PaO
2
and mortality (mod-
elled using a spline function) remained significant after correc-
tion for age, admission type, GCS score and severity of illness
measured with the SAPS II. Multicolinearity was not found to
be present for FiO
2
and PaO
2
values. Table 2 presents the
odds ratios for FiO
2
and the PaO
2
quintiles in a multivariate
regression model, indicating that in-hospital mortality was
associated with FiO
2
and PaO
2
values.
Analysis of data from all ICU admission days
For the analysis regarding entire ICU stay 3,322 patients from
5 ICUs were included. Characteristics of these patients are
given in Table 1. Mean PaO
2
during ICU stay was 12.4 kPa
(SD 5.5). Mean FiO
2
during ICU stay was 53% (SD 18). The
results of the multivariate analysis are shown in Table 3. Mean
FiO
2
value and a mean PaO
2
value lower than 10.6 kPa were
associated with a higher mortality. This association was inde-
pendent of the potential confounders age, SAPS II, abnormal
GCS score, PaO
2
/FiO
2
ratio at admission, admission type and
hospital.
Discussion
We found that administration of high FiO
2
values in ICU
patients was associated with increased in-hospital mortality.
This association was found for FiO
2
values in the first 24 h
after admission and also for mean FiO
2
during all admission
days. The increased risk in patients with high FiO
2
remained
after correcting for SAPS II, admission type, reduced GCS
score and pulmonary dysfunction measured as PaO
2
/FiO
2
ratio. This suggests that the administration of oxygen itself
could be deleterious, and that the association between high
FiO
2
and mortality cannot be explained by the confounding
issue that highest FiO
2
levels are administered in patients with
severe pulmonary dysfunction.
Our observations are in accordance with prior experimental
studies showing the potential toxicity of high fractions of
inspired oxygen [5]. Administration of supplemental oxygen
can cause lung damage. This risk is especially high in prema-
turely born infants, probably attributable to inadequate host
defences, underdeveloped lungs and immature antioxidant
systems [20]. Exposure to hyperoxia leads to diffuse pulmo-
nary damage characterised by an extensive inflammatory
response and destruction of the alveolar-capillary barrier lead-
ing to oedema, impaired gas exchange and respiratory failure
[21]. Mouse lungs exposed to > 90% oxygen for 48 h were
more susceptible to ventilator-induced lung injury than those
exposed to room air [22]. Hyperoxia also aggravates pulmo-
nary injury following artificial ventilation in rats using high tidal
volumes [23]. Furthermore, hyperoxia impairs the innate
immune response by decreased macrophage function,
impaired bacterial killing and increased susceptibility to pneu-
monia in a Klebsiella pneumoniae model [24]. Lung injury is
likely to be initiated when the rates of generation of reactive
oxygen species (ROS) are increased beyond the capacities of
the antioxidant defences, such as the enzymes glutathione,
superoxide dismutase and catalase. Mitochondrial mediated
cell injury by ROS has been identified as a critical event in both
apoptotic and necrotic forms of cell death in hyperoxia [25].
Another organ that may be injured by hyperoxia is the kidney.
Hyperoxic reperfusion exacerbates renal dysfunction and his-
topathologic injury after 30 min of complete normothermic
ischaemia in rabbits. This hyperoxia associated dysfunction
was prevented by the administration of the radical scavenger
allopurinol [26], suggesting that oxidative injury by ROS plays
a role in post-ischaemic renal failure.
Critical Care Vol 12 No 6 de Jonge et al.
Page 4 of 8
(page number not for citation purposes)
Several studies focused on the role of high reperfusion oxygen
tensions following cardiac arrest and resuscitation. In a canine
model of 10 min of cardiac arrest, resuscitation with 21% vs
100% inspired O
2
resulted in lower levels of oxidised brain lip-
ids and improved neurological outcome [27]. In another study
using the same canine model, it was shown that resuscitation
with 100% O
2
resulted in impaired hippocampal neuronal
metabolism [28]. Proposed pathogenetic mechanisms of
hyperoxia induced reperfusion injury of the brain include
increased production of ROS, a high ratio of oxidised over
reduced glutathione [29] and increased nitric oxide produc-
tion by endothelium and neuron derived nitric oxide synthase
[30].
Many studies investigated the use of 100% vs 21% oxygen for
resuscitation in depressed newborn infants (that is, infants
with apnoea or relative bradycardia at birth). A systematic
review and meta-analysis of 10 studies reported a significant
reduction in the risk of neonatal mortality and a trend towards
a reduction in severe encephalopathy in newborns resusci-
tated with 21% O
2
. The reduction in mortality was also found
in a subgroup analysis only including strictly randomised con-
trolled trials and in a subgroup of studies enrolled in European
countries with a lower risk of mortality than in less developed
countries [31].
Human clinical studies evaluating the effects of hyperoxia in
critically ill adult patients are lacking. The effects of hyperoxia
in non-ICU settings are not clear. A reduction in surgical site
Table 1
Characteristics of patients
Analysis of data from first 24 h after admission Analysis of data from all admission days
No of patients 36,307 3,322
Male (%) 60.1 60.3
Age in years
a
62.5 ± 16.1 62.4 ± 15.9
SAPS II
a
42.7 ± 18.4 47.6 ± 15.7
SAPS II predicted mortality
a
0.34 ± 0.28 0.42 ± 0.27
GCS score below 15 (%) 33.1 33.6
PaO
2
at admission (kPa)
a
13.2 ± 6.5
b
12.5 ± 5.5
c
FiO
2
(%)
a
50.4 ± 19.9
b
53.1 ± 18.7
c
PaO
2
/FiO
2
ratio (kPa)
a
29.1 ± 15.0
b
24.6 ± 12.6
c
Admission type (%):
Medical 48.4 61.0
Unplanned surgery 22.6 23.0
Planned surgery 28.9 16.0
Referring specialty (%):
Internal medicine 16.4 16.7
Cardiology 10.8 17.9
Pulmonary disease 7.4 10.4
Neurology 5.7 6.4
Surgery 33.2 30.6
Cardiothoracic surgery 6.4 1.2
Neurosurgery 6.9 6.1
Other 13.1 10.7
ICU mortality 23.0 21.0
In-hospital mortality (%) 31.1 32.7
a
Mean ± standard deviation (SD);
b
PaO
2
, FiO
2
and PaO
2
/FiO
2
ratio from sample with lowest PaO
2
/FiO
2
ratio within 24 h after admission;
c
mean
value of all admission days. Per day PaO
2
, FiO
2
and PaO
2
/FiO
2
ratio was taken from sample with lowest PaO
2
/FiO
2
ratio.
GCS, Glasgow Coma Scale; FiO
2
, fraction of oxygen in inspired air; ICU, intensive care unit; PaO
2
, partial oxygen pressure; SAPS II, Simplified
Acute Physiology Score II.
Available online />Page 5 of 8
(page number not for citation purposes)
infections by the use of hyperoxia has been reported by one
study group [32], while others reported more surgical site
infections in patients treated with hyperoxia [33].
An alternative explanation for the association between oxygen-
ation and mortality in ICU patients could be that common cri-
teria for weaning from mechanical ventilation are based on
FiO
2
and PEEP levels. High FiO
2
and PEEP, both leading to
high PaO
2
values, may delay weaning from mechanical ventila-
tion, thus negatively influencing outcome in ICU patients. Also,
we cannot exclude that high PaO
2
values were achieved by
more invasive ventilation strategies, potentially being more
injurious to the patients.
Interestingly, apart from FiO
2
values, there was also a U-
shaped association between achieved arterial oxygen tension
(PaO
2
) during the first 24 h after ICU admission and mortality
with higher mortality in patients with either a very low or high
PaO
2
. That mortality is higher in patients with very low PaO
2
is
not unexpected and possibly related to ischaemia or to selec-
tion of the sickest patients. However, mortality was also higher
in patients with highest PaO
2
values, suggesting the possibility
of systemic oxygen toxicity.
Table 2
Adjusted odds ratios for partial oxygen pressure (PaO
2
) and fraction of oxygen in inspired air (FiO
2
) resulting from a multivariate
regression analysis on data from the first 24 h after ICU admission
Covariate Odds ratio 95% Confidence interval
PaO
2
in kPa:
< 8.9 (n = 6,937) 1.12 1.03 to 1.21
8.9 to 10.6 (reference category) (n = 7,466) 1
10.6 to 12.6 (n = 6,430) 1.11 1.02 to 1.21
12.6 to 16.4 (n = 7,278) 1.08 1.00 to 1.18
≥ 16.4 (n = 8,196) 1.23 1.13 to 1.34
FiO
2
(per 10%) 1.12 1.10 to 1.13
Odds ratio after adjustment for the following potential confounders: age, SAPS II, GCS score below 15, admission type, individual hospital. The
equation of the model is: Logit(p) = -5.419 + 0.059 × age (per 5 years) + 0.066 × SAPS II + 0.070 × I(GCS < 15) + 0.221 × I(admission type
= urgent) + 0.453 × I(admission type = medical) + β
hosp
+ 0.105 × FiO
2
(per 10%) + 0.109 × I(PaO
2
< 67) + 0.109 × I(80 ≤ PaO
2
< 95) +0.079
× I(95 ≤ PaO
2
< 123) +0.206 × I(PaO
2
≥ 123) Probability of in-hospital death = e
(logit)
/(1+e
(logit)
). Median β
hos
for individual hospitals was -0.12
(IQR -0.43 to 0.05).
GCS, Glasgow Coma Scale; ICU, intensive care unit; IQR, interquartile range; SAPS II, Simplified Acute Physiology Score II.
Figure 1
In-hospital mortality by partial oxygen pressure (PaO
2
) (kPa)In-hospital mortality by partial oxygen pressure (PaO
2
) (kPa). Val-
ues were taken from blood gas analysis with lowest PaO
2
/fraction of
oxygen in inspired air (FiO
2
) ratio in the first 24 h after intensive care
unit (ICU) admission. The sizes of the circles represent the number of
patients with the same PaO
2
value. The curve represents the predicted
mortality using the logistic regression equation in which the PaO
2
value
was incorporated using a spline function.
Figure 2
Standardised mortality ratio (SMR) by partial oxygen pressure (PaO
2
) (kPa)Standardised mortality ratio (SMR) by partial oxygen pressure
(PaO
2
) (kPa). PaO
2
values were taken from blood gas analysis with
lowest PaO
2
/fraction of oxygen in inspired air (FiO
2
) ratio in the first 24
h after intensive care unit (ICU) admission. PaO
2
values are catego-
rised as quintiles. Error bars represent 95% confidence intervals.
Critical Care Vol 12 No 6 de Jonge et al.
Page 6 of 8
(page number not for citation purposes)
In our analysis of mean oxygenation during all admission days,
we again found a linear association between mortality and
FiO
2
values. Low PaO
2
s were also associated with higher mor-
tality but high PaO
2
s were not. The shape of the association
between PaO
2
and mortality was hard to assess. In our data a
linear association appeared to best fit the data (data not
shown). The number of patients included in this analysis was
only 3,322. Only 2% of the patients had a mean PaO
2
higher
than 20.0 kPa. Thus, the power of our study may have been
too low to detect an association between high mean PaO
2
val-
ues during the ICU stay and increased mortality.
There are limitations to this study. Most importantly, it was a
retrospective observational study and the association
between mortality and oxygenation is not necessarily causal.
Although the association appeared to be independent of a
number of potential confounding covariates, we cannot
exclude that, despite our efforts, there are still differences in
case mix associated with oxygenation that are not taken into
account in our multivariate analyses. It is possible that physi-
cians recognised some marker of severity that was not repre-
sented in our attempts to adjust for severity, and that they
purposefully gave higher concentrations of oxygen to achieve
higher levels of PaO
2
in these high-risk patients.
Figure 3
Standardised mortality ratio (SMR) by fraction of oxygen in inspired air (FiO
2
)Standardised mortality ratio (SMR) by fraction of oxygen in
inspired air (FiO
2
). FiO
2
values were taken from blood gas analysis
with lowest partial oxygen pressure (PaO
2
)/FiO
2
ratio in the first 24 h
after intensive care unit (ICU) admission FiO
2
values are categorised as
quintiles. Error bars represent 95% confidence intervals.
Figure 4
Standardised mortality ratio (SMR) by lowest partial oxygen pressure (PaO
2
)/fraction of oxygen in inspired air (FiO
2
) ratio (kPa) in the first 24 h after intensive care unit (ICU) admissionStandardised mortality ratio (SMR) by lowest partial oxygen pres-
sure (PaO
2
)/fraction of oxygen in inspired air (FiO
2
) ratio (kPa) in
the first 24 h after intensive care unit (ICU) admission. PaO
2
/FiO
2
ratio values are categorised as quintiles. Error bars represent 95% con-
fidence intervals.
Table 3
Adjusted odds ratios for mean partial oxygen pressure (PaO
2
) value and mean fraction of oxygen in inspired air (FiO
2
) during ICU
stay resulting from a multivariate regression analysis on data from the entire ICU stay
Covariate Odds ratio 95% Confidence interval
Mean PaO
2
in kPa:
< 8.9 (n = 402) 1.63 1.16 to 2.3
8.9 to 10.6 (n = 871) 1.51 1.18 to 1.96
10.6 to 12.6 (n = 970) 1.25 0.99 to 1.57
12.6 to 16.4 (reference category) (n = 841) 1
> 16.4 (n = 238) 1.04 0.64 to 1.68
Mean FiO
2
(per 10%) 1.63 1.47 to 1.81
Odds ratio after adjustment for the following potential confounders: age, SAPS II, GCS score below 15, admission type, PaO
2
/FiO
2
ratio at
admission, and hospital. The equation of the eventual model is: Logit(p) = -7.060 + 0.090 × age (per 5 years) + 0.049 × SAPS II + 0.054 ×
I(GCS < 15) + 0.015 × I(admission type = urgent) + 0.161 × I(admission type = medical) + 0.004 × PaO
2
/FiO
2
– 1.114 × I(hospital = 2) –
0.060 × I(hospital = 3) – 0.285 × I(hospital = 4) – 0.618 × I(hospital = 5) + 0.488 × mean FiO
2
(per 10%) + 0.492 × I(mean PaO
2
< 67) +
0.417 × I(67 ≤ PaO
2
< 80) + 0.221 × I(80 ≤ PaO
2
< 95) + 0.038 × I(PaO
2
≥ 123). Probability of in-hospital death = e
(logit)
/(1+e
(logit)
).
GCS, Glasgow Coma Scale; ICU, intensive care unit; SAPS II, Simplified Acute Physiology Score II.
Available online />Page 7 of 8
(page number not for citation purposes)
The three potential confounders that we corrected for (age,
reduced GCS score, and admission type) are part of the
SAPS II that was also included as covariate in the multivariate
analysis. We have repeated the analyses without these three
variables, adjusting for SAPS II only. This yielded similar
results for the association between in-hospital mortality and
PaO
2
and FiO
2
respectively.
We corrected for pulmonary dysfunction by including PaO
2
/
FiO
2
ratio at admission in the multivariate analysis of data from
all admission days. PaO
2
/FiO
2
ratio was not included in the
analysis of data from the first 24 h after ICU admission,
because including PaO
2
, FiO
2
and PaO
2
/FiO
2
ratio, all from
the same arterial blood sample, would introduce problems by
colinearity of the data. In this population, however, we per-
formed a separate multivariate analysis substituting PaO
2
/
FiO
2
ratio for PaO
2
values. Again, FiO
2
appeared to be a pre-
dictor of mortality, also independent of PaO
2
/FiO
2
ratio (OR
1.15, 95% CI 1.14 to 1.17, model not shown). PaO
2
/FiO
2
ratio is not only influenced by pulmonary dysfunction, but also
by ventilator settings, such as PEEP levels. As PEEP was not
part of the NICE data collection, we could not include this pos-
sible confounder in our analysis. Prospective, controlled trials
are necessary to show a causal relationship between high
FiO
2
s and mortality.
As the association between PaO
2
and mortality was U-
shaped, we categorised PaO
2
values for the multivariate anal-
ysis using quintiles as categories (as no standard categorisa-
tion is available). The boundaries of quintiles are chosen
arbitrarily and may not be the optimal cut-off levels to discrim-
inate between patients with low and high risk of mortality.
Therefore, we repeated the same multivariate analysis (model
not shown) on data from the first 24 h after ICU admission
using PaO
2
values categorised as deciles and found similar
results.
Another finding from our study is the fact that in most patients
the achieved PaO
2
values are higher than the targets com-
monly recommended [2,4]. Although oxygen toxicity is a well
known entity [34], FiO
2
s up to 0.5 are commonly considered
'safe' by physicians [5]. It appears that physicians are more
concerned about avoiding hypoxia and ischaemia than about
the risks of hyperoxia. In The Netherlands, no formal guidelines
for oxygenation targets are available. This may be related to the
fact that the influence of oxygenation targets has never been
studied making it impossible to provide evidence-based rec-
ommendations. Based on other observational studies, it may
well be that also in other countries actual PaO
2
s in ICU
patients are higher than recommended [35,36]
Conclusion
High fractions of oxygen in the inspired air and high PaO
2
val-
ues are associated with increased mortality in ICU patients.
Actually achieved PaO
2
values in Dutch ICU patients are
higher than the PaO
2
targets in some recent international rec-
ommendations. Prospective interventional studies are neces-
sary to find out whether the association between outcome and
oxygenation is causal and to provide evidence-based guide-
lines on oxygenation targets.
Competing interests
During the period from 2002 to 2004 LP received an unre-
stricted educational grant from Eli Lilly Netherlands B.V. The
study described in this manuscript was not conducted under
the grant, and Eli Lilly Netherlands B.V. has not been involved
in any part of the present study. All other authors declare that
they have no competing interests.
Authors' contributions
EdJ designed the study and drafted the manuscript. LP and
NdK were involved in the set-up of the study, performed the
statistical analyses and helped in interpreting the results and
writing the manuscript. PK was involved in the set-up of the
study, interpreting the results and writing the manuscript. JJ,
DdL, PvdV, RB, RdW and RW were involved in interpreting
the results and writing the manuscript. All authors read and
approved the final manuscript.
References
1. Fan E, Needham DM, Stewart TE: Ventilatory management of
acute lung injury and acute respiratory distress syndrome.
JAMA 2005, 294:2889-2896.
2. The Acute Respiratory Distress Syndrome Network: Ventilation
with lower tidal volumes as compared with traditional tidal vol-
umes for acute lung injury and the acute respiratory distress
syndrome. N Engl J Med 2000, 342:1301-1308.
3. Amato MB, Barbas CS, Medeiros DM, Magaldi RB, Schettino GP,
Lorenzi-Filho G, Kairalla RA, Deheinzelin D, Munoz C, Oliveira R,
Takagaki TY, Carvalho CR: Effect of a protective-ventilation
strategy on mortality in the acute respiratory distress syn-
drome. N Engl J Med 1998, 338:347-354.
4. Wheeler AP, Bernard GR: Acute lung injury and the acute res-
piratory distress syndrome: a clinical review. Lancet 2007,
369:1553-1564.
Key messages
• The weaning rate of catecholamines is usually chosen
empirically by intensivists.
• Actually achieved PaO
2
values in Dutch ICU patients
are higher than the PaO
2
targets given in recent interna-
tional recommendations.
• High fractions of oxygen in the inspired air are associ-
ated with increased mortality in ICU patients on
mechanical ventilation.
• Both low and high PaO
2
values in the first 24 hours
after ICU admission were associated with increased
mortality.
• Future interventional studies are required to find out
whether these associations between oxygenation and
outcome are causal or due to other confounding issues.
Critical Care Vol 12 No 6 de Jonge et al.
Page 8 of 8
(page number not for citation purposes)
5. Altemeier WA, Sinclair SE: Hyperoxia in the intensive care unit:
why more is not always better. Curr Opin Crit Care 2007,
13:73-78.
6. Fracica PJ, Knapp MJ, Piantadosi CA, Takeda K, Fulkerson WJ,
Coleman RE, Wolfe WG, Crapo JD: Responses of baboons to
prolonged hyperoxia: physiology and qualitative pathology. J
Appl Physiol 1991, 71:2352-2362.
7. Crapo JD, Hayatdavoudi G, Knapp MJ, Fracica PJ, Wolfe WG,
Piantadosi CA: Progressive alveolar septal injury in primates
exposed to 60% oxygen for 14 days. Am J Physiol 1994,
267:L797-L806.
8. Kavanagh BP: Goals and concerns for oxygenation in acute
respiratory distress syndrome. Curr Opin Crit Care 1998,
4:16-20.
9. Lodato RF: Decreased O
2
consumption and cardiac output dur-
ing normobaric hyperoxia in conscious dogs. J Appl Physiol
1989, 67:1551-1559.
10. Zwemer CF, Whitesall SE, D'Alecy LG: Hypoxic cardiopulmo-
nary-cerebral resuscitation fails to improve neurological out-
come following cardiac arrest in dogs. Resuscitation 1995,
29:225-236.
11. Arts D, de Keizer NF, Scheffer GJ, de Jonge E: Quality of data col-
lected for severity of illness scores in the Dutch National Inten-
sive Care Evaluation (NICE) registry. Intensive Care Med 2002,
28:656-659.
12. The Central Committee on Research Involving Human Sub-
jects (CCMO) [
]
13. Knaus WA, Draper EA, Wagner DP, Zimmerman JE: APACHE II: a
severity of disease classification system. Crit Care Med 1985,
13:818-829.
14. Le Gall JR, Lemeshow S, Saulnier F: A new Simplified Acute
Physiology Score (SAPS II) based on a European/North Amer-
ican multicenter study. JAMA 1993, 270:2957-2963.
15. Lemeshow S, Teres D, Klar J, Avrunin JS, Gehlbach SH, Rapoport
J: Mortality Probability Models (MPM II) based on an interna-
tional cohort of intensive care unit patients. JAMA 1993,
270:2478-2486.
16. Peek N, Arts DG, Bosman RJ, Voort P van der, de Keizer NF:
External validation of prognostic models for critically ill
patients required substantial sample sizes. J Clin Epidemiol
2007, 60:491-501.
17. Vincent JL, de MA, Cantraine F, Moreno R, Takala J, Suter PM,
Sprung CL, Colardyn F, Blecher S: Use of the SOFA score to
assess the incidence of organ dysfunction/failure in intensive
care units: results of a multicenter, prospective study. Working
group on "sepsis-related problems" of the European Society
of Intensive Care Medicine. Crit Care Med 1998,
26:1793-1800.
18. Smith PL: Splines as a useful and convenient statistical tool.
American Statistician 1979, 33:57-62.
19. Harrell FE: Regression Modeling Strategies New York, NY:
Springer; 2001.
20. O'Donovan DJ, Fernandes CJ: Mitochondrial glutathione and
oxidative stress: implications for pulmonary oxygen toxicity in
premature infants. Mol Genet Metab 2000, 71:352-358.
21. Crapo JD, Barry BE, Foscue HA, Shelburne J: Structural and bio-
chemical changes in rat lungs occurring during exposures to
lethal and adaptive doses of oxygen. Am Rev Respir Dis 1980,
122:123-143.
22. Bailey TC, Martin EL, Zhao L, Veldhuizen RA: High oxygen con-
centrations predispose mouse lungs to the deleterious effects
of high stretch ventilation. J Appl Physiol 2003, 94:975-982.
23. Quinn DA, Moufarrej RK, Volokhov A, Hales CA: Interactions of
lung stretch, hyperoxia, and MIP-2 production in ventilator-
induced lung injury. J Appl Physiol 2002, 93:517-525.
24. Baleeiro CE, Wilcoxen SE, Morris SB, Standiford TJ, Paine R III:
Sublethal hyperoxia impairs pulmonary innate immunity. J
Immunol
2003, 171:955-963.
25. Wallace KB, Eells JT, Madeira VM, Cortopassi G, Jones DP: Mito-
chondria-mediated cell injury. Symposium overview. Fundam
Appl Toxicol 1997, 38:23-37.
26. Zwemer CF, Shoemaker JL Jr, Hazard SW III, Davis RE, Bartoletti
AG, Phillips CL: Hyperoxic reperfusion exacerbates pos-
tischemic renal dysfunction. Surgery 2000, 128:815-821.
27. Liu Y, Rosenthal RE, Haywood Y, Miljkovic-Lolic M, Vanderhoek JY,
Fiskum G: Normoxic ventilation after cardiac arrest reduces
oxidation of brain lipids and improves neurological outcome.
Stroke 1998, 29:1679-1686.
28. Richards EM, Fiskum G, Rosenthal RE, Hopkins I, McKenna MC:
Hyperoxic reperfusion after global ischemia decreases hip-
pocampal energy metabolism. Stroke 2007, 38:1578-1584.
29. Gelfand SL, Vento M, Sastre J, Lust WD, Smith MA, Perry G,
Walsh M, Martin R: A new model of oxidative stress in rat pups.
Neonatology 2008, 94:293-299.
30. Allen BW, Demchenko IT, Piantadosi CA: Two faces of nitric
oxide: implications for cellular mechanisms of oxygen toxicity.
J Appl Physiol 2008 in press.
31. Saugstad OD, Ramji S, Soll RF, Vento M: Resuscitation of new-
born infants with 21% or 100% oxygen: an updated systematic
review and meta-analysis. Neonatology 2008, 94:176-182.
32. Greif R, Akca O, Horn EP, Kurz A, Sessler DI: Supplemental peri-
operative oxygen to reduce the incidence of surgical-wound
infection. Outcomes Research Group. N Engl J Med 2000,
342:161-167.
33. Pryor KO, Fahey TJ III, Lien CA, Goldstein PA: Surgical site infec-
tion and the routine use of perioperative hyperoxia in a gen-
eral surgical population: a randomized controlled trial. JAMA
2004, 291:79-87.
34. Mao C, Wong DT, Slutsky AS, Kavanagh BP: A quantitative
assessment of how Canadian intensivists believe they utilize
oxygen in the intensive care unit. Crit Care Med 1999,
27:2806-2811.
35. Young MP, Manning HL, Wilson DL, Mette SA, Riker RR, Leiter JC,
Liu SK, Bates JT, Parsons PE: Ventilation of patients with acute
lung injury and acute respiratory distress syndrome: has new
evidence changed clinical practice? Crit Care Med 2004,
32:
1260-1265.
36. Kalhan R, Mikkelsen M, Dedhiya P, Christie J, Gaughan C, Lanken
PN, Finkel B, Gallop R, Fuchs BD: Underuse of lung protective
ventilation: analysis of potential factors to explain physician
behavior. Crit Care Med 2006, 34:300-306.