150 Practice ECGs: Interpretation and Review - Part 3 docx
Bạn đang xem bản rút gọn của tài liệu. Xem và tải ngay bản đầy đủ của tài liệu tại đây (348.05 KB, 27 trang )
50 150PracticeECGs:InterpretationandReview
ECGChangeswithSyndromesofMyocardialIschemia
Anginapectoris STdepression Coincidental Stenosedartery,butwithsome
withchestpain antegradeflow;O
2
demandexceeds
supply;subendocardialischemia
Coronaryartery STelevation Coincidentalwith Spasmmayoccurinanormalartery
spasm(angina chestpain oratthesiteofplaque;usuallytotal
pectoris) occlusion;transmuralischemia,
temporary
Non-QMI STdepression Duringpainbut Stenosedartery,butwithsome
Twaveinversion maybe antegradeflow;subendocardial
permanent ischemia,thennecrosis
QwaveMI STelevation Coincidental Totalocclusion,transmuralischemia,
withpain thennecrosis
Twaveinversion Minutestohours
later,whileST
elevationpersists
Qwave Minutestohours
afteronsetofMI;
permanent
Coronaryarteryanatomy.Thecircumflexandrightcoronaryarteriescircletheheartinthe
AVgroove;branchesofthecircumflexleavethegroovetosupplythelateralwall.Themajorrightcoronary
branch(theposteriordescendingartery)suppliestheinferiorwall.Theanteriordescendingarteryis
locatedjustovertheinterventricularseptum(the
interventricular groove);itsendsperforatingbranchesinto
theseptum,anddiagonalbranchestotheanteriorLVsurface.ThespatialorientationoftheECGleads
allowsgroupsofleadstoreflecteventsinagivenregionoftheheart(seeFig1.2aswell).
MorphologicChangesinP,QRS,ST,andT 51
Patternsofmyocardialischemia.Theepicardiumistheoutsidesurfaceoftheheart,andthe
endocardiumisthesurfacenexttotheventricularcavity.Thecoronaryarteriesarelocatedontheepicardial
surface.Subendocardial(
nontransmural)ischemiacausesSTsegmentdepression.Ifischemiapersistsand
thereismyocardialinjury,theremaybeTwaveinversion(apatternnowcallednon-STelevationMI,but
alsoreferredtoassubendocardialornontransmuralornon-Qwaveinfarction).Transmuralischemiais
causedbytotalocclusionoftheartery.Duringacuteischemia,thereisSTsegmentelevation.Resolutionof
spasmordissolutionofthrombusmayopentheoccludedarterybeforethereisinjury.Inthiscase,theepi
-
sodeofischemiarepresentsanginapectoris.Ifocclusionand,therefore,ischemiapersistsandthereismyo
-
cardialinjury,thepatterniscalledSTelevationMI(alsoreferredtoastransmuralorQwaveinfarction).
and negative forces are equal, canceling each other with a net sum of zero voltage. At
times it is difficult to identify the baseline. The segment just before the P wave is gen-
erally accepted as the baseline. Note that the PR segment or ST segment can shift up or
down with disease.
A shift in the ST segment from the baseline may indicate ischemia. ST depression
occurs with subendocardial ischemia (Fig 2.9). Cardiac catheterization during subendocar-
dial ischemia usually reveals that the coronary artery supplying the ischemic zone is
tightly stenosed but not (totally) occluded. There is a mismatch between blood supply
52 150PracticeECGs:InterpretationandReview
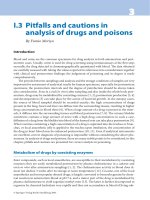
PositivestressECG.Atrest,thepatient’sECGwasnormal.Whilewalkingonthetreadmill,
shedevelopedSTsegmentdepression(inferiorandlateralleads).Within3minutes,sheexperiencedchest
heaviness,andexercisewasstopped.
Angina occurs when there is a mismatch between myocardial oxygen supply and
demand. The initiating event in chronic stable angina is increased demand with
exercise or stress. Reducing demand with rest, nitrates, or beta blockers provides
relief. The coronary artery stenosis does not change and is stable. Thus, the angina
threshold—the increase in cardiac work that provokes angina—is the same from
week to week.
During ischemia, the ST segment is depressed well below baseline (see Fig 2.10). In
addition, the ST segment has a check mark or hockey-stick appearance, and the
segment is either horizontal or downsloping (Fig 2.11). This is the typical shape of ST
segments depressed by subendocardial ischemia. A depressed but up-sloping ST
segment is not as specific for ischemia (see Fig 2.11). In this case, the J point—the
junction between the QRS complex and the beginning of the ST segment—is depressed
below the baseline, but the ST segment moves rapidly upward.
Poor specificity is a fundamental problem with the diagnosis of subendocardial isch-
emia based on ST depression. Other conditions may cause ST depression including LVH,
and demand across the stenosed artery, and the region of myocardium farthest from
the epicardial artery—the subendocardium—is the most ischemic.
The ECG in Fig 2.10 is a good example. It was recorded during a treadmill stress test
from a middle-aged woman with chronic, stable angina pectoris. At rest, she had no ST
segment depression. During exercise, heart rate and systemic blood pressure rose, both
in direct proportion to the increase in cardiac work. Increased cardiac work means an
increase in myocardial oxygen demand. To meet the increase in demand, her coronary
artery blood flow increased. But the coronary artery stenosis placed a limit on how
much the arterial blood flow could increase. When cardiac work load exceeded that
limit, she developed ST segment depression and angina pectoris.
MorphologicChangesinP,QRS,ST,andT 53
digitalis, and hypokalemia. It is a common finding in older patients both with and
without a history of ischemic heart disease. ST depression on a routine ECG does not
necessarily indicate the presence of coronary artery stenosis, and in the absence of any
clinical history you should consider it a nonspecific finding. Associated T wave flatten-
ing and inversion are common; their presence does not change the fact that the find-
ings are nonspecific.
Nonspecific ST-T wave changes (NSSTTWCs) is a frequently applied ECG interpretation.
Do not be frustrated by this or consider it a cop-out; instead, accept it as the interpreta-
tion of a reader who understands the limitations of the ECG.
ST depression may become diagnostic when it is placed in clinical context. The stress
test is a good example (see Fig 2.10). An ECG obtained during chest pain and that can be
compared with a previous tracing is another. For a patient with chest pain of uncertain etiol-
ogy, finding ST depression during pain helps make the diagnosis of angina pectoris. The
absence of ST segment changes with pain makes coronary disease less likely.
T Wave Inversion
T wave inversion may be observed during acute ischemia (i.e., during chest pain), and
it is often associated with ST segment changes, either depression or elevation. T inver-
sion that develops during chest pain, like ST depression, is evidence of a cardiac
etiology. It may also be a permanent finding after pain has resolved. In that case, T
inversion may indicate injury. Deep, symmetrical T inversion is the ECG finding of
non–Q wave infarction, also called nontransmural or subendocardial infarction, and,
more recently, non–ST elevation infarction (Fig 2.12).
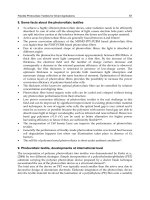
STsegmentdepression.TheJpointisthejunctionoftheQRScomplexandthebeginning
oftheSTsegment.DownslopingandhorizontalSTdepressionaremorespecificforsubendocardialisch
-
emiathanisJpointdepressionwithupslopingST’s(middletracing).
54 150PracticeECGs:InterpretationandReview
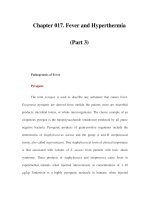
Anterior,non-STelevationMI.Thismaybecalledsubendocardial,nontransmural,ornon-Q
MI.ThereisdeepandsymmetricalTwaveinversionintheanteriorleads.TheQTintervalislong;thisisnot
acriterionfornon-QMI,butmayaccompanyit.
The traditional distinction between subendocardial and transmural infarction
provides a tidy explanation but is not completely accurate (Fig 2.9). Recent
studies indicate that the main difference between the two is the size of the MI
and not necessarily the location of injury within the myocardium. The non-Q
wave MI is smaller. Less injury is good, as myocardium is irreplaceable. On the
other hand, the smaller MI may be “incomplete.” Early angiography usually
shows a tightly stenosed artery with unstable appearing plaque surface, indicating
a risk of occlusion and “completion” of the MI. Non-ST elevation MI is therefore
an indication for cardiac catheterization and possible revascularization.
Let us backtrack a moment and be sure that we understand the sequence of events
with ischemia (see Table 2.3 and Fig 2.9). It is the direction of ST segment shift that dis-
tinguishes subendocardial from transmural ischemia. The combination of chest pain and
ST depression indicates ongoing, subendocardial ischemia. If pain is prolonged and there
is myocardial injury, T wave inversion develops and may be permanent. Deep and sym-
metrical T wave inversion is the non–Q wave infarct pattern, and ST depression may
resolve when the pain (active ischemia) is over. With non–Q wave infarction, injury is
limited to the subendocardium, not the full thickness of the ventricle (see Fig 2.9).
Cardiac catheterization during the acute phase of non–Q wave MI (during pain) shows
that the infarct artery is tightly stenosed but that there is still some antegrade flow.
Nonischemic cardiac conditions, including pericarditis and virtually any disease that
affects the myocardium, may cause T wave inversion. Children and young adults
without heart disease may have T inversion, the so-called juvenile pattern.
Intracranial bleeding may cause deep T wave inversion; look for this on Board
exams. The ECG recording in Figure 2.12 could be the result of intracranial hemor-
rhage. Pathologic studies have shown that most of these patients suffer subendocardial
myolysis at the time of the bleed—the T wave changes come from the heart, not the
brain. Sympathetic discharge at the onset of bleeding may be the mechanism.
MorphologicChangesinP,QRS,ST,andT 55
Note the basic differences between chronic stable angina and the acute coronary
syndromes including unstable angina, non-ST and ST elevation MI. With stable
angina, the lesion is fixed and angina is caused by an increase in oxygen demand.
With the acute coronary syndromes, the lesion is variable, and it is a drop in
supply that initiates chest pain. It often occurs at rest. In most cases this is due
to unstable plaque surface that has attracted platelets.
Nonischemic heart disease, such as pericarditis or myocarditis, generally produces
global changes, altering ST segments and T waves in anterior, inferior, and lateral leads.
Remember that changes resulting from ischemia are usually limited to one vascular
region.
ST Segment Elevation
The most common cause of ST segment elevation is transmural MI, now called ST-
elevation MI. Catheterization during chest pain and ST elevation shows a coronary
artery that is totally occluded. ST elevation is the primary ECG indication for emer-
gency angioplasty or thrombolytic therapy. Compared with ST segment depression,
ST elevation is a more specific indication of acute ischemia. Most patients with new
ST elevation are in the emergency room with chest pain.
Acute MI with ST segment elevation is a dramatic finding on the ECG (Figs 2.13 and 2.14).
Review these tracings from seven patients with inferior or anterior MI. The ST elevation
is limited to leads that reflect a single vascular distribution (see Fig 2.8). Patients with
large transmural infarction who have ST segment elevation may also have ST depression
in leads reflecting nonischemic myocardial regions (see Fig 2.13). The ST depression is
called reciprocal ST depression, and it does not indicate ischemia in the noninfarct zone.
Not all ischemic ST elevation leads to injury. Vasospastic, or Prinzmetal’s, angina
pectoris also causes ST elevation. An angiogram obtained during a spontaneous
episode, or with provocative testing with ergonovine infusion, usually shows total cor-
onary occlusion. This would induce full thickness—transmural—ischemia in that vascu-
lar distribution. The ST elevation and chest pain are usually self-limited, or respond to
nitrates and calcium channel blockers. MI is an uncommon complication of spontane-
ous coronary vasospasm. However, cocaine-induced spasm may cause infarction or
sudden cardiac death.
Although more reliable than ST segment depression, ST elevation is not specific for
ischemia, and it must be interpreted in clinical context. Two nonischemic causes of ST
elevation deserve special attention.
1. Acute pericarditis may cause ST elevation and chest pain, raising the possibility
of acute MI (Figs 2.15 and 2.16). Features that may help you distinguish the ST
elevation of pericarditis from that caused by ischemia are reviewed in Table 2.4.
Although these features are helpful when found, they may also be subtle or
missing. There may be uncertainty about the diagnosis, and the ECG is just one
piece of the puzzle. The clinical presentation is just as important as the ECG.
56 150PracticeECGs:InterpretationandReview
FourpatientswithacuteinferiorMI.ThesizeofinferiorMIisproportionaltothesumofST
elevationinthethreeinferiorleads.Inaddition,thosewithreciprocalSTdepressioninanteriororlateral
leadstendtohavelargerinfarctions.Usingthesecriteria,patient
washavingthelargestMI,patients
and
moderate-sizedMIs,andpatientasmallinfarct.PatientalsohadSTelevationinV
5
andV
6
;this
maybecalledaninferolateralMI.Inthiscase,thedistalrightcoronaryarteryintheAVgroovewaslarge,
anditterminatedinabranchtothelateralwall(seeFig2.8).
Patient
isanarguablecaseofinfarction,astheSTsegmentelevationisminimal.Iamtemptedtosay
thatthemildJpointdepressioninV
2
throughV
4
representsreciprocalSTdepression;typicalchestpain
andasubsequentriseincardiacenzymeswouldbeneededtomakethediagnosisofMIwithcertaintyin
thiscase.TheECGchangesofSTsegmentelevationinfarctionareusuallyobvious,butthereareborderline
caseslikethisone.Asarule,suchborderlinecasesinvolvesmallMIs;withbigonesthereislittledoubt.
MorphologicChangesinP,QRS,ST,andT 57
ThreepatientswithacuteanteriorMIandSTelevation.PatienthasupwardlyconvexST
segments.Patient
hassimilarlyshapedSTsinV
3
throughV
5
,butstillhassomeupwardconcavityinV
1
and
V
2
.ThispatienthasdevelopedTinversioninadditiontoSTelevation(seeTable2.1).PatienthasSTele-
vationplustall,peakedTwaves.TheseTwavechangesmaybecalled
hyperacute,andtheywouldindicate
ischemiaintheabsenceofSTelevation.
ThesizeofanteriorMIisproportionaltothenumberofleadswithSTelevation.Eachofthesepatients
hasSTelevationinfivedifferentleadsandishavinglargeinfarction.
2. Early repolarization is a common cause of ST elevation. The cause is not certain,
but the name suggests that some portion of the ventricle repolarizes before the
obvious onset of the T wave, raising the ST segment. As with pericarditis, ST
segment elevation may be global rather than regional (although it may be limited
to just one or two leads), and the ST segment usually has normal upward concav-
ity. It is often difficult to distinguish early repolarization and acute pericarditis.
Depression of the PR segment is a specific finding for pericarditis (see Fig 2.15).
Early repolarization is a benign condition, common in young people. There is little
day-to-day variation in this pattern, so comparison of the ECG with previous trac-
ings should help make the diagnosis.
58 150PracticeECGs:InterpretationandReview
Acutepericarditis.This19-year-oldmanhada2-weekhistoryoftheflu.Therewasmild
fever.OnthemorningofthisECG,hedevelopedchestpainthatworsenedwithdeepbreathing(e.g.,pleu
-
riticpain).Onexam,therewasapericardialfrictionrub.TheECGshowsSTelevationinmultipleleads,and
thereisnoreciprocalSTdepression.TheSTsareupwardlyconcave.ThereisdepressionofthePRsegment
inleadsIIandaVF,andprobablyinIII;PRdepressionmakesthediagnosisofpericarditismorecertain.
STsegmentelevation.PatientstillhasthenormalupwardconcavityoftheSTsegment.
Thisisusuallythecasewithpericarditis,althoughwehaveseensimilarSTchangeswithacute,transmural
ischemia(seeFig2.14).Patient
hassimultaneousSTelevationandTinversion.Thiscombinationindicates
ischemia.TheTwavesmayinvertwithpericarditis,buttheST’susuallybecomeisoelectricbeforetheT’s
turnover.Patient
hasanupwardlyconvexSTsegment;thisusuallyindicatesischemia.
ST segment elevation resolves over a day or two after acute MI. But an occasional
patient with anterior MI has chronic ST segment elevation. This ECG finding
suggests left ventricular aneurysm.
Q Waves and Evolution of Myocardial Infarction
An initial negative deflection of the QRS complex is labeled a Q wave. A significant Q
wave is deep and broad, at least 1 mm deep and 1 mm wide. Isolated Q waves may be
normal in leads III or V
1
; in other leads, Q waves are abnormal and indicate transmural
myocardial injury (see Fig 2.9).
MorphologicChangesinP,QRS,ST,andT 59
TypicalevolutionoftransmuralMI.:LimbleadsfromapatientwithacuteMIwhohadinfe-
riorSTelevationplusreciprocalSTdepressioninlateralleads.
:ThenextdaytherewaslessSTelevation,
thereciprocalSTdepressionhadresolved,andtheTwaveswereinvertedintheinferiorleads.DeeperQ
wavesdevelopedintheinferiorleads.
60 150PracticeECGs:InterpretationandReview
The concept of complete versus incomplete MI is useful. A patient who has had a Q
wave infarction but who develops postinfarction angina may have viable muscle
in the infarct zone (the source of angina). The usual mechanism for this is spon-
taneous thrombolysis early in the course of MI. As with thrombolytic therapy,
an hour or two of ischemia is enough to cause Q waves, even though injury is
incomplete and there is residual, viable muscle. As noted, early reperfusion seems
to hasten the evolution of Q waves.
This is the mechanism for what used to be called extension of MI. Recurrent
pain, more ST elevation, and another increase in cardiac enzyme during the week
after a Q wave infarction may indicate that the initial infarction was incomplete,
possibly because of spontaneous thrombolysis. Reocclusion of the infarct artery
is responsible for recurrence, or “extension,” of the MI.
In the absence of acute reperfusion therapy, the ECG pattern of MI evolves over a
couple of days (Fig 2.17 and Table 2.3). The earliest change is ST segment elevation,
and this develops immediately with coronary occlusion. It may be associated with tall,
peaked T waves, also called hyperacute T waves (see Fig 2.14D). Within hours, the T
waves may become inverted while there is persistence of ST elevation. Hours to days
after the onset of MI, Q waves appear. The diagnosis of MI is most secure when these
evolutionary changes are recorded on serial ECGs. ST elevation without evolutionary
changes suggests a nonischemic etiology.
STSegmentElevation:PericarditisversusIschemia
Distribution Global(multiplevascular Regional(onevascular
distributions) distribution)
ReciprocalSTdepression Absent Maybepresent
STsegmentshape Normal(upwardlyconcave) Ischemic(upwardlyconvex)
PRdepression Present(seeFig2.15) Absent
TimingofTinversion T’sinvertafterST’sbecome T’sinvertwhiletheST’sarestill
isoelectric elevated
While ST elevation and T wave inversion may resolve during the 2 weeks after
acute MI, Q waves persist in 70% to 90% of patients. They may disappear after a small
inferior MI, but Q’s tend to be permanent after a large MI.
Reperfusion therapy for MI has changed some of this. The evolution of ECG changes is
more rapid. When the occluded infarct artery is opened, the ST segment elevation
either resolves or improves. That is not always the case, and persistent elevation of ST
segments may indicate microvascular injury, even though the large coronary artery is
open. Prompt resolution of ST elevation is the best indicator of successful reperfusion
and myocardial salvage.
MorphologicChangesinP,QRS,ST,andT 61
AcutelateralMI.STelevationislimitedtothelateralleads,I,andaVL.Itispossibletohave
STchangesinjustV
6
,orinV
5
andV
6
.Anditisalsopossibletohavelateral,transmuralischemiawithno
ECGchangesatall.
Q waves develop rapidly with reperfusion, possibly within minutes. Our experience
with reperfusion also has provided new insights into the significance of Q waves. In
the old days, I was taught that Q waves meant transmural scar with loss of all muscle
(and, therefore, a loss of contractility). Now we know that deep Q waves may develop
even when there is early reperfusion and only partial injury to muscle in the infarct
zone. Thus Q waves do not reliably define an LV segment as irreversibly damaged—or
the infarction as completed.
Pseudoinfarctionpatterncausedbypre-excitation(Wolff-Parkinson-Whitesyndrome).The
inferiorQsare,infact,deltawaves.Thetip-offistheshortPRintervalplusthemoreobviousdeltawavein
thelateralprecordialleads.
The ECG criterion for transmural MI is pathologic Q waves. Occlusion of the circum-
flex artery may cause ST segment elevation in lateral leads (Figs 2.8 and 2.18).
However, it is possible to have transmural injury involving the lateral wall of the LV
with few ST segment or T wave changes and without Q waves. The lateral wall seems
to be an electrocardiographically silent region of the heart (see Fig 2.8). The patient
may have typical chest pain and a subsequent rise in cardiac enzymes and may even
be left with akinesis (no contractility) of the lateral wall. Yet the ECG may be
unchanged throughout the course of MI. This is the rationale for extended observation
and cardiac enzyme measurement when there is typical, ischemic chest pain but a
normal ECG, or one that does not provide the usual evidence for acute MI.
62 150PracticeECGs:InterpretationandReview
The opposite side of the coin is the patient with no symptoms who has significant Q
waves, and an akinetic LV segment involving the same vascular region (i.e., anterior Q
waves and anterior akinesis on the echocardiogram). Taking a careful history, you may
get the patient to remember vague symptoms that could have been the infarction, but
in many cases there are no symptoms at all. This is the case with at least 20% of MIs,
and it may be more common in patients with diabetes and diabetic neuropathy. It is
important to recognize silent ischemic heart disease because it is associated with a poor
prognosis.
Poor R wave progression may begin with Q waves in V
1
–V
2
, raising the possibility of
prior anterior MI. This is easily sorted out with an echocardiogram which identifies an
anterior and septal wall motion abnormality after infarction.
A couple of conditions may produce false-positive Q waves. The delta wave of pre-
excitation may appear to be a Q wave (Fig 2.19). Recognition of the short PR interval,
the absence of a clinical history of MI, and a normal echocardiogram are tip-offs. Q
waves may be seen in patients with hypertrophic cardiomyopathy; the physical exami-
nation suggests the diagnosis and it is confirmed by echocardiography.
63
150 Practice ECGs
P a r t I I
As you read the practice ECGs, write the ECG report including rate, rhythm, intervals,
axis, and interpretation. If you do not commit yourself on paper, it does not count!
Read five to ten ECGs in a row before checking answers. There is a rhythm to this
exercise that you should not interrupt. After you have read 150 ECGs, you will be
reading them with confidence.
64 150PracticeECGs:InterpretationandReview
A57-year-oldman,preoperativeECG.
150PracticeECGs 65
A78-year-oldman,nohistoryprovided.
66 150PracticeECGs:InterpretationandReview
A54-year-oldwoman,admittedwithcholecystitis.
150PracticeECGs 67
A49-year-oldman,nohistorygiven.HashehadanMI?When?
68 150PracticeECGs:InterpretationandReview
A78-year-oldwomanwithahistoryofMIisnowintheemergencyroomwithchestpain.ThereisapriorECGforcomparison.Canyou
besurethatherpainisduetoMI?
150PracticeECGs 69
A36-year-oldman;lifeinsuranceexamination,nohistoryofheartdisease.
70 150PracticeECGs:InterpretationandReview
A79-year-oldmanbroughtfromthenursinghomewitharapidpulse.
150PracticeECGs 71
A72-year-oldwomanwithheartfailure.Whatisthecause?
72 150PracticeECGs:InterpretationandReview
Anactive82-year-oldwomanwithhypertension.Shouldweworryaboutpossiblesyncope?
150PracticeECGs 73
A94-year-oldwomanwithfailingmemory.
74 150PracticeECGs:InterpretationandReview
A72-year-oldmanwithalonghistoryofheartdisease,ondigoxin.