Advanced Methods and Tools for ECG Data Analysis - Part 10 pps
Bạn đang xem bản rút gọn của tài liệu. Xem và tải ngay bản đầy đủ của tài liệu tại đây (496.75 KB, 40 trang )
P1: Shashi
August 24, 2006 11:56 Chan-Horizon Azuaje˙Book
13.3 Unsupervised Learning Techniques and Their Applications in ECG Classification 345
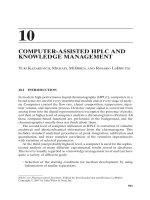
Table 13.3 The Traditional SOM Algorithm
1: Initialization: Determine network topology
Choose random weight value for each Kohonen neuron
Set the time parameter t = 0
2: Repeat
3: Select an input pattern i
k
from the training set
4: Find the winning neuron at time t whose weight, w
j
, is closest to i
k
5: Update the weights of the winning neuron and its neighbours
6: Increase the time parameter t: t = t + 1
7: Until network converges or
computational bounds such as predefined learning cycles are exceeded
operations such as derivatives and matrix inversions are needed. In contrast to
the rigid structure of hierarchical clustering and the lack of structure of k-means
clustering, a SOM reflects similarity relationships between patterns and clusters by
adapting its neurons, which are used to represent prototypical patterns [20]. Such
adaptation and cluster representation mechanisms offer the basis for cluster visu-
alization platforms. However, the predetermination of a static map representation
contributes to its inability to implement automatic cluster boundary detection.
There are a number of techniques to enhance SOM-based data visualization,
which have been extensively reviewed elsewhere [21]. Some of the best known are
based on the construction of distance matrices, such as a unified distance matrix
(U-matrix) [22]. A U-matrix encodes the distance between adjacent neurons, which
is represented on the map by a color scheme. An example is illustrated in Figure 13.6.
Figure 13.6 SOM-based data visualization for the Iris data set produced with the SOM-toolbox
[23]. The U-matrix representation and a map based on the median distance matrix are shown on
the right and left panels, respectively. The hexagons represent the corresponding map neurons. A
dark coloring between the neurons corresponds to a large distance. A light coloring signifies that
the input patterns are close to each other in the input space. Thus, light areas can be thought of as
clusters and dark areas as cluster boundaries. These maps highlight three clusters in the data set.
P1: Shashi
August 24, 2006 11:56 Chan-Horizon Azuaje˙Book
346 An Introduction to Unsupervised Learning for ECG Classification
13.3.4 Application of Unsupervised Learning in ECG Classification
The previous sections indicate that unsupervised learning is suitable to support ECG
classification. Moreover, clustering-based analysis may be useful to detect relevant
relationships between patterns. For example, recent studies have applied SOMs to
analyse ECG signals from patients suffering from depression [24] and to classify
spatiotemporal information from body surface potential mapping (BSPM) [25].
The results obtained in the former study indicate that an unsupervised learning
approach is able to differentiate clinically meaningful subgroups with and without
depression based on ECG information. Other successful applications include the
unsupervised classification of ECG beats encoded with Hermite basis functions [26],
which have shown to exhibit a low degree of misclassification. Thus, interactive and
user-friendly frameworks for ECG analysis can be implemented, which may allow
users to gain better insights into the class structure and key relationships between
diagnostic features in a data set [27].
Hierarchical clustering has also provided the basis for the implementation of
systems for the analysis of large amounts of ECG data. In one such study sponsored
by the American Heart Association (AHA) [28], the data were accurately organized
into clinically relevant groups without any prior knowledge. These types of tools
may be particularly useful in exploratory analyses or when the distribution of the
data is unknown. Figure 13.7 shows a typical hierarchical tree obtained from the
ECG data set in the AHA study. Based on the pattern distributions over these
clusters, one can see that the two clusters (A and B) at the first level of the tree
correspond to Classes Normal and Abnormal, respectively, while the two subclusters
at the second level of the hierarchy are associated to Class V (premature ventricular
contraction) and Class R (R on T ventricular premature beat), respectively. Other
interesting applications of hierarchical and k-means clustering methods for ECG
classification are illustrated in [29, 30].
Although traditional unsupervised learning methods are useful to address differ-
ent classification problems, they exhibit several limitations that limit their applica-
bility. For example, the SOM topology needs to be specified by the user. Such a fixed,
nonadaptable architecture may negatively influence its application to more com-
plex, dynamic classification problems. The SOM indicates the similarities between
Figure 13.7 The application of hierarchical clustering for ECG classification: (a) tree structure ex-
tracted by clustering; and (b) pattern distributions over the clusters [28].
P1: Shashi
August 24, 2006 11:56 Chan-Horizon Azuaje˙Book
13.3 Unsupervised Learning Techniques and Their Applications in ECG Classification 347
input vectors in terms of the distances between the corresponding neurons. But it
does not explicitly represent cluster boundaries. Manually detecting the clusters and
their boundaries on a SOM may be an unreliable and time-consuming task [31].
The k-means model does not impose a cluster structure on the data. It produces a
relatively disorganized collection of clusters that may not clearly portray significant
associations between patterns [20]. Different versions of hierarchical clustering are
conceptually simple and easy to implement, but they exhibit limitations such as
their inability to perform adjustments once a splitting or merging decision has been
made. Advanced solutions that aim to address some of these limitations will be
discussed in the next section.
13.3.5 Advances in Clustering-Based Techniques
Significant advances include more adaptive techniques, semisupervised clustering,
and various hybrid approaches based on the combination of several clustering
methods.
13.3.5.1 Clustering Based on Supervised Learning Techniques
Traditional clustering ignores prior classification knowledge of the data under in-
vestigation. Recent advances in clustering-based biomedical pattern discovery have
demonstrated how supervised classification techniques, such as supervised neural
networks, can be used to support automatic clustering or class discovery [14]. These
approaches are sometimes referred to as semisupervised clustering. Relevant exam-
ples include the simplified fuzzy ARTMAP (SFAM) [32, 33] and supervised network
self-organized map (sNet-SOM) [34].
A SFAM is a simplified form of the fuzzy ARTMAP neural network based on
Adaptive Resonance Theory (ART), which has been extensively studied for super-
vised, incremental pattern recognition tasks. The SFAM aims to reduce the compu-
tational costs and architectural complexity of the fuzzy ARTMAP model [32]. In
simple terms a SFAM comprises two layers: the input and output layers (illustrated
in Figure 13.8). In the binary input the input vector is first processed by the com-
plement coder where the input vector is stretched to double its size by adding its
complement as well [32]. The (d×n) weight matrix, W, encodes the relationship be-
tween the output neurons and the input layer. The category layer holds the names
of the m categories that the network has to learn. Unlike traditional supervised
back-propagation neural networks, the SFAM implements a self-organizing adap-
tation of its learning architecture. The assignment of output neurons to categories
is dynamically assessed by the network. Moreover, the model requires one single
parameter, ρ, or vigilance parameter, to be specified and can perform a training task
with one pass through the data set (one learning epoch). In the SFAM model, when
the selected output neuron does not represent the same category corresponding to
the given input sample, a mechanism called match tracking is triggered. This mecha-
nism gradually increases the vigilance level and forces a search for another category
suitable to be associated with the desired output. Further information about the
learning algorithm of the SFAM can be found in [32, 33]. Its application and useful
aspects for decision making support have been demonstrated in different domains
P1: Shashi
August 24, 2006 11:56 Chan-Horizon Azuaje˙Book
348 An Introduction to Unsupervised Learning for ECG Classification
Figure 13.8 Architecture of a SFAM network. Based on a mechanism of match tracking, a SFAM
mode adjusts a vigilance level to decide when new output neurons should be generated to learn the
categories.
such as prognosis of coronary care patients and acute myocardial infarction diag-
nosis [35].
The sNet-SOM model [34] is an adaptation of the original SOM, which con-
siders class information for the determination of the winning neurons during the
learning process. The learning process is achieved by minimizing a heterogeneous
measure, E, defined as follows:
E =
k
i=1
(ζ
l
i
+ R
su
H
i
) + ϕ
(13.1)
where k is the number of output neurons. The ζ
l
i
is associated with an unsupervised
classification error corresponding to pattern i. This error promotes the separation
of patterns that are different according to a similarity metric, even if they have
the same class label. The entropy measure, H
i
, considers the available a priori
classification information to force patterns with similar labels to belong to the
same clusters. The term ϕ punishes any increases in the model complexity and R
su
is a supervised/unsupervised ratio, where R
su
= 0 represents a pure unsupervised
model. Thus, the sNet-SOM adaptively determines the number of clusters, but at
the same time its learning process is able to exploit class information available. It has
been demonstrated that the incorporation of a priori knowledge into the sNet-SOM
model further facilitates the data clustering without losing key exploratory analysis
capabilities exhibited by traditional unsupervised learning approaches [34].
P1: Shashi
August 24, 2006 11:56 Chan-Horizon Azuaje˙Book
13.3 Unsupervised Learning Techniques and Their Applications in ECG Classification 349
13.3.5.2 Hybrid Systems
The term hybrid system has been traditionally used to describe any approach that
involves more than one methodology. A hybrid system approach mainly aims to
combine the strengths of different methodologies to improve the quality of the re-
sults or to overcome possible dependencies on a particular algorithm. Therefore,
one key problem is how to combine different methods in a meaningful and reliable
way. Several integration frameworks have been extensively studied [36, 37], includ-
ing the strategies illustrated in Figure 13.9. Such strategies may be implemented by:
(a) using an output originating from one method as the input to another method;
(b) modifying the output of one method to produce the input to another method;
(c) building two methods independently and combining their outputs; and (d) using
one methodology to adapt the learning process of another one. These generic strate-
gies may be applied to both supervised and unsupervised learning systems.
Hybrid models have supported the development of different ECG classifica-
tion applications. For example, the combination of a variation of the SOM model,
known as the classification partition SOM (CP-SOM), with supervised models,
such as radial basis function and SVM, have improved predictive performance in
the detection of ischemic episodes [38]. This hybrid approach is summarized in
Figure 13.10. In this two-stage analysis system, the SOM is first used to offer a
global, computationally efficient view of relatively unambiguous regions in the
data. A supervised learning system is then applied to assist in the classification
of ambiguous cases.
In another interesting example, three ANN-related algorithms [the SOM, LVQ,
and the mixture-of-experts (MOE) method] [39] were combined to implement an
ECG beat classification system. In comparison to a single-model system, this hybrid
learning model significantly improved the beat classification accuracy. Given the fact
Figure 13.9 Basic strategies for combining two classification approaches. A and B represent indi-
vidual clustering methods; a, b, c, and d stand for basic hybrid learning strategies.
P1: Shashi
August 24, 2006 11:56 Chan-Horizon Azuaje˙Book
350 An Introduction to Unsupervised Learning for ECG Classification
Figure 13.10 The combination of a SOM-based model with supervised learning schemes for the
problem of ischemia detection.
that different approaches offer complementary advantages for pattern classification,
it is widely accepted that the combination of several methods may outperform
systems based on a single classification algorithm.
13.3.5.3 SANN-Based Clustering
Several SANNs have been proposed to address some of the limitations exhibited by
the original SOM. SANNs represent a family of self-adaptive, incremental learning
versions of the SOM. Their learning process generally begins with a set of simple
maps on which new neurons are conditionally added based on heuristic criteria. For
instance, these criteria take into account information about the relative winning fre-
quency of a neuron or an accumulated optimization error. A key advantage of these
models is that it allows the shape and size of the network to be determined during
the learning process. Thus, the resulting map can show relevant relationships in the
data in a more meaningful and user-friendly fashion. For example, due to the ability
to separate neurons into disconnected areas, the growing cell structures (GCS) [40]
and incremental grid growing (IGG) neural network [41] may explicitly represent
cluster boundaries. Based on the combination of the SOM and the GCS principles,
the self-organizing tree algorithm (SOTA) [42] is another relevant example of un-
supervised, self-adaptive classification. An interesting feature in the SOTA is that
the map neurons are arranged following a binary tree topology that allows the im-
plementation of hierarchical clustering. Other relevant applications to biomedical
data mining can be found in [43, 44].
The growing self-organizing map (GSOM) is another example of SANNs, which
has been successfully applied to perform pattern discovery and visualization in var-
ious biomedical domains [45, 46]. It has illustrated alternative approaches to im-
proving unsupervised ECG classification and exploratory analyses by incorporating
different graphical display and statistical tools. This method is discussed in more
detail in the next section.
13.3.6 Evaluation of Unsupervised Classification Models: Cluster Validity
and Significance
In the development of medical decision-support systems, the evaluation of results is
extremely important since the system’s output may have direct health and economic
implications [36]. In unsupervised learning-based applications, it is not always
P1: Shashi
August 24, 2006 11:56 Chan-Horizon Azuaje˙Book
13.3 Unsupervised Learning Techniques and Their Applications in ECG Classification 351
possible to predefine all the existing classes or to assign each input sample to a
particular clinical outcome. Furthermore, different algorithms or even the same
algorithm using different learning parameters may produce different clustering re-
sults. Therefore, it is fundamental to implement cluster validity and evaluation
methodologies to assess the quality of the resulting partitions.
Techniques such as the GSOM provide effective visualization tools for approx-
imating the cluster structure of the underlying data set. Interactive, visualization
systems may facilitate the verification of the results with relatively little effort.
However, cluster validation and interpretation solely based on visual inspection
may sometimes only provide a rough, subjective description of the clustering results.
Ideally, unbiased statistical evaluation criteria should be available to assist the user
in addressing two fundamental questions: (1) How many relevant clusters are actu-
ally present in the data? and (2) How reliable is a partitioning? One such evaluation
strategy is the application of cluster validity indices.
Cluster validity indices aim to provide a quantitative indication of the quality
of a resulting partitioning based on the following factors [47]: (a) compactness,
the members of each cluster should be as close to each other as possible; and (b)
separation, the clusters themselves should be widely spaced. Thus, from a collection
of available clustering results, the best partition is the one that generates the optimal
validity index value.
Several validity indices are available, such as Dunn’s validity index [48] and
the Silhouette index [49]. However, it has been shown that different cluster vali-
dation indices might generate inconsistent predictions across different algorithms.
Moreover, their performance may be sensitive to the type of data and class distri-
bution under analysis [50, 51]. To address this limitation, it has been suggested
that one should apply several validation indices and conduct a voting strategy to
confidently estimate the quality of a clustering result [52]. For example, one can
implement an evaluation framework using validity indices such as the generalized
Dunn’s index [48, 52], V
ij
(U), defined as
V
ij
= min
1≤s≤c
min
1≤t≤c,s=t
δ
i
(X
s
, X
t
)
max
1≤k≤c
{
j
(X
k
)}
(13.2)
where δ
i
(X
s
, X
t
) represents the ith intercluster distance between clusters X
s
and X
t
,
j
(X
k
) represents the jth intracluster distance of cluster X
k
, and c is the number
of clusters. Hence, appropriate definitions for intercluster distances, δ, and intr-
acluster distances, , may lead to validity indices suitable to different types of
clusters. Thus, using combinations of several intercluster distances, δ
i
, (e.g., com-
plete linkage defined as the distance between the most distant pair of patterns, one
from each cluster) and intracluster distances,
j
, (e.g., centroid distance defined as
the average distance of all members from one cluster to the corresponding cluster
center) multiple Dunn’s validity indices may be obtained. Based on a voting strat-
egy, a more robust validity framework may be established to assess the quality of
the obtained clusters. Such a clustering evaluation strategy can help the users not
only to estimate the optimal number of clusters but also to assess the partitioning
generated. This represents a more rigorous mechanism to justify the selection of a
particular clustering outcome for further examination. For example, based on the
P1: Shashi
August 24, 2006 11:56 Chan-Horizon Azuaje˙Book
352 An Introduction to Unsupervised Learning for ECG Classification
same methodology, a robust framework for supporting quantitatively assessing the
quality of classification outcomes and automatically identifying relevant partitions
were implemented in [46].
Other clustering evaluation techniques include different procedures to test the
statistical significance of a cluster in terms of it class distribution [53]. For example,
one can apply hypergeometric distribution function to quantitatively assess the
degree of class (e.g., signal category, disease) enrichment or over-representation in a
given cluster. For each class, the probability (p-value) of observing k class members
within a given cluster by chance is calculated as
p = 1 −
k−1
i=0
K
i
N − K
n − i
N
n
(13.3)
where k is the number of class members in the query cluster of size n, N is the size
of the whole data set, and K is the number of class members in the whole data
set. If this probability is sufficiently low for a given class, one may say that such
a class is significantly represented in the cluster; otherwise, the distribution of the
class over a given cluster could happen by chance. The application of this technique
can be found in many clustering-based approaches to improving biomedical pattern
discovery. For example, it can be used to determine the statistical significance of
functional enrichment for clustering outcomes [54].
An alternative approach to cluster validation may be based on resampling and
cross-validation techniques to stimulate perturbations of the original data set, which
are used to assess the stability of the clustering results with respect to sampling
variability [55]. The underlying assumption is that the most reliable results are
those ones that exhibit more stability with respect to the stimulated perturbations.
13.4 GSOM-Based Approaches to ECG Cluster Discovery
and Visualization
13.4.1 The GSOM
The GSOM, originally reported in [56], preserves key data processing principles
implemented by the SOM. However, the GSOM incorporates methods for the in-
cremental adaptation of the network structure. The GSOM learning process, which
typically starts with the generation of a network composed by four neurons, in-
cludes three stages: initialization, growing, and smoothing phases. Two learning
parameters have to be predefined by the user: the initial learning rate, LR(0), and
a network spread factor, SF.
Once the network has been initialized, each input sample, x
i
, is presented. Like
other SANNs, the GSOM follows the basic principle of the SOM learning process.
Each input presentation involves two basic operations: (1) determination of the
winning neuron for each input sample using a distance measure (e.g., Euclidean
distance); and (2) adaptation of the weight vectors w
j
of the winning neurons and
P1: Shashi
August 24, 2006 11:56 Chan-Horizon Azuaje˙Book
13.4 GSOM-Based Approaches to ECG Cluster Discovery and Visualization 353
their neighborhoods as follows:
w
j
(t + 1) =
w
j
(t) + LR
t
× (x
i
− w
j
(t)), j ∈ N
c
(t)
w
j
(t), otherwise
(13.4)
where t refers to the current learning iteration, LR(t) is the learning rate at time t,
and N
c
(t) is the neighborhood of the winning neuron c at time t. During the learning
process, a cumulative quantization error (E) is calculated for each winning neuron
using the following formula:
E
i
(t + 1) = E
i
(t) +
D
k=1
(x
k
− m
i,k
)
2
(13.5)
where m
i,k
is the kth feature of the ith winning neuron, x
k
represents the kth feature
of the input vector, x, and E
i
(t) represents the quantization error at time t.
In the growing phase, the network keeps track of the highest error value and
periodically compares it with the growth threshold (GT), which can be calculated
with the predefined SF value. When E
i
> GT, new neurons are grown in all free
neighboring positions if neuron i is a boundary neuron; otherwise the error will
be distributed to its neighboring neurons. Figure 13.11 summarizes the GSOM
learning process. The smoothing phase, which follows the growing phase, aims to
fine-tune quantization errors, especially in the neurons grown at the latter stages.
The reader is referred to [46, 56] for a detailed description of the learning dynamics
of the GSOM.
Due to its dynamic, self-evolving architecture, the GSOM exhibits several in-
teresting properties for ECG cluster discovery and visualization:
•
The network structure is automatically derived from the data. There is no
need to predetermine the size and structure of the output maps.
•
The GSOM keeps a regular, two dimentional grid structure at all times. The re-
sulting map reveals trends hidden in the data by its shape and attracts attention
to relevant areas by branching out. This provides the basis for user-friendly
pattern visualization and interpretation platforms.
•
In some SANNs, such as GCS and IGG, the connectivity of the map is con-
stantly changing as connections or neurons are added and deleted. But once a
connection is removed inappropriately, the map will have no chance of recov-
ery. This makes them more sensitive to the initial parameter settings [41, 57].
The GSOM does not produce isolated clusters based on the separation of
network neurons into disconnected areas. Such an approach requires less pa-
rameters in comparison to IGG and GCS. The impact of learning parameters
on the GSOM performance were empirically studied in [45, 46].
•
The user can provide a spread factor, SF ∈ [0, 1], to specify the spread amount
of the GSOM. This provides a straightforward way to control the expansion
of the networks. Thus, based on the selection of different values of SF, hier-
archical and multiresolution clustering may be implemented.
P1: Shashi
August 24, 2006 11:56 Chan-Horizon Azuaje˙Book
354 An Introduction to Unsupervised Learning for ECG Classification
Figure 13.11 The GSOM learning algorithm. NLE: number of learning epochs; N: number of ex-
isting neurons; M: number of training cases; j: neuron index; k: case index; E
i
(t): accumulative
quantization error of neuron i at time t; D: dimensionality of input data; GT: growth threshold;
SF: spread factor.
•
The GSOM can represent a data set with a lesser number of neurons than
the SOM, resulting in faster computing processing. Having fewer neurons
at the early stage and initializing the weight of new neurons to match their
neighborhood further reduce the processing time.
13.4.2 Application of GSOM-Based Techniques to Support
ECG Classification
This section introduces the application of GSOM-based approaches to supporting
ECG classification. The GSOM model is tested on two real data sets to illustrate its
data visualization and classification capabilities.
The first application is an ECG beat data set obtained from the MIT/BIH Arrhy-
thmia database [58]. Based on a set of descriptive measurements for each beat, the
goal is to decide whether a beat is a ventricular ectopic beat (Class V) or a normal
P1: Shashi
August 24, 2006 11:56 Chan-Horizon Azuaje˙Book
13.4 GSOM-Based Approaches to ECG Cluster Discovery and Visualization 355
beat (Class N). It has been suggested that the RR intervals between the previous beat,
the processing beat, and the next beat may be significantly different in premature
beats [59]. In view of this, data are extracted as one feature vector represented by
nine temporal parameters for each of the beats in all selected records. The first four
features are temporal parameters relating to RR intervals between four consecutive
beats. The next two features are the cross-correlation of normalized beat templates
of the current beat with the previous and subsequent beats, respectively. The last
three features are based on the calculation of percent durations of the waveform
above three predetermined thresholds, which are 0.2, 0.5, and 0.8, respectively. A
detailed description of this data set can be found at the Web site of the Computer-
Aided Engineering Center of the University of Wisconsin-Madison [60]. Each class
in the data set is represented by a number: N → 1 and V → 2. In this example, a
total of 5,000 beats (3,000 Class N samples and 2,000 Class V samples) have been
randomly chosen to implement and test the model.
The second data set is a sleep apnea data set, which was designed to detect the
presence or absence of apnea events from ECG signals, each one with a duration of
1 minute. A total of 35 records obtained from the 2000 Computers in Cardiology
Challenge [58] were analyzed. Each record contains a single ECG signal during
approximately 8 hours. Each subject’s ECG signal was converted into a sequence
of beat intervals, which may be associated with prolonged cycles of sleep apnea.
The Hilbert transformation, an analytical technique for transforming a time series
into corresponding values of instantaneous amplitudes and frequencies [61], was
used to derive the relevant features from the filtered RR interval time series [62].
Previous research has shown that by using the Hilbert transformation of the RR
interval time series, it is possible to detect obstructive sleep apnea from single-lead
ECG with a high degree of accuracy [62]. The corresponding software is freely
available at PhysioNet [58]. The results reported in this example are based on the
analysis of 2,000 episodes, 1,000 of which are normal episodes.
Unless indicated otherwise, the parameters for the GSOM-based results reported
in this chapter are as follows: SF = 0.001, N
0
= 6 for the ECG beat data set and
N
0
= 4 for sleep apnea data set, initial learning rate, LR(0), = 0.5 and the maximum
NLE (growing phase) = 5, NLE (smoothing phase) = 10.
13.4.2.1 Cluster Visualization and Discovery
The resulting GSOM maps for the ECG beat and sleep apnea data sets are shown
in Figures 13.12(a) and 13.13(a), respectively. The numbers shown on the map
neurons represent the order in which they were created during the growth phase.
Based on a majority voting strategy, where the class with the highest frequency
renders its name to the corresponding output neuron, the corresponding label maps
are given in Figures 13.12(b) and 13.13(b), respectively. The class labels for each
neuron are represented as integer numbers. As a way of comparison, the SOM
maps produced for these two data sets using the SOM toolbox (an implementation
of the SOM in the Matlab 5 environment) [23] are depicted in Figures 13.14 and
13.15. The SOM Toolbox automatically selects the map size for each data set. In
this example: 23×16 neurons for the ECG beat data set, and 28×8 neurons for the
sleep apnea data set. The U-matrices are shown in Figures 13.14(a) and 13.15(a).
P1: Shashi
August 24, 2006 11:56 Chan-Horizon Azuaje˙Book
356 An Introduction to Unsupervised Learning for ECG Classification
Figure 13.12 GSOM-based data visualization for a ECG beat data set: (a) resulting map with SF =
0.001; and (b) label map. The numbers shown on the map represent the class label for each node.
Only a majority class renders its name to the node. In case of a draw, the first class encountered is
used as a label.
Shades of gray indicate the distances between adjacent neurons as illustrated in the
middle scale bar. The corresponding label maps based on a majority voting strategy
are depicted in Figures 13.14(b) and 13.15(b).
The SOM manages to group similar patterns together. However, in Figure
13.14(b), neuron A, which is associated with Class 2, lies far away from other
Class 2 neurons, and it is surrounded by Class 1 neurons. Moreover, a neuron B,
labeled as Class 1, is clustered into the Class 2 area. In Figure 13.15(b), several Class
2 neurons, such as neurons A and B, are grouped together with Class 1 neurons.
The boundaries between the class regions are ambiguous. The U-matrix, generally
regarded as an enhanced visualization technique for SOM map, fails to offer a user-
friendly visualization of the cluster structure in this problem [Figure 13.14(a)]. The
U-matrix shown in Figure 13.14 provides information about the cluster structure
in the underlying data set. But in this and other examples it could be difficult to
directly link a U-matrix graph with its corresponding label map.
P1: Shashi
August 24, 2006 11:56 Chan-Horizon Azuaje˙Book
13.4 GSOM-Based Approaches to ECG Cluster Discovery and Visualization 357
Figure 13.13 GSOM-based data visualization for sleep apnea data set: (a) resulting map with SF =
0.001; and (b) label map. The numbers shown on the map represent the class label for each node.
Only a majority class renders its name to the node. In case of a draw, the first class encountered is
used as a label.
Figure 13.14 SOM-based data visualization for ECG beat data set: (a) U-matrix; and (b) label map.
The numbers represent the classes assigned to a node (1 → N and 2 → V ).
The GSOM model provided meaningful, user-friendly representations of the
clustering outcomes [see, for example, label maps in Figures 13.12(b) and 13.13(b)].
At the borders of the cluster regions, some neurons, such as neurons A and B,
are incorrectly grouped with other class neurons. These regions, however, can be
P1: Shashi
August 24, 2006 11:56 Chan-Horizon Azuaje˙Book
358 An Introduction to Unsupervised Learning for ECG Classification
Figure 13.15 SOM-based data visualization for sleep apnea data set: (a) U-matrix; and (b) label
map. ‘‘1’’ stands for Class Normal and ‘‘2’’ represents Class Apnea.
further analyzed by applying the GSOM algorithm with a higher SF value. More-
over, due to its self-adaptive properties, the GSOM is able to model the data set
with a relatively small number of neurons. The GSOM model required 56 and 35
neurons for the ECG beat and sleep apnea data sets, respectively. The SOM Tool-
box automatically selected 468 and 224 neurons, respectively, to represent the same
classification problem.
After completing a learning process, the GSOM can develop into different
shapes to reveal the patterns hidden in the data. Such visualization capabilities
may highlight relevant trends and associations in a more meaningful way. For in-
stance, in Figure 13.12(a), the GSOM has branched out in two main directions.
An analysis of the pattern distribution over each branch [see the summary of the
distribution of patterns beside each branch in Figure 13.12(a)] confirms that there
is a dominant class. Thus, 98% of the patterns in Branch A are Class V patterns,
and 97% of the patterns in Branch B belongs to Class N. Using these figures, one
may assume that Branch A is linked to Class V, and Branch B is associated with
P1: Shashi
August 24, 2006 11:56 Chan-Horizon Azuaje˙Book
13.5 Final Remarks 359
Class N. Likewise, in Figure 13.13(a), 97% of the samples in Branch A are Class
Normal patterns, and 82% of the samples in Branch B belong to Class Apnea.
Since the SF controls the map spread, one may also implement multiresolution
and hierarchical clustering on areas of interest. Previous research has shown that
the GSOM may reveal significant clusters by its shape even with a low SF value. A
finer analysis, based on a larger SF value, can be applied to critical areas, such as
those areas categorized as ambiguous. Figure 13.12(a) highlights the main clusters
in the data when using a SF= 0.001. For those areas where it is difficult to differ-
entiate between clusters [such as Branch C in Figure 13.12(a)], a higher SF value
may be applied (e.g., SF = 0.1). Thus, a more understandable map was obtained
(submap C1). This submap has clearly been dispersed in two directions (Sub-
Branches C1 and C2). A similar analysis is carried out on the sleep apnea data
set, as illustrated in Figure 13.13(a). Interestingly, as can be seen from the pattern
distribution in Sub-Branch C2, there is no dominant class in this branch. This might
suggest that the apnea patterns assigned to the Sub-Branch C2 may be related to
Normal patterns. In these cases a closer examination with expert support is required.
13.4.2.2 Cluster Assessment Based on Validity Indices
Cluster validity techniques may be applied to automatically detect relevant parti-
tions. For example, they can be used to identify significant relationships between
branches A and B and subbranches C1 and C2 shown on Figures 13.12(a) and
13.13(a). Based on the combinations of six intercluster distances, i, (single linkage,
complete linkage, average linkage, centroid linkage, combination average linkage
with centroid linkage, and Hausdorff metric [63]) and four intracluster distances, j,
(standard diameter, average distance, centroid distance, and nearest neighbor dis-
tance), Table 13.4 lists 24 Dunn’s-based validity indices for various partitions, which
may be identified in the GSOM maps illustrated in Figures 13.12(a) and 13.13(a).
Bold entries correspond to the optimal validation index values across three parti-
tions. Such values indicate the optimal number of clusters estimated for each appli-
cation. In the case of the ECG beat classification, 18 indices, including the average
index value, favour the partition c = 2, which is further examined in column two,
as the best partition for this data set. The first cluster of this partition is represented
by branches A and C2. The second cluster comprises branches B and C1. This co-
incides with the pattern distributions over these areas. Similarly, for the sleep apnea
data set, 21 indices suggest the partition shown in column 5 as the best choice for
this data set. The description of these partitions is shown in Tables 13.5 and 13.6.
13.5 Final Remarks
Clearly, one cannot expect to do justice to all relevant unsupervised classification
methodologies and applications in a single chapter. Nevertheless, key design and
application principles of unsupervised learning-based analysis for ECG classifica-
tion have been discussed. Emphasis has been placed on advances in clustering-based
approaches for exploratory visualization and classification. In contrast to supervised
learning, traditional unsupervised learning aims to find relevant clusters, categories
P1: Shashi
August 24, 2006 11:56 Chan-Horizon Azuaje˙Book
360 An Introduction to Unsupervised Learning for ECG Classification
Table 13.4 Validity Indices for ECG Beat and Sleep Apnea Data Sets Based on the Resulting
GSOM Maps in Figures 13.12 and 13.13
ECG Beat Data Set Sleep Apnea Data Set
c = 2 c = 2 c = 3 c = 2 c = 2 c = 3
(A + C1, (A + C2, (A,B, (A + C1, (A + C2, (A,B,
V
ij
B + C2) B + C1) C1 + C2) B + C2) B + C1) C1 + C2)
V
11
0.01 0.02 0.01 0.02 0.02 0.02
V
12
0.05 0.06 0.04 0.04 0.05 0.06
V
13
0.03 0.04 0.03 0.03 0.04 0.04
V
14
0.47 0.54 0.42 0.51 0.44 0.47
V
21
1.08 1.24 1.01 1.26 1.31 1.16
V
22
4.55 4.22 3.27 3.25 3.71 3.46
V
23
3.16 2.97 2.24 2.17 2.56 2.41
V
24
45.51 39.27 32.94 36.75 31.92 25.94
V
31
0.29 0.36 0.32 0.49 0.57 0.39
V
32
1.24 1.23 1.04 1.27 1.63 1.15
V
33
0.86 0.86 0.72 0.85 1.12 0.80
V
34
12.45 11.40 10.52 14.35 13.97 8.62
V
41
0.19 0.25 0.21 0.37 0.50 0.29
V
42
0.81 0.87 0.69 0.97 1.42 0.88
V
43
0.56 0.61 0.47 0.65 0.98 0.61
V
44
8.11 8.07 6.99 10.95 12.19 6.58
V
51
0.24 0.30 0.26 0.43 0.54 0.34
V
52
1.04 1.04 0.83 1.11 1.52 1.02
V
53
0.72 0.73 0.57 0.75 1.05 1.02
V
54
10.37 9.63 8.39 12.60 13.07 7.61
V
61
0.14 0.60 0.06 0.62 0.76 0.72
V
62
0.58 2.03 0.19 1.60 2.15 2.14
V
63
0.40 1.43 0.13 1.07 1.48 1.49
V
64
5.80 18.87 1.94 18.11 18.50 16.01
Average
4.11 4.44 3.05 4.59 4.65 3.46
or associations in the absence of prior class knowledge during the learning pro-
cess. One may define it as a knowledge discovery task, which has proven to play a
fundamental role in biomedical decision support and research. In the case of ECG
classification, unsupervised models have been applied to several problems such as
ischemia detection [38], arrhythmia classification [26], and to pattern visualiza-
tion [28, 46].
SANN-based approaches, such as the GSOM introduced in Section 13.4, have
demonstrated advantages over traditional models for supporting ECG cluster dis-
covery and visualization. Instead of using a static grid representation or long lists
Table 13.5 Clustering Description (c = 2) of the Second
Partition for ECG Beat Data Set Using GSOM
Cluster Class V Class N
Branch A + Subbranch C2 1796 42
Branch B + Subbranch C1 204 2958
P1: Shashi
August 24, 2006 11:56 Chan-Horizon Azuaje˙Book
13.5 Final Remarks 361
Table 13.6 Clustering Description (c = 2) of the Second
Partition for Sleep Apnea Data Set Using GSOM
Cluster Class V Class N
Branch A + Subbranch C2 198 791
Branch B + Subbranch C1 802 209
of numbers to describe partitions, the GSOM is able to reflect relevant groups in
the data by its incrementally generated topology. Such structure provides the ba-
sis for user-friendly visualization platforms to support the detection of relevant
patterns. By introducing a spread factor, multiresolution and hierarchical cluster-
ing may also be implemented. Although the data sets analyzed in this chapter only
contain two classes, results published elsewhere [46] have demonstrated the GSOM
model’s ability to support multiple-class prediction problems in related biomedical
domains.
SANN-based clustering techniques also exhibit important limitations. Poten-
tially irrelevant neurons or connections are commonly found and removed by mod-
els such as the GCS and IGG during a learning process. This advantage, however,
may be achieved at the expense of robustness. It has been shown that IGG and GCS
are susceptible to variations in initial parameter settings [41, 57] in comparison
to the original SOM. Moreover, in the case of the GSOM there are no deletion
steps involved in its learning process. Instead of calculating the exact position of
the new neurons, the GSOM generates new neurons in all free neighboring position.
Unfortunately, such an approach will inevitably generate dummy neurons, which
sometimes can severely degrade the visualization ability of GSOM models. Thus,
additional research on the incorporation of pruning algorithms into the GSOM
growing process is needed.
It is worth noting that for the same data set and clustering model different
results may be obtained for different parameter settings. There is no standard to
determine a priori the optimal input parameters, such as the learning rate in the
SOM and the spread factor in the GSOM. Techniques for the automatic and dynamic
determination of optimum combinations of learning parameters also deserve further
investigations.
Given the diversity of unsupervised learning algorithms available and the in-
existence of universal clustering solutions for ECG classification, it is important to
understand critical factors that may influence the choice of appropriate clustering
techniques. Thus, it is crucial to be aware of key factors that may influence the
selection of clustering algorithms, such as the statistical nature of the problem do-
main under study and constraints defined by the user and the clustering options
available [14]. A single clustering algorithm may not always perform well for dif-
ferent types of data sets. Therefore, the application of more than one clustering
model is recommended to facilitate the generation of more meaningful and reliable
results [13, 14].
An advanced generation of unsupervised learning systems for ECG classifica-
tion should also offer improvements in connection to information representation
and the assessment of classification results. Ideally, an ECG classification platform
should be capable of processing multiple information sources. In today’s distributed
P1: Shashi
August 24, 2006 11:56 Chan-Horizon Azuaje˙Book
362 An Introduction to Unsupervised Learning for ECG Classification
healthcare environment, ECG data are commonly stored and analyzed using dif-
ferent formats and software tools. Thus, there is a need to develop cross-platform
solutions to support data analysis tasks and applications [64]. A relevant solution
consists of applying eXtensible Markup Language (XML) for representing ECG
information. ecgML [65], a markup language for ECG data acquisition and analy-
sis, has been designed to illustrate the advantages offered by XML for supporting
data exchange between different ECG data acquisition and analysis devices. Such
representation approaches may facilitate data mining using heterogeneous software
platforms. The data and metadata contained in an ecgML record may be useful to
support both supervised and unsupervised ECG classification applications. It is also
crucial to expand our understanding of how to evaluate the quality of unsupervised
classification models. This chapter introduced two useful cluster assessment
approaches: cluster validity indices and class representation significance tests. Even
when such strategies may provide users with measures of confidence or reliability, it
is also important to consider domain-specific constraints and assumptions, as well
as human expert support [36]. In comparison to supervised classification, the eval-
uation of outcomes in clustering-based analysis may be a more complex task. It is
expected that more tools for unsupervised classification validation and interpreta-
tion will be available. One basic evaluation principle consists of using the resulting
clusters to classify samples (e.g., sections of signals) unseen during the learning pro-
cess [66]. Thus, if a set of putative clusters reflects the true structure of the data,
then a prediction model based on these clusters and tested on novel samples should
perform well. A similar strategy was adopted in [26] to quantitatively assess the
quality of clustering results. Other advances include the application of supervised
learning to evaluate unsupervised learning outcomes [67], which are not discussed
here due to space constraints.
Finally, it should be emphasized that unsupervised models may also be adapted
to perform supervised classification applications. Based on the same principle of
the supervised SOM model, for example, a supervised version of the GSOM algo-
rithm has been proposed [45]. Nevertheless, performing supervised classification
using methods based on unsupervised learning should not be seen as a fundamental
goal. The strengths of unsupervised learning are found in exploratory, visualization-
driven classification tasks such as the identification of relevant groups and outlier
detection. Unsupervised (clustering-based) learning is particularly recommended to
obtain an initial understanding of the data. Thus, these models may be applied as
a first step to uncover relevant relationships between signals and groups of signals,
which may assist in a meaningful and rigorous selection of further analytical steps,
including supervised learning techniques [19, 56].
References
[1] Nugent, C. D., J. A. Webb, and N. D. Black, “Feature and Classifier Fusion for 12-Lead
ECG Classification,” Medical Informatics and the Internet in Medicine, Vol. 25, No. 3,
July–September 2000, pp. 225–235.
[2] Gao, D., et al., “Arrhythmia Identification from ECG Signals with a Neural Network
Classifier Based on a Bayesian Framework,” 24th SGAI International Conference on
Innovative Techniques and Applications of Artificial Intelligence, 2004.
P1: Shashi
August 24, 2006 11:56 Chan-Horizon Azuaje˙Book
13.5 Final Remarks 363
[3] de Chazal, P., M. O’Dwyer, and R. B. Reilly, “Automatic Classification of Heartbeats
Using ECG Morphology and Heartbeat Interval Features,” IEEE Trans. Biomed. Eng.,
Vol. 51, No. 7, 2004, pp. 1196–1206.
[4] Georgeson, S., and H. Warner, “Expert System Diagnosis of Wide Complex Tachycardia,”
Proc. of Computers in Cardiology 1992, 1992, pp. 671–674.
[5] Coast, D. A., et al., “An Approach to Cardiac Arrhythmia Analysis Using Hidden Markov
Models,” IEEE Trans. Biomed. Eng., Vol. 37, No. 9, 1990, pp. 826–836.
[6] Silipo, R., and C. Marchesi, “Artificial Neural Networks for Automatic ECG Analysis,”
IEEE Trans. on Signal Processing, Vol. 46, No. 5, 1998, pp. 1417–1425.
[7] Bortolan, G., and J. L. Willems, “Diagnostic ECG Classification Based on Neural Net-
works,” Journal of Electrocardiology, Vol. 26, No. Suppl: 1993, pp. 75–79.
[8] Osowski, S., L. T. Hoai, and T. Markiewicz, “Support Vector Machine-Based Expert
System for Reliable Heartbeat Recognition,” IEEE Trans. Biomed. Eng., Vol. 51, No. 4,
2004, pp. 582–589.
[9] Jain, A. K., M. N. Murty, and P. J. Flynn, “Data Clustering: A Review,” ACM Computing
Surveys, Vol. 31, No. 3, 1999, pp. 264–323.
[10] Su, M. S., and C. H. Chou, “A Modified Version of the k-Means Algorithm with a Distance
Based on Cluster Symmetry,” IEEE Trans. on Pattern Analysis and Machine Intelligence,
Vol. 23, No. 6, 2001, pp. 674–680.
[11] Jagadish, H. V., et al., “Similarity-Based Queries,” Proc. of the 14th ACM SIGACT-
SIGMOD-SIGART Symposium on Principles of Database Systems (PODS’95), ACM
Press, 1995, pp. 36–45.
[12] Kalpakis, K., D. Gada, and V. Puttagunta, “Distance Measures for Effective Clustering of
ARIMA Time-Series,” Proc. of the 2001 IEEE International Conference on Data Mining
(ICDM’01), 2001, pp. 273–280.
[13] Azuaje, F., “Clustering-Based Approaches to Discovering and Visualising Microarray Data
Patterns,” Brief Bioinform., Vol. 4, No. 1, 2003, pp. 31–42.
[14] Azuaje, F., and N. Bolshakova, “Clustering Genomic Expression Data: Design and Evalu-
ation Principles,” in D. Berrar, W. Dubitzky, and M. Granzow, (eds.), Understanding and
Using Microarray Analysis Techniques: A Practical Guide, London, U.K.: Springer, 2002,
pp. 230–245.
[15] Monti, S., et al., “Consensus Clustering: A Resampling-Based Method for Class Discovery
and Visualization of GENE Expression Microarray Data,” Machine Learning, Vol. 52,
No. 1–2, 2003, pp. 91–118.
[16] Sommer, D., and M. Golz, “Clustering of EEG-Segments Using Hierarchical Agglmerative
Methods and Self-Organizing Maps,” Proc. of Int. Conf. Artificial Intelligent Networks
2001, 2001, pp. 642–649.
[17] Ding, C., and X. He, “Cluster Merging and Splitting in Hierarchical Clustering Algo-
rithms,” Proc. of 2002 IEEE International Conference on Data Mining (ICDM’02), 2002,
pp. 139–146.
[18] Maulik, U., and S. Bandyopadhyay, “Performance Evaluation of Some Clustering Algo-
rithms and Validity Indices,” IEEE Trans. on Pattern Analysis and Machine Intelligence,
Vol. 24, No. 12, 2002, pp. 1650–1654.
[19] Kohonen, T., Self-Organizing Maps, Berlin: Springer, 1995.
[20] Tamayo, P., et al., “Interpreting Patterns of Gene Expression with Self-Organizing
Maps: Methods and Application to Hematopoietic Differentiation,” Proc. of National
Academy of Sciences of the United States of America, Vol. 96, No. 6, 1999, pp. 2907–
2912.
[21] Vesanto, J., “SOM-Based Data Visualization Methods,” Intelligent Data Analysis, Vol. 3,
No. 2, 1999, pp. 111–126.
[22] Ultsch, A., and H. P. Siemon, “Kohonen’s Self Organizing Feature Maps for Exploratory
Data Analysis,” Proc. of Int. Neural Network Conf. (INNC’90), 1990, pp. 305–308.
P1: Shashi
August 24, 2006 11:56 Chan-Horizon Azuaje˙Book
364 An Introduction to Unsupervised Learning for ECG Classification
[23] Vesanto, J., et al., “Self-Organizing Map in Matlab: The SOM Toolbox, Proc. of the
Matlab DSP Conference 1999, 1999, pp. 35–40.
[24] Gaetz, M., et al., “Self-Organizing Neural Network Analyses of Cardiac Data in Depres-
sion,” Neuropsychobiology, Vol. 49, No. 1, 2004, pp. 30–37.
[25] Simelius, K., et al., “Spatiotemporal Characterization of Paced Cardiac Activation with
Body Surface Potential Mapping and Self-Organizing Maps,” Physiological Measurement,
Vol. 24, No. 3, 2003, pp. 805–816.
[26] Lagerholm, M., et al., “Clustering ECG Complexes Using Hermite Functions and Self-
Organizing Maps,” IEEE Trans. Biomed. Eng., Vol. 47, No. 7, 2000, pp. 838–848.
[27] Bortolan, G., and W. Pedrycz, “An Interactive Framework for an Analysis of ECG Signals,”
Artificial Intelligence in Medicine, Vol. 24, No. 2, 2002, pp. 109–132.
[28] Nishizawa, H., et al., “Hierarchical Clustering Method for Extraction of Knowledge
from a Large Amount of Data,” Optical Review, Vol. 6, No. 4, July-August 1999,
pp. 302–307.
[29] Maier, C., H. Dickhaus, and J. Gittinger, “Unsupervised Morphological Classification of
QRS Complexes,” Proc. of Computers in Cardiology 1999, 1999, pp. 683–686.
[30] Boudaoud, S., et al., “Integrated Shape Averaging of the P-Wave Applied to AF Risk
Detection,” Proc. of Computers in Cardiology 2003, 2003, pp. 125–128.
[31] Rauber, A., Visualization in Unsupervised Neural Network, M. S. thesis, Technische Uni-
versit
¨
at Wien, Austria, 1996,
[32] Kasuba, T., “Simplified Fuzzy ARTMAP,” AI Expert, Vol. 8, 1993, pp. 19–25.
[33] Rajasekaran, S., and G. A. V. Pai, “Image Recognition Using Simplified Fuzzy ARTMAP
Augmented with a Moment Based Feature Extractor,” International Journal of Pattern
Recognition and Artificial Intelligence, Vol. 14, No. 8, 2000, pp. 1081–1095.
[34] Mavroudi, S., S. Papadimitriou, and A. Bezerianos, “Gene Expression Data Analysis with
a Dynamically Extended Self-Organized Map that Exploits Class Information,” Bioinfor-
matics, Vol. 18, No. 11, 2002, pp. 1446–1453.
[35] Downs, J., et al., “Application of the Fuzzy ARTMAP Neural Network Model to Medical
Pattern Classification Tasks,” Artificial Intelligence in Medicine, Vol. 8, No. 4, 1996,
pp. 403–428.
[36] Hudson, D. L., and M. E. Cohen, Neural Networks and Artificial Intelligence for Biomed-
ical Engineering, New York: IEEE Press, 2000.
[37] Hudson, D. L., et al., “Medical Diagnosis and Treatment Plans from a Hybrid Expert
System,” in A. Kandel and G. Langholtz, (eds.), Hybrid Architectures for Intelligent
Systems, Boca Raton, FL: CRC Press, 1992, pp. 330–344.
[38] Papadimitriou, S., et al., “Ischemia Detection with a Self-Organizing Map Supplemented
by Supervised Learning,” IEEE Trans. on Neural Networks, Vo., 12, No. 3, 2001, pp. 503–
515.
[39] Hu, Y. H., S. Palreddy, and W. J. Tompkins, “A Patient-Adaptable ECG Beat Classifier
Using a Mixture of Experts Approach,” IEEE Trans. Biomed. Eng., Vol. 44, No. 9, 1997,
pp. 891–900.
[40] Fritzke, B., “Growing Cell Structures—A Self-Organizing Network for Unsupervised and
Supervised Learning,” Neural Networks, Vol. 7, No. 9, 1994, pp. 1441–1460.
[41] Blackmore, J., “Visualising High-Dimensional Structure with the Incremental Grid Grow-
ing Neural Network,” Proc. of 12th Intl. Conf. on Machine Learning, 1995, pp. 55–63.
[42] Dopazo, J., and J. M. Carazo, “Phylogenetic Reconstruction Using an Unsupervised Grow-
ing Neural Network That Adopts the Topology of a Phylogenetic Tree,” Journal of Molec-
ular Evolution, Vol. 44, No. 2, 1997, pp. 226–233.
[43] Herrero, J., A. Valencia, and J. Dopazo, “A Hierarchical Unsupervised Growing Neural
Network for Clustering Gene Expression Patterns,” Bioinformatics, Vol. 17, No. 2, 2001,
pp. 126–136.
P1: Shashi
August 24, 2006 11:56 Chan-Horizon Azuaje˙Book
13.5 Final Remarks 365
[44] Wang, H. C., et al., “Self-Organizing Tree-Growing Network for the Classification of
Protein Sequences,” Protein Science, Vol. 7, No. 12, 1998, pp. 2613–2622.
[45] Wang, H., F. Azuaje, and N. Black, “Improving Biomolecular Pattern Discovery and Visu-
alization with Hybrid Self-Adaptive Networks,” IEEE Trans. on Nanobioscience, Vol. 1,
No. 4, 2002, pp. 146–166.
[46] Wang, H., F. Azuaje, and N. Black, “An Integrative and Interactive Framework for Im-
proving Biomedical Pattern Discovery and Visualization,” IEEE Trans. on Information
Technology in Biomedicine, Vol. 8, No. 1, 2004, pp. 16–27.
[47] Halkidi, M., Y. Batistakis, and M. Vazirgiannis, “On Clustering Validation Techniques,”
Journal of Intelligent Information Systems, Vol. 17, No. 2–3, 2001, pp. 107–145.
[48] Dunn, J. C., “A Fuzzy Relative of the ISODATA Process and Its Use in Detecting Compact
Well-Separated Clusters,” J. Cybernetics, Vol. 3, No. 3, 1973, pp. 95–104.
[49] Rousseeuw, P. J., “Silhouettes—A Graphical Aid to the Interpretation and Validation of
Cluster-Analysis,” Journal of Computational and Applied Mathematics, Vol. 20, 1987,
pp. 53–65.
[50] Milligan, G. W., and M. C. Cooper, “An Examination of Procedures for Determining the
Number of Clusters in a Data Set,” Psychometrika, Vol. 50, No. 2, 1985, pp. 159–179.
[51] Halkidi, M., and M. Vazirgiannis, “Clustering Validity Assessment: Finding the Optimal
Partitioning of a Data Set,” Proc. of IEEE International Conference on Data Mining
(ICDM’01), 2001, pp. 187–194.
[52] Bezdek, J. C., and N. R. Pal, “Some New Indexes of Cluster Validity,” IEEE
Trans. on Systems, Man and Cybernetics, Part B-Cybernetics, Vol. 28, No. 3, 1998,
pp. 301–315.
[53] Bock, H. H., “On Some Significance Tests in Cluster Analysis,” Journal of Classification,
Vol. 2, No. 1, 1985, pp. 77–108.
[54] Tavazoie, S., et al., “Systematic Determination of Genetic Network Architecture,” Nature
Genetics, Vol. 22, 1999, pp. 281–285.
[55] Levine, E., and E. Domany, “Resampling Method for Unsupervised Estimation of Cluster
Validity,” Neural Computation, Vol. 13, No. 11, 2001, pp. 2573–2593.
[56] Alahakoon, D., S. K. Halgamuge, and B. Srinivasan, “Dynamic Self-Organizing Maps
with Controlled Growth for Knowledge Discovery,” IEEE Trans. on Neural Networks,
Vol. 11, No. 3, 2000, pp. 601–614.
[57] Kohle, M., and D. Merkl, “Visualising Similarities in High Dimensional Input Spaces
with a Growing and Splitting Neural Network,” Proc. of Int. Conf. of Artificial Neural
Networks (ICANN’96), 1996, pp. 581–586.
[58] Goldberger, A. L., et al., “PhysioBank, PhysioToolkit, and PhysioNet: Components of a
New Research Resource for Complex Physiologic Signals,” Circulation, Vol. 101, No. 23,
2000, pp. E215–E220.
[59] Lichstein, E., et al., “Characteristics of Ventricular Ectopic Beats in Patients with Ven-
tricular Tachycardia: A 24-Hour Holter Monitor Study,” Chest, Vol. 77, No. 6, 1980,
pp. 731–735.
[60] Hu, Y. H., “ECG Beat Classification Data File, December 31, 2003,” c.
edu/ece539/data/ecg/.
[61] Rosenblum, M. G., et al., “Scaling Behaviour of Heartbeat Intervals Obtained by Wavelet-
Based Time-Series Analysis,” Nature, Vol. 383, 1996, pp. 323–327.
[62] Mietus, J. E., et al., “Detection of Obstructive Sleep Apnea from Cardiac Interbeat Interval
Time Series,” Proc. of Computers in Cardiology 2000, 2000, pp. 753–756.
[63] Preparata, F. P., and M. I. Shamos, Computational Geometry: An Introduction, New York:
Springer-Verlag, 1985.
[64] Varri, A., et al., “Standards for Biomedical Signal Databases,” IEEE Engineering in
Medicine and Biology Magazine, Vol. 20, No. 3, 2001, pp. 33–37.
P1: Shashi
August 24, 2006 11:56 Chan-Horizon Azuaje˙Book
366 An Introduction to Unsupervised Learning for ECG Classification
[65] Wang, H., et al., “A Markup Language for Electrocardiogram Data Acquisition and Anal-
ysis (ecgML),” BMC Medical Informatics and Decision Making, Vol. 3, No. 1, 2003, p. 4.
[66] Golub, T. R., et al., “Molecular Classification of Cancer: Class Discovery and Class Predic-
tion by Gene Expression Monitoring,” Science, Vol. 286, No. 5439, 1999, pp. 531–537.
[67] Roiger, R., and M. Geatz, Data Mining: A Tutorial-Based Primer, Reading, MA: Addison-
Wesley, 2003.
P1: Shashi
September 4, 2006 11:49 Chan-Horizon Azuaje˙Book
About the Authors
Gari D. Clifford received a B.Sc. in physics and electronics from Exeter Univer-
sity, Devon, United Kingdom, an M.Sc. in mathematics and theoretical physics
from Southampton University, Southampton, United Kingdom, and a Ph.D. in neu-
ral networks and biomedical engineering from Oxford University, Oxford, United
Kingdom, in 1992, 1995, and 2003, respectively. He has worked in industry on
the design and production of several C
- and FDA-approved medical devices.
Dr. Clifford is currently a research scientist in the Harvard-MIT Division of Health
Sciences where he is the engineering manager of an R01 NIH-funded research pro-
gram, “Integrating Data, Models, and Reasoning in Critical Care,” and a major
contributor to the well-known PhysioNet Research Resource. He has taught at
Oxford, MIT, and Harvard and is currently an instructor in biomedical engineering
at MIT. Dr. Clifford, a senior member of the IEEE, has authored and coauthored
more than 40 publications in the field of biomedical engineering. Dr. Clifford is
on the editorial boards of BioMedical Engineering OnLine and the Journal of Bio-
logical Systems. His research interests include multidimensional biomedical signal
processing, linear and nonlinear time series analysis, relational database mining,
decision support, and mathematical modeling of the ECG and the cardiovascular
system.
Francisco Azuaje focuses his research on the areas at the intersection of com-
puter science and life sciences. It comprises machine and statistical learning methods
to support predictive data analysis and visualization in biomedical informatics and
postgenome informatics. He has extensively published in journals, books, and con-
ference proceedings in the areas of medical informatics, computational intelligence,
and bioinformatics. He is a senior member of the IEEE. He has several editorial
board memberships in journals relevant to biomedical informatics and bioinformat-
ics. Dr. Azuaje has coedited two other books relevant to the areas of bioinformatics
and systems biology.
Patrick E. McSharry received a B.A. in theoretical physics in 1993 and an M.Sc.
in electronic and electrical engineering in 1995 from Trinity College, Dublin. He
was awarded a Marie Curie Research Fellowship in 1995 and received a Ph.D. in
mathematics, on time series analysis and forecasting, from the University of Oxford
in 1999. He is currently a Royal Academy of Engineering/EPSRC research fellow
at the University of Oxford, a research associate at St. Catherine’s College, and a
senior member of the IEEE. His research interests include biomedical engineering,
complex dynamical systems, signal processing, systems biology, risk management,
operations research, and forecasting.
Andrew T. Reisner received a B.S. in mechanical engineering and biological
sciences from Stanford University, in 1992, and an M.D. from Harvard Medi-
cal School, in 1997, and trained in emergency medicine at the Harvard-affiliated
Emergency Medicine Residency program. He is presently an attending physician
367
P1: Binod
September 8, 2006 10:44 Chan-Horizon Azuaje˙Book
368 About the Authors
at Massachusetts General Hospital in the Department of Emergency Medicine, an
instructor at Harvard Medical School, and a visiting scientist at MIT. Dr. Reisner’s
research is oriented toward the intersection of diagnostic expert systems, medical
sensor technology, and the clinical problem of circulatory shock.
Roger G. Mark is the Distinguished Professor of Health Sciences & Technology
and Professor of Electrical Engineering at MIT. He is a coprincipal investigator of the
Research Resource for Complex Physiologic Signals. Dr. Mark served as the codi-
rector of the Harvard-MIT Division of Health Sciences & Technology from 1985
to 1996. Dr. Mark’s research activities include physiological signal processing and
database development, cardiovascular modeling, and intelligent patient monitoring.
He led the group that developed the MIT-BIH Arrhythmia Database.
Franc Jager received a B.Sc. and an M.Sc. in electrical engineering from the
University of Ljubljana in 1980 and 1984, respectively. In 1994, he received a Ph.D.
in computer and information science from the University of Ljubljana. Between
1990 and 1991, he was a visiting scientist the MIT. Currently, he is a full professor
in the Faculty of Computer and Information Science at the University of Ljubljana
and is a research affiliate at MIT. In 1995 Dr. Jager established the Laboratory
for Biomedical Computer Systems and Imaging at the University of Ljubljana. His
research interests include biomedical signal processing, and medical imaging, and
biomedical computer systems.
Matt B. Oefinger earned B.Sc. degrees from Southern Methodist University
in electrical engineering, computer science, and applied mathematics, graduating
summa cum laude in all areas. After working at Texas Instruments for a year,
Mr. Oefinger matriculated at MIT, where he earned an M.Sc. in electrical engineer-
ing and continues doctoral work on automated ST segment analysis.
Nicholas P. Hughes is a postdoctoral research assistant in the Department of
Engineering Science at the University of Oxford and is the W. W. Spooner Junior
Research Fellow in Engineering at New College, Oxford. He holds an M.Eng. in
engineering and computing science from St. Hugh’s College, Oxford, and an M.Sc.
by research in pattern analysis and neural networks from Aston University. His
D.Phil. research concerned the development of probabilistic models for automated
ECG interval analysis, with a particular focus on the accurate measurement and
assessment of the QT interval for clinical drug trials. Dr. Hughes’ postdoctoral
research is focused on a number of problems at the interface of information engi-
neering and the biomedical sciences. In particular, he is currently developing new
techniques for assessing brain activity based on the integration of fMRI and EEG
data.
Haiying Wang received a B.Eng. and an M.Sc. in optical electronics engi-
neering from Zhejiang University, Hangzhou, China, in 1987 and 1989, respec-
tively, and a Ph.D. from the University of Ulster, United Kingdom, in 2004. He
is currently a postdoctoral research fellow in the faculty of engineering at the
University of Ulster. His research focuses on artificial intelligence, machine learning,
data mining, pattern discovery and visualization, neural networks, XML, and their
applications in medical informatics and bioinformatics. He has published several
publications in scientific journals, books, and conference proceedings relating to
the areas at the intersection of computer science and life science.
P1: Shashi
September 4, 2006 11:49 Chan-Horizon Azuaje˙Book
About the Authors 369
Raquel Bail
´
on received an M.Sc. in telecommunications engineering from the
University of Zaragoza in 2001. In 2001 she started her Ph.D. degree studies at
the Department of Electronic Engineering and Communications at University of
Zaragoza with a grant supported by the Spanish government. Since 2003, she has
been an assistant professor in the same department. Her main research activity
lies in the field of biomedical signal processing, especially in the analysis of the
electrocardiogram for diagnosis purposes.
Pablo Laguna received an M.S. and a Ph.D. in physics from the Science Faculty
at the University of Zaragoza, Spain, in 1985 and 1990, respectively. His Ph.D. thesis
was developed at the Biomedical Engineering Division of the Institute of Cybernetics
(U.P.C C.S.I.C.) under the direction of Pere Caminal. He is a full professor of
signal processing and communications in the department of electrical engineering
at the Engineering School, and a researcher at the Arag
´
on Institute for Engineering
Research (I3A), both at University of Zaragoza, Spain. From 1992 to 2005 he was
an associate professor at the same university and from 1987 to 1992 he worked as
assistant professor of automatic control in the Department of Control Engineering
at the Politecnic University of Catalonia (U.P.C.), Spain, and as a researcher at the
Biomedical Engineering Division of the Institute of Cybernetics (U.P.C C.S.I.C.).
His professional research interests are in signal processing, particularly applied to
biomedical applications. He is the coauthor of Bioelectrical Signal Processing in
Cardiac and Neurological Applications (Elsevier, 2005).
Leif S
¨
ornmo received an M.S.E.E. and a Ph.D. in electrical engineering from
Lund University, Lund, Sweden, in 1978 and 1984, respectively. He is presently
a professor in the Signal Processing Group in the area of biomedical signal pro-
cessing. He held a position at Department of Clinical Physiology, Lund University,
from 1983 to 1995. His main research interests include statistical signal processing
and modeling of biomedical signals. Current research projects include applications
in atrial fibrillation, hemodialysis, high-resolution ECG analysis, power efficient
signal processing in pacemakers, and detection of otoacoustic emissions. He is
an author of Bioelectrical Signal Processing in Cardiac and Neurological Appli-
cations (Elsevier, 2005). Dr. S
¨
ornmo was on the editorial board of Computers in
Biomedical Research from 1997 to 2000. Since 2001, he has been an associate ed-
itor of IEEE Transactions on Biomedical Engineering. He is also on the editorial
boards of Journal of Electrocardiology and Medical and Biological Engineering &
Computing.
Sanjiv M. Narayan is the director of electrophysiology at the San Diego Veterans
Affairs Medical Center, the codirector of the Electrophysiology Fellowship training
program at the University of California, San Diego, and a member of the Whitaker
Institute for Biomedical Engineering. Since 1996, Dr. Narayan has conducted re-
search on normal and abnormal repolarization dynamics, their link with mechani-
cal deformation of the heart and ventricular arrhythmias, and, via a grant from the
National Institutes of Health, their relationship with T wave alternans. Dr. Narayan
has also conducted studies that explore the contribution of repolarization abnormal-
ities to the interface between atrial fibrillation and flutter, to better understand their
pathophysiology and for improved ECG diagnosis. Dr. Narayan received his medi-
cal degree, master’s degree in computer science, and doctoral degree in neuroscience