Báo cáo y học: "Use of a multi-virus array for the study of human viral and retroviral pathogens: gene expression studies and ChIP-chip analysis" pot
Bạn đang xem bản rút gọn của tài liệu. Xem và tải ngay bản đầy đủ của tài liệu tại đây (1.57 MB, 15 trang )
BioMed Central
Page 1 of 15
(page number not for citation purposes)
Retrovirology
Open Access
Research
Use of a multi-virus array for the study of human viral and retroviral
pathogens: gene expression studies and ChIP-chip analysis
Elodie Ghedin
†1,2
, Anne Pumfery
†3
, Cynthia de la Fuente
3
, Karen Yao
4
,
Naomi Miller
1
, Vincent Lacoste
3
, John Quackenbush
1
, Steven Jacobson
4
and
Fatah Kashanchi*
1,3
Address:
1
The Institute for Genomic Research, Rockville, Maryland 20850, USA,
2
Department of Microbiology and Tropical Medicine, The George
Washington University, Washington, District of Columbia 20037, USA,
3
Department of Biochemistry and Molecular Biology, The George
Washington University, Washington, District of Columbia 20037, USA and
4
Viral Immunology Section, NINDS/NIH, Bethesda, Maryland 20892,
USA
Email: Elodie Ghedin - ; Anne Pumfery - ; Cynthia de la Fuente - ;
Karen Yao - ; Naomi Miller - ; ;
John Quackenbush - ; Steven Jacobson - ; Fatah Kashanchi* -
* Corresponding author †Equal contributors
Abstract
Background: Since the discovery of human immunodeficiency virus (HIV-1) twenty years ago,
AIDS has become one of the most studied diseases. A number of viruses have subsequently been
identified to contribute to the pathogenesis of HIV and its opportunistic infections and cancers.
Therefore, a multi-virus array containing eight human viruses implicated in AIDS pathogenesis was
developed and its efficacy in various applications was characterized.
Results: The amplified open reading frames (ORFs) of human immunodeficiency virus type 1,
human T cell leukemia virus types 1 and 2, hepatitis C virus, Epstein-Barr virus, human herpesvirus
6A and 6B, and Kaposi's sarcoma-associated herpesvirus were spotted on glass slides and
hybridized to DNA and RNA samples. Using a random priming method for labeling genomic DNA
or cDNA probes, we show specific detection of genomic viral DNA from cells infected with the
human herpesviruses, and effectively demonstrate the inhibitory effects of a cellular cyclin
dependent kinase inhibitor on viral gene expression in HIV-1 and KSHV latently infected cells. In
addition, we coupled chromatin immunoprecipitation with the virus chip (ChIP-chip) to study
cellular protein and DNA binding.
Conclusions: An amplicon based virus chip representing eight human viruses was successfully
used to identify each virus with little cross hybridization. Furthermore, the identity of both viruses
was correctly determined in co-infected cells. The utility of the virus chip was demonstrated by a
variety of expression studies. Additionally, this is the first demonstrated use of ChIP-chip analysis
to show specific binding of proteins to viral DNA, which, importantly, did not require further
amplification for detection.
Published: 25 May 2004
Retrovirology 2004, 1:10
Received: 16 April 2004
Accepted: 25 May 2004
This article is available from: />© 2004 Ghedin et al; licensee BioMed Central Ltd. This is an Open Access article: verbatim copying and redistribution of this article are permitted in all
media for any purpose, provided this notice is preserved along with the article's original URL.
Retrovirology 2004, 1 />Page 2 of 15
(page number not for citation purposes)
Background
Microarray technology, developed in the wake of various
genome projects, has increasingly become one of the most
widely used functional genomic tools. Global gene
expression arrays, in a single co-hybridization assay, can
query the differing expression patterns of thousands of
genes [1,2]. Differential gene expression can be measured
by treating identical cells with different stimuli, such as
drug treatment or cellular stress, or by analyzing related
but distinct cells/tissues, for example normal tissue versus
malignant tumors [1,2]. More recently, microarrays have
shown great potential for clinical applications as well,
including diagnosis of disease states, viral or bacterial sub-
typing, and even virus discovery [3-5].
Moreover, increasing attention is also being paid to the
identification of viral genes expressed during latent and/
or lytic infection as targets for the development of antivi-
ral treatments, an approach that has proven successful for
the herpesviruses [6-9]. A viral microarray comprised of
spotted amplicons from the open reading frames (ORFs)
of a number of different viruses would have distinct
advantages over conventional technologies, including
Enzyme Linked Immunosorbent Assay (ELISA) and
Northern blot analysis that do not allow for simultaneous
multi-target analysis.
To determine whether a multi-virus microarray had
potential in specific applications, for instance viral gene
expression inhibition studies and protein-DNA binding
experiments, we developed and characterized an array
containing the amplified ORFs of eight human viruses.
These include human immunodeficiency virus type 1
(HIV-1), human T cell leukemia virus types 1 and 2
(HTLV-I and -II), hepatitis C virus (HCV), Epstein-Barr
virus/human herpesvirus 4 (EBV/HHV-4), human herpes-
virus 6A and 6B (HHV-6A and -6B), and Kaposi's sar-
coma-associated herpesvirus/human herpesvirus 8
(KSHV/HHV-8). These viruses were chosen for their
importance in AIDS and AIDS-associated diseases. In
addition, these viruses vary widely in their pathogenesis,
including high (EBV, HHV-6A, HHV-6B, and KSHV) and
low copy number (HIV-1, HTLV-I, and HTLV-II); differing
viral expression during latent and lytic infection (herpes-
viruses); low (HCV) versus high (HTLV-I) replication rate;
and representing both DNA (herpesviruses) and RNA
(HTLV-I, HTLV-II, HIV-1 and HCV) genomes. Our hope
was that by demonstrating the feasibility and applicability
for a single microarray representing diverse, pathogeni-
cally important viruses, we would set the stage for a wide
range of applications ranging from multiple virus detec-
tion to functional studies. In addition, larger arrays con-
sisting of more viruses could easily be developed based on
the data generated from this first-generation virus array.
Most DNA arrays are designed for the analysis of thou-
sands of genes representing a single species. We chose to
construct a virus chip for the detection of various human
viruses and demonstrate that this technique can address
complex problems in virology. We demonstrate that we
can detect, with great specificity, genomic viral DNA from
cells infected with the human herpesviruses, EBV, KSHV,
HHV-6A, and HHV-6B. We further demonstrate that we
can induce and observe viral gene expression in HIV-1 and
KSHV latently infected cells, and that we can use this chip
to detect inhibition of HIV and KSHV gene expression
when subjecting infected cells to a cyclin dependent
kinase inhibitor. In addition, we used the virus chip for
new applications such as chromatin immunoprecipita-
tion (ChIP) followed by hybridization to the virus chip
(ChIP-chip) and observed specific hybridization of KSHV
DNA. Importantly, we were able to detect immunoprecip-
itated DNA from latently infected as well as induced cells
by direct labeling of immunoprecipitated DNA without
further PCR amplification.
Results and discussion
Design of the virus chip
Microarray technology allows the analysis of thousands of
genes in a single assay. Although most DNA arrays are
designed to represent a single species, we chose to con-
struct a comprehensive array representing the annotated
open reading frames of eight human viruses that are often
associated with AIDS: HIV-1, HTLV-I, HTLV-II, HHV-6A,
HHV-6B, EBV, KSHV, and HCV. In doing so, we hoped to
be able to simultaneously detect the presence of these
viruses while monitoring their patterns of gene expres-
sion. As a means of quality control, we also included
thirty-one human sequences; 29 control cDNA clones
obtained from a human EST library and glyceraldehyde-3-
phosphate dehydrogenase exon 7 as well as
β
-actin exon 3.
Although there are advantages in using oligonucleotides
(oligos) over PCR products (amplicons) for the construc-
tion of DNA microarrays [10,11], we chose to use ampli-
cons for a number of reasons. First, viral genomes are
compact enough that it is comparatively easy to cover the
entire genome, including both coding and non-coding
regions, with a small number of PCR amplification reac-
tions. This has a significant cost advantage compared to
oligo synthesis. Second, although oligos offer the possibil-
ity of greater specificity, the ability of longer products to
hybridize effectively despite some number of mismatches
can be an advantage for viruses that exhibit a relatively
high mutation rate and for the detection of virus strains
from related families. One potential drawback of PCR is
that, in certain cases, due to either the size of the gene to
be amplified, its nucleotide composition, or other factors,
amplification may be unsuccessful. For example, in our
virus chip, primers could not be designed for 15 of the 86
Retrovirology 2004, 1 />Page 3 of 15
(page number not for citation purposes)
EBV ORFs due to their repetitive nature. However, these
genes may also prove difficult for long oligo designs as the
repeats may pose similar problems. Overall, we were able
to successfully amplify and array probes representing 254
to 264 of the 329 (>75%) ORFs within our eight target
viruses.
PCR primer sets were generated for all specific viral open
reading frames (see Additional file 1). Primers were
designed using the Primer 3.0 program [12] with default
parameters. Primers were selected such that there was no
overlap between amplified regions, which ranged in size
from 100 bp to 3.5 kbp; larger ORFs were represented by
up to four amplicons. Following amplification, PCR prod-
ucts were analyzed by gel electrophoresis. Amplifications
were repeated for reactions that failed to give a single
product of the appropriate size. Failed amplifications
resulting in multiple bands, or in bands of the wrong size,
were printed but were flagged and excluded from subse-
quent analysis. Figure 1 illustrates the location and direc-
tion of each open reading frame of the printed viral
genomes as well as which amplicons were successfully
amplified. Amplicons were purified, resuspended in
DMSO, and spotted in twelve replicate copies on ami-
nosaline-coated microscope slides. Following printing
and cross-linking, slide quality was assayed by staining a
representative slide for each printing with Syto-61 and
scanning at 635 nm and 532 nm wavelengths.
Specificity of DNA hybridizations
To validate our approach and determine the hybridization
specificity for each virus, DNA was isolated from host cells
in culture infected with a single viral species (Figure 2A),
plasmid DNA of infectious clones (Figure 2B), or genomic
DNA of co-infected cells (Figure 2C), labeled, and hybrid-
ized to the array. With the exception of the plasmid clone
hybridizations, uninfected host cell DNA was used as a
common reference sample for each competitive hybridi-
zation assay. Purified DNA was labeled using random
primers and the Klenow fragment of the E. coli DNA
polymerase such that labeling occurred irrespective of the
sequence. This method for labeling allowed us to label
any viral strain without prior knowledge of the sequence
and, more importantly, did not require PCR amplification
to detect specific and strong hybridization. The results
were calculated as a ratio of the intensity of hybridization
from infected host cell to the uninfected host cell DNA.
Results from these hybridization assays are shown in Fig-
ure 2, where the hybridization of each array probe is rep-
resented as a color-coded bar. A threshold ratio of five was
used as a minimum for detection and those array ele-
ments failing to meet that criterion are indicated in blue.
Array probes that resulted in a ratio between five and ten
were considered weak hybridization intensities and are
indicated in yellow, while strong hybridizations resulted
in a ratio greater than ten and are indicated in red.
As can be seen in Figure 2A, we were able to accurately
detect each virus with little cross hybridization to the oth-
ers represented on the array. Hybridizations were per-
formed with three different EBV infected cell lines, MM2,
B-95A, and Jijoye. Representative data from the B-95A
hybridization are shown in Figure 2A. The three cell lines
exhibited similar hybridization patterns, although we did
observe a slightly lower hybridization signal from the
Jijoye cell line than from the others (data not shown).
HHV-6A and HHV-6B are two variants of HHV-6 that dif-
fer in epidemiology, in vitro growth properties, and
nucleotide sequence [13,14]. Although the majority of the
ORFs in HHV-6A and HHV-6B have high sequence iden-
tity, there is a cluster of genes that exhibit less than 80%
identity at the right end of the unique region of the viral
genome spanning ORFs 86 to 100 [15,16]. Therefore, all
of the HHV-6A ORFs were amplified, whereas only those
HHV-6B ORFs that exhibited less than 80% sequence
identity with HHV-6A were printed. Hybridization with
genomic DNA from HHV-6A (U1102) infected cells
hybridized to the HHV-6A targets with little to no cross-
hybridization with the HHV-6B amplicons (Figure 2A). As
was observed with the EBV infected cells, there was very
little hybridization to other viral ORFs. Furthermore, as
expected, hybridization with genomic DNA from HHV-6B
(Z29) infected cells detected HHV-6A and HHV-6B
targets.
Hybridization using the KSHV infected cell line, BCBL-1,
gave a good signal for the KSHV ORFs (Figure 2A).
Although KSHV cross-hybridized to some viral probes,
those that cross-hybridized were not consistent between
the replicates (N = 3), with the exception of the HHV-6A
U80 and HCV NS5 probes. These results indicate that we
can accurately identify several closely related herpesvi-
ruses by their specific hybridization profile. The copy
number for KSHV
+
cell lines ranges from 50 to 2000 cop-
ies/cell. Therefore, the minimum copy number required
to detect viral sequences from infected cells appears to be
70 copies per cell, as this is the lowest copy number deter-
mined from the KSHV infected cell line, BCBL-1 [17].
However, subsequent analyses using the co-infected cell
lines, Cra-BCBL and BBG1 (Figure 1C), indicated that the
minimum detectable viral copy number is 20.
We were not able to detect HIV-1, HTLV-I, HTLV-II, or
HCV DNA sequences from infected cell lines (data not
shown). This is likely due to the low copy number of HIV,
HTLV-I, and HTLV-II in the infected cells used. The HIV-1
latently infected cell lines, ACH
2
and U
1
, contain one and
two integrated copies [18,19], respectively, while the
Retrovirology 2004, 1 />Page 4 of 15
(page number not for citation purposes)
HTLV-I and HTLV-II cell lines, MT-2 and C19, contain 5 to
8 integrated copies [20,21]. HCV is a RNA virus and
hybridization with genomic DNA from infected cells was
not expected. As we were unable to detect HIV-1, HTLV-I,
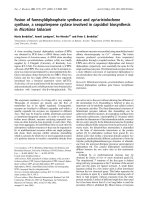
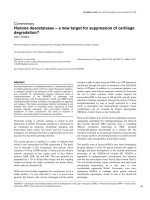
Genomic organization of arrayed virusesFigure 1
Genomic organization of arrayed viruses. Locations and direction of transcription of each open reading frame of the
arrayed viral genomes are shown. Red arrows indicate ORFs that were amplified and spotted. White arrows indicate regions
that are not represented on the array. The names of each ORF for the herpesviruses are described in Additional file 1. (A)
HIV-I, HTLV-I, HTLV-II and HCV; (B) KSHV, EBV, HHV6.
Retrovirology 2004, 1 />Page 5 of 15
(page number not for citation purposes)
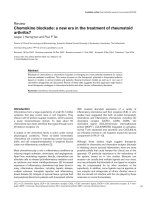
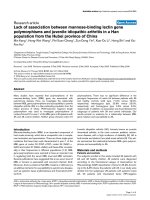
Specificity of DNA hybridizationsFigure 2
Specificity of DNA hybridizations. Each bar represents the hybridization results for each gene. These were calculated as
the mean intensity using infected host cell DNA and viral DNA versus uninfected host cell DNA. The color of the bar is a func-
tion of the ratio and indicative of Cy3 hybridization intensity for virus DNA relative to the hybridization (Cy5) intensity for
uninfected host cell DNA. Spotted probes are PCR amplicons of the viral and human control genes and are indicated below
each graph. The labeled targets are indicated to the left. (A) Hybridization of genomic DNA isolated from virally infected cells.
(B) Hybridization of plasmid DNA labeled by nick translation. (C) Hybridization of genomic DNA isolated from dually (KSHV
and EBV) infected cells, Cra-BCBL and BBG1. Hybridizations that resulted in a ratio of less than five for (A&C) or less than two
for (B) were considered as non-hybridization and are indicated in blue. Hybridizations that resulted in a ratio of five to ten for
(A&C) or two to five for (B) were considered low hybridization intensities and are indicated in yellow, while high hybridiza-
tions resulting in a ratio greater than ten for (A&C) or five for (B) are indicated in red.
Retrovirology 2004, 1 />Page 6 of 15
(page number not for citation purposes)
or HCV using genomic DNA from infected cells, we
labeled infectious plasmid clones with Cy3-dCTP or Cy5-
dCTP by nick translation. As can be seen in Figure 2B, spe-
cific hybridization was observed for all three viruses. Since
the experiments were performed using plasmid DNA
rather than DNA from infected cell lines, the same DNA
was labeled with both Cy-dyes and "self-self" hybridiza-
tions were performed. The data is represented for each
gene as the ratio of gene-specific hybridization intensity
on the average intensity for all spots. The cut-off ratio for
high hybridizations was set to five rather than ten. While
no cross-hybridizations could be observed, only two of
the 11 HIV probes represented on the array successfully
hybridized with the labeled plasmid DNA.
We also wanted to determine if we could specifically
detect multiple viruses in co-infected cells. Therefore, we
used genomic DNA from two different KSHV/EBV co-
infected cell lines, Cra-BCBL [22] and BBG1 [23] (Figure
2C). Hybridization to the KSHV and EBV targets was
observed. However, there was much less hybridization to
the EBV targets than was observed using DNA from a sin-
gly infected cell line (Figure 2A, EBV probe). BBG1 cells
contain approximately 2000 copies/cell of the KSHV
genome and 20 copies/cell of the EBV genome [23]. The
Cra-BCBL cell line contains 130 copies/cell of the KSHV
genome (unpublished data) but the copy number for EBV
is not known. Results suggest that the effective limit of
detection is approximately 20 genomic copies per cell, as
we observed hybridization of some of the EBV amplicons
despite the large difference in copy number relative to
KSHV.
In principal, genomic DNA should hybridize uniformly to
all of the genes of a specific array. There are several possi-
bilities why we observed differences in intensity levels for
the various amplicons, including the size of PCR products
and the G/C composition of the amplicons. Larger ORFs
may exhibit a higher fluorescent intensity as there is more
incorporated label than in smaller ORFs, and amplicons
with a higher A/T content may not hybridize as strongly
due to their lower melting temperature. The PCR products
spotted on our virus array are not uniform in size as they
vary from 100 bp to 3.4 Kbp. The genes that failed to
hybridize tended to be between 100–300 bp in size: 50%
of all amplicons smaller than 300 bp did not hybridize, or
hybridized weakly, while the failure rate was approxi-
mately 5% for the remaining amplicons. The G/C content
of the viruses varies, as does the G/C content of some
ORFs within viruses. However, there did not appear to be
any correlation between weak hybridization and G/C
composition of the amplicons.
In the case of hybridizations to plasmid DNA, as seen in
Figure 2B, there is less cross-hybridization and better
representation of all targeted genes for HTLV-I and HCV.
For HIV, while there was no cross-hybridization to ampli-
cons of other viruses, only two (proviral LTR and nef) of
the 11 spotted regions of the HIV-1 genome hybridized to
the DNA sample. The G/C content of the entire coding
region of HIV is 42%. However, the G/C content for Nef
and the LTR is 49% and 53%, respectively. As the HIV pro-
viral DNA was labeled with Cy-dCTP, the higher G/C con-
tent of Nef and LTR may explain the better hybridization
observed for these amplicons.
Sensitivity of DNA hybridizations
DNA hybridizations were typically performed using 3 µg
of genomic DNA. To determine the detection limits in
these assays, genomic DNA from HHV-6A (U1102)
infected cells was used in a titration study. DNA was iso-
lated from HHV-6A-infected cells (U1102). The viral copy
number was determined to be 400 copies per cell by
quantitative real-time PCR (data not shown). The DNA
was then serially diluted from 3 µg to 0.01 µg, labeled,
and hybridized to the array. As expected, for most HHV-6
genes, there was a greater hybridization signal at higher
concentrations (Figure 3). We determined that there were
2 × 10
7
viral copies in 0.3 µg of genomic DNA and we
detected a significant level of specific hybridizations at a
10-fold lower concentration than that used in the experi-
ments shown in Figure 2.
Expression studies
DNA hybridizations allowed us to validate hybridization
for each target and determine the specificity and sensitiv-
ity for each virus in the array. However, many of the appli-
cations we envision will require determination of RNA
expression levels. To demonstrate this capability, we
focused on the expression of HHV-6B, HIV-1, and KSHV
genes from virally infected cells.
To analyze HHV-6 gene expression, HHV-6B (Z29)
infected cells were co-cultivated with uninfected T cells
(SupT1) for seven days, after which time complete cyto-
pathic effect was observed. Total RNA from infected and
uninfected cells was isolated, reverse transcribed using
random primers, labeled, and competitively hybridized to
the virus chip. An example of HHV-6 gene expression is
represented in Figure 4A. Differential expression was
detected for 74% of the 108 printed ORFs. Of the 28 genes
that were not detected, five did not hybridize in the DNA
experiments. Many of the ORFs that did not hybridize
were immediate early genes or genes with no known func-
tion. In addition, a number of late genes, including U33
and U94, did not exhibit any signal, although both U33
and U94 hybridized in the DNA experiments (Figure 2A).
The fact that we did not detect U94 expression is reasona-
ble considering its transcript is found in very low abun-
dance [24,25]. Interestingly, U12 was identified as being
Retrovirology 2004, 1 />Page 7 of 15
(page number not for citation purposes)
differentially regulated in this experiment although the
U12 transcript has not been detected by Northern analysis
in previous studies [26]. Incidentally, four of the ten small
amplicons (<300 bp) that did not hybridize in the DNA
experiments were detected in these RNA expression exper-
iments. Several studies have compared the sensitivities of
DNA microarrays and Northern blots [27,28] and have
found that the dynamic range and sensitivity between
DNA microarrays and Northern blots was comparable,
although differences were observed depending on the
gene analyzed.
To further demonstrate the utility of the virus chip, we
analyzed the effect of drug treatment on viral gene expres-
sion in HIV-1 and KSHV-infected cells. In the first experi-
ment, we compared HIV gene expression before and after
drug treatment. Cellular cyclins and cyclin dependent
kinases (CDK) have been shown to be critical for the
expression and replication of a number of viruses, includ-
ing HIV and several herpesviruses [29-35]. We and others
have previously shown that inhibiting CDKs with ATP
analogs, such as CYC202 (r-CYC202; Cyclacel Ltd; http://
www.cyclacel.com), can suppress HIV-1 expression and
replication in vitro and in vivo [35,36]. However, we were
previously unable to specifically determine which ORFs
(from doubly spliced or singly spliced messages) was
inhibited in these drug treated cells. To determine which
viral transcripts were suppressed by Cyc202, HIV-1
expression was induced in ACH
2
cells, a latently infected
HIV-1
+
cell line, by incubation with TNF-α for two hrs.
Cells were subsequently washed and fresh media was
added, with or without CYC202 (5 µM). Similar treat-
ments were performed in uninfected CEM parental cells.
Nine hours after induction, total RNA from uninfected,
infected and CYC202 treated cells were isolated, labeled,
and hybridized to the virus chip (Figure 4B). Without any
induction, both the LTR and Gag genes showed detectable
levels of expression, while low expression was observed
for Rev (red bars). This is consistent with previously pub-
lished reports showing that latent cells exhibit low basal
transcription with a mostly non-processive RNA polymer-
ase II [37]. When cells were treated with TNF-α, all of the
expected HIV-1 RNAs were transcribed and detected on
the virus chip (green bars). This is also consistent with
previously published reports, where the mRNA species
producing Tat, Rev, and Nef are coordinately regulated by
Rev and therefore these transcript levels accumulate in the
absence of Rev protein and are down regulated in the pres-
ence of Rev [38].
When cells were treated with CYC202, we observed the
down-regulation of a number of transcripts. Infected cells
treated with CYC202 should have expression levels simi-
lar to infected cells not induced with TNF. We can in fact
observe this in Figure 4B, where hybridizations from
CYC202 treated cells, expressed as a Log2 (ratio) with
untreated cells (yellow bars), were comparable to the
Log2 ratios of uninduced cells. If CYC202 did not have an
effect, the Log2 ratio values would have been closer to 0
(Log2 of a ratio of 1 is zero). Log2 intensity ratios less than
one indicate that the drug had little or no effect on the
expression of that gene. CYC202 mainly inhibited expres-
sion of the LTR and Pol and Nef genes. This is consistent
with the mechanism of CYC202 inhibiting at the
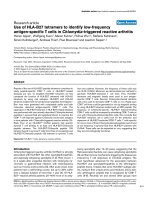
Determination of DNA hybridization sensitivity by titrationFigure 3
Determination of DNA hybridization sensitivity by titration. Genomic DNA of infected cells was isolated and HHV-6
viral copy number was determined by a TaqMan assay [68], as described in Materials and Methods. The DNA was then serially
diluted (3 µg, 1 µg, 0.3 µg, 0.01 µg), labeled, and hybridized to the array. Hybridizations that resulted in a ratio of less than 2
were considered as non-hybridization and are indicated in blue. Hybridizations that resulted in a ratio of two to ten were con-
sidered low hybridization intensities and are indicated in yellow, while high hybridizations resulting in a ratio greater than ten
are indicated in red.
Retrovirology 2004, 1 />Page 8 of 15
(page number not for citation purposes)
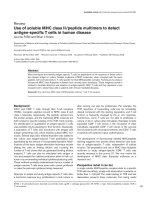
Analysis of viral gene expressionFigure 4
Analysis of viral gene expression. (A) HHV-6B gene expression. Only the HHV-6 open reading frames are illustrated and
indicated at the bottom of the panel. RNA extracted from HHV-6B-infected cells (Z29) and uninfected cells (SupT1) was used
in hybridization assays. (B) HIV-1 gene expression and inhibition by CYC202. Only the HIV-1 open reading frames are illus-
trated and indicated at the bottom of the panel. The Tat and Rev coding sequences overlap in the HIV proviral genome. Prim-
ers were designed to amplify the first exon of Tat and the second exon of Rev (see Additional file 1). Both amplicons contain
some overlap, with 84% of the Rev amplicon specific to Rev and 65% of the Tat amplicon specific to Tat. Tat and Rev indicated
in the graph correspond to the amplicons that contain the majority of that particular sequence. Values were calculated and
expressed as Log2 ratios. The red bars indicate hybridization in latent, uninduced cells; the green bars indicate genes that were
expressed following TNF induction (20 ng/ml for 2 hrs). Both are compared to expression from uninfected cells. The blue bars
indicate genes that were expressed following TNF induction compared to no induction; yellow bars indicate genes whose
expression was effected by TNF and CYC202 (5 µM), as compared to untreated cells. (C) KSHV gene expression and inhibi-
tion by CYC202. Only the KSHV open reading frames are illustrated and indicated at the bottom of the panel. Values were cal-
culated and expressed as mean Log2 ratios from four experiments. The yellow bars indicate genes that are expressed following
TPA induction (20 ng/ml) while the red bars indicate genes whose expression was effected by TPA and CYC202 (5 µM).
Retrovirology 2004, 1 />Page 9 of 15
(page number not for citation purposes)
promoter (LTR) and the first ORF (Gag). The down-regu-
lation of Nef, which is the most abundant doubly spliced
transcript in infected cells, also implies that these tran-
scripts are susceptible to regulation by CDK inhibitors.
This novel finding was unexpected; however, it further
characterizes which of the doubly or singly spliced mes-
sages are regulated by cyclin/cdk complexes in HIV-1
infected cells. Although these experiments indicate that
CYC202 inhibits activated transcription at the HIV-1 LTR
by inhibiting cdk2 and cdk9 [35], it does not address the
changes in the half-lives of the other HIV-1 ORFs. How-
ever, in the absence of Gag or Nef, no HIV-1 particles were
made, as demonstrated by the lack of the p24/gag antigen
in the supernatants [35,36].
In a second experiment, we evaluated viral gene expres-
sion in the KSHV infected cell line, BCBL-1. BCBL-1 is a
primary effusion lymphoma cell line established from a
HIV
+
patient [39]. The KSHV genome remains latent with
very little viral gene expression in infected cells cultured in
vitro. After treatment with TPA, viral gene expression is
activated [39]. As can be seen in Figure 4C, following nine
hours of TPA treatment, low but significant expression (p
< 0.05) was detected for a number of KSHV ORFs, includ-
ing K5, K7, ORF72, and ORF73. The expression of these
genes was previously shown to peak later in the viral life
cycle [8]. We also detected hybridization to ORF50/Rta,
which was previously shown to exhibit significant expres-
sion by 10 hours post-induction [8]. CYC202 has been
shown to inhibit the gene expression and replication of a
number of herpesviruses including herpes simplex virus
(HSV) and cytomegalovirus (CMV) [29,32,36]. Therefore,
we attempted to determine if CYC202 could inhibit KSHV
gene expression. At the time of induction with TPA,
CYC202 (5 µM) was added and nine hours after induction
total RNA was isolated, labeled, and hybridized to the
virus chip (Figure 4C). Values were determined as the
mean log2 ratios of four experiments. Evidence of sup-
pression by CYC202 was demonstrated by the fact that the
sample treated with CYC202 behaved like the sample
with no TPA induction. The data indicate that CYC202
suppressed the expression of the lytically induced gene,
K7. These results are similar to what has been observed
with HSV [32].
These results demonstrate the utility of using a virus chip
for gene expression studies of virally infected cells. The
advantage of using a chip containing all ORFs of a virus is
that it allows for analysis of global changes in gene expres-
sion. Furthermore, the ability of longer products to
hybridize effectively despite some number of mismatches
can be an advantage for viruses that exhibit a relatively
high mutation rate and for the detection of virus strains
from related families.
Use of ChIP-chip analysis to identify proteins bound to a
viral genome in vivo
Lastly, we demonstrated a novel use for the virus chip to
determine if proteins that associate with the natural chro-
matin structure associate with the KSHV genome. Chro-
matin immunoprecipitation (ChIP) has been used to
determine if specific proteins bind to regions of a genome
in vivo [40], to identify transcription factor binding to pro-
moters [41,42], and to identify the binding of modified
proteins to DNA in vivo [43,44]. Recently, ChIP has been
paired with microarray analyses (ChIP-chip) [45] to iden-
tify the binding sites of transcription factors in the yeast
genome [46]. Nucleosomes are important in regulation of
chromatin structure as well as transcription [47-49] and
therefore, we tested whether phosphorylated histone H3
(P-H3), which is associated with activated gene transcrip-
tion [50], was associated with the KSHV genome during
latent gene expression and whether binding of P-H3
increased following activation of viral gene expression.
Following immunoprecipitation of bound DNA with
anti-P-H3, DNA was labeled directly, without further
amplification (Figure 5). This is in contrast to previously
reported ChIP-chip studies where a three step amplifica-
tion procedure has been used [45,46]. Intensity ratios
greater than two were considered significant. As can be
seen in Figures 5A and 4C, DNA from uninduced BCBL-1
cells that was precipitated with anti-P-H3, hybridized to
the K14 amplicon in KSHV latently infected cells. During
latent KSHV infection, viral gene expression is limited to
K12/kaposin, ORF73/LANA, ORF72/v-cyclin, K13/
ORF71/v-FLIP [51-53], and K10.5/LANA2 [54]. The K14
amplicon spans the promoter for the major latency tran-
script [51,55], which encodes ORF73, ORF72, and K13,
indicating that an activated form of histone H3 is associ-
ated with an actively transcribed latent viral gene. In unin-
duced cells, we did not detect hybridization to other viral
amplicons or the majority of the human amplicons, dem-
onstrating the specificity of the immunoprecipitation and
hybridization. Following induction of viral gene expres-
sion and anti-P-H3 immunoprecipitation, additional
regions of the KSHV genome were observed to hybridize
to the virus chip (Figures 5B and 5C). These regions
included ORFs 22, 24, 34, 36, 45, 46, 48, 50, and K5.
ORF50/Rta, the first gene turned on following induction
[56], is required for activation of the KSHV lytic cycle
[57,58] and subsequently turns on K8, an immediate early
gene with homology to the EBV transcription factor bZIP
[59]. The promoter for K8 is found within the sequences
coding for ORF50 [60] while the promoter for ORF50 is
found within the sequences coding for ORF48 [56,60].
Both of these regions exhibited detectable hybridization
to the immunoprecipitated DNA from induced cells. The
protein kinase B (PKB) amplicon also hybridized to DNA
precipitated from uninduced and induced BCBL-1 cells.
PKB/AKT is involved in a number of cellular processes
Retrovirology 2004, 1 />Page 10 of 15
(page number not for citation purposes)
ChIP-chip of KSHV DNAFigure 5
ChIP-chip of KSHV DNA. Chromatin immunoprecipitation (ChIP) was performed as described [43] using an antibody to
the phosphorylated form of histone H3 and DNA was directly labeled with Cy3-dCTP or Cy5-dCTP. (A) ChIP of uninduced
BCBL-1 cells. BCBL-1 cells were cultured normally and a ChIP was performed as described in Materials and Methods. All
amplicons are listed at the bottom of the panel. (B) ChIP of induced BCBL-1 cells. BCBL-1 cells were induced with 0.3 mM
sodium butyrate for 48 hrs and ChIP was performed as described. All amplicons are listed at the bottom of the panel. (C) Sum-
mary of ChIP results from uninduced and induced BCBL-1 cells. Only the KSHV amplicons are shown. The blue bars are
hybridizations from uninduced cells while the red bars are hybridizations from induced cells. Below the graph is a schematic of
the KSHV genome indicating the location and direction of transcription of the ORFs. ORFs indicated in white were not
included in the analysis as the corresponding amplicons were not properly amplified for printing.
Retrovirology 2004, 1 />Page 11 of 15
(page number not for citation purposes)
including positive regulation of the cell cycle [61] and
activation of gene expression [62,63]. That an activated
form of histone H3 was associated with protein kinase B
suggests that PKB was expressed in BCBL-1 cells and that
PKB may be involved in viral gene expression in KSHV
infected cells. These results demonstrate that we are able
to detect DNA immunoprecipitated from virally infected
cells without the use of tagged proteins and, more impor-
tantly, without further amplification of precipitated DNA.
These results are in contrast with previously published
results that required a three-step amplification/labeling
procedure to identify precipitated DNA [45,46]. Further-
more, these results are the first use of ChIP-chip in detect-
ing binding of cellular proteins to viral DNA.
We have developed an amplicon based virus chip repre-
senting the genomic sequences from eight human viruses.
Using labeled DNA from infected cells or infectious plas-
mids we were able to specifically identify each virus, with
minimal cross-hybridization between the various viral
species. Furthermore, we were able to accurately identify
both viruses from co-infected cells. We further demon-
strated the utility of the virus chip with a variety of expres-
sion studies as well as ChIP-chip analysis. Significantly,
we were able to detect specific viral sequences immuno-
precipitated from infected cells without further amplifica-
tion. Given the above positive results, we plan to further
develop this chip by including the open reading frames of
other viruses that are known human pathogens. The
potential applications of a viral microarray representing
pathogenic viruses extends beyond profiling expression of
viral genes to the discovery of novel viruses, drug target
identification and drug development, and widespread
screening of blood or organs for viral contamination prior
to transplantation [11,64,65].
Methods
Cell lines
All cell lines were grown in RPMI 1640, 10% FBS, 1%
streptomycin/penicillin, and 1% L-glutamine (Invitro-
gen). Uninfected control T and B cell lines included CEM,
SupT1, and BJAB. The following virally infected cell lines,
MT-2 (HTLV-I); C19 (HTLV-II); B-95A, MM2 and Jijoye
(EBV); BCBL-1 (KSHV) [39], Cra-BCBL [22] and BBG1
[23] (dually infected with KSHV and EBV); and ACH
2
(HIV-1) were also used. Genomic DNA from EBV strain
Jijoye was a generous gift from Dr. Charles Wood (Univer-
sity of Nebraska). Uninfected SupT1 cells were co-culti-
vated with SupT1 infected with HHV-6A (U1102) and
HHV-6B (Z29). Seven days post-infection, RNA and DNA
were isolated. Viral replication was induced in HTLV and
HIV infected cell lines with TNF-α (10 ng/ml) for two hrs.
Viral replication was induced in KSHV-infected cells with
TPA (20 ng/ml) or sodium butyrate (0.3 mM). For the
CYC202 (r-CYC202) studies, induced cell lines were
treated with CYC202 (5 µM) at the time of induction.
Design
PCR primer sets (see Additional file 1) were generated for
all specific viral open reading frames from the eight target
viral species. Coding sequence coordinates of the ORFs
were adjusted to prevent overlaps between amplified
regions and to limit the amplicon size to less than 3.5 kb.
PCR primer sets were designed using Primer 3.0 [12] with
optimized design parameters. Larger ORFs were repre-
sented by up to four amplicons. The largest PCR product
obtained was 3.2 kb in length and the shortest 100 bp. We
were able to successfully design primer sets for 302 of the
329 ORFs identified in the eight viruses (see details and
primer sequences in Additional file 1). Coding regions for
which primers could not be designed corresponded to
very small target sequences or highly repetitive regions.
Genomic DNA (1 ng) from infected cells was used as the
template and was amplified with 800 nM primers and Taq
DNA polymerase using the supplied buffer (Applied Bio-
systems). Conditions for PCR were 94°C, 30 sec; 60°C,
for 45 sec; and 72°C for 2 min 35 sec; for 30 cycles, with
a final extension at 72°C for 10 min. Following amplifica-
tion, PCR products were purified with the Millipore 96-
well filtration system, according to manufacturer's direc-
tions. Five microliters of purified product were separated
through a 1% agarose gel and analyzed for the presence
and correct size of each amplicon. Each product was
graded as strong, acceptable, questionable, smear, mis-
primed, or failed and scores are uploaded into the TIGR
database. A score indicating an unsuccessful amplification
will automatically give a null value for the particular spot
corresponding to that amplicon. We obtained amplicons
for 254 genes in the first generation of the chip and 264 in
the second generation, with failed amplifications giving
either no products or multiple bands. Figure 1 provides an
overview of the genomic location of the ORFs that were
successfully amplified and spotted for each virus. Purified
amplicons were spotted in twelve replicate copies on ami-
nosaline-coated microscope slides (Corning) using the
Molecular Dynamics generation III arrayer (Sunnyvale,
California). Printing was performed at room temperature
and at a humidity level of 40–52%. Printed slides were
cross-linked by drying for 2 hours at 80°C.
Sample labeling, hybridization, and scanning
Total RNA was isolated from control and infected cell
lines with RNA-BEE (Tel-Test, Inc.) according to the
manufacturer's directions. Residual genomic DNA was
removed by DNase I digestion (RNase-free, Amersham
Biosciences) and phenol-chloroform extraction. Total
genomic DNA was isolated as described [66].
Retrovirology 2004, 1 />Page 12 of 15
(page number not for citation purposes)
Genomic DNA (3 µg) was labeled using 15 µg random
hexamers (Invitrogen), 3 mM Cy3-dCTP or 3 mM Cy5-
dCTP (Amersham Pharmacia), and 15 units exo-Klenow
large fragment (New England Biolabs), at room tempera-
ture for 3 hr. Labeled DNA probes were purified using a
GFX column (Amersham Pharmacia).
Infectious plasmid clones were labeled by nick translation
as described [67]. Cy3-dCTP or Cy5-dCTP (1 mM) was
included with 1 mM each dTTP, dATP, and dGTP. Follow-
ing incubation at 15°C, the labeled products were puri-
fied using a GFX column (Amersham Pharmacia).
For expression profiling experiments, complimentary
DNA was synthesized by reverse transcription in the pres-
ence of aminoallyl-tagged dUTP (aa-dUTP, Ambion).
Total RNA (2 µg) and 6 µg of random hexamers (Life
Technologies) were incubated at 70°C for 10 min and
snap frozen. cDNA was synthesized overnight at 42°C by
reverse transcription (SuperscriptII, Invitrogen) in the
presence of 25 mM each dATP, dCTP, dGTP, 10 mM dTTP,
and 15 mM aa-dUTP (Ambion). The RNA template was
hydrolyzed with 1 M NaOH at 65°C. The resulting cDNA
was filtered and concentrated with a Microcon-30 spin
column (Millipore) and dried under vacuum. The sample
was resuspended in 0.1 M carbonate (Na
2
CO
3
, pH 9.0)
buffer and NHS-Cy3 or -Cy5 (Amersham Pharmacia) to
fluorescently label the cDNA probe (at room temperature
for 3 hr). The coupling reaction was purified using the
QIAquick PCR purification kit (Qiagen). The probe was
eluted in 100 µl DNAse/RNase-free water and analyzed
using a Beckman spectrophotometer to measure dye
incorporation and nucleotides per dye.
Slides were rinsed in 0.1% SDS and denatured in boiling
water. Labeled probes (Cy-3/Cy-5) were resuspended in
water and salmon sperm DNA and denatured at 95°C.
Hybridization solution (50% formamide, 5X SSC, 0.1%
SDS, and 0.2 mg/mL bovine serum albumin) was added
and the probes were incubated for 20 min at the appropri-
ate hybridization temperature. Probes were allowed to
hybridize overnight at 42°C and 48°C for RNA and DNA
experiments, respectively. Slides for DNA experiments
were washed sequentially in (i) 1X SSC, 0.2% SDS at
48°C; (ii) 0.1X SSC, 0.1% SDS at room temperature; and
(iii) 0.1X SSC at room temperature. Each wash was for 4
min. Slides for RNA experiments were washed sequen-
tially in (i) 2X SSC, 0.1% SDS at 42°C; (ii) 0.1X SSC, 0.1%
SDS at room temperature; (iii) 0.1X SSC at room temper-
ature; and (iv) 0.01X SSC at room temperature. Each wash
was for 4 min. The slides were scanned with an Axon-
4000B scanner and images saved as paired single-color
TIFF images.
Determination of HHV-6 copy number
Genomic DNA from infected cells was isolated according
to the manufacturer's directions (Gentra System) and the
concentration was adjusted to 10 ng/µl. Immediate early
gene sequences were amplified using a TaqMan assay
[68]. A standard curve was generated using a known con-
centration of variant-specific HHV-6 plasmids. Results
were plotted and sorted using the Sequence Detector Sys-
tem (Perkin Elmer). Results were normalized using a
human genomic β-actin calibration curve. Absolute viral
and β-actin DNA copy number was assessed and final viral
DNA load per 10
6
cells was calculated by the following
formula: [HHV-6 DNA copy number/(β-actin DNA copy
number/2)] × 10
6
.
ChIP-chip analysis
Chromatin immunoprecipitation (ChIP) was performed
as described previously [43] with slight modifications.
Briefly, cells were cross-linked with 1% formaldehyde.
Nuclei, prepared by hypotonic lysis, were resuspended in
lysis buffer (1% SDS, 10 mM EDTA, 50 mM Tris-HCl, pH
8.1), sonicated to reduce DNA length to 200–1000 bp,
and debris removed by centrifugation. The chromatin
solution was precleared on protein A/G beads pre-
adsorbed with sonicated salmon sperm DNA. The chro-
matin solution was then incubated with an antibody to
histone H3 phosphorylated on serine 10 (Upstate Cell
Signaling Solutions) or no antibody overnight at 4°C.
Immune complexes were collected with protein beads
pre-adsorbed with sonicated salmon sperm DNA. Follow-
ing washes and elution, cross-linking was reversed by
heating at 65°C for 4 to 5 hours, and DNA was recovered
by digestion of proteins with proteinase K followed by
phenol-chloroform extraction and ethanol precipitation.
DNA was labeled directly as described above for genomic
DNA, hybridized (chip), and washed accordingly.
Normalization
As a first step, in-slide replicate analyses were performed
by calculating the geometric mean of the spots corre-
sponding to each gene. For the DNA experiments where
infected (test) versus uninfected (control) host cell DNA
was used in the hybridizations, a linear normalization was
performed based on the assumption that the ratio of the
host cell genes should be equal to 1. In genomic DNA
hybridizations, for each host cell gene represented on the
array, the geometric mean of the measured fluorescence
intensities was calculated for both the experimental and
control and the ratio of these was used as a scaling factor
to adjust the values of all fluorescence measures for the
viral genes represented on the array. For the expression
studies (cDNA hybridizations), data was generated by
dye-swap replication experiments. Total normalization
was performed followed by flip-dye consistency checking
using the TIGR Microarray Data Analysis System [69] or
Retrovirology 2004, 1 />Page 13 of 15
(page number not for citation purposes)
by one-class T-test analysis. For the plasmid experiments,
where the same DNA was labeled with both dyes, an iter-
ative log mean centering normalization was performed
using MIDAS v2.17 with the following parameters: global
mode, +/- 3 S.D. outlier range, Cy3 [69]. We treated the
Cy3 and adjusted Cy5 intensities as technical replicates
and calculated the mean of these values. The ratio of this
mean on the average of the intensity across the array set
was then obtained. A ratio greater than 2 indicates that
there was hybridization to a specific gene 2-fold above the
background intensity across the whole array.
Authors' contributions
EG analyzed all the microarray data and printed the
arrays. NM printed the arrays and participated in some of
the expression studies. AP performed many of the expres-
sion studies and the ChIP-chip analysis. VL performed the
ChIP-chip analysis. CD participated in the design and
printing of the array and performed some of the expres-
sion studies. KY carried out the HHV-6A sensitivity exper-
iment. JQ participated in the design of the experiments for
analysis. EG and AP drafted the manuscript. EG, SJ, and
FK participated in the design and coordination of the
study. EG and FK funded the studies. All authors read and
approved the manuscript.
Additional material
Acknowledgements
Elodie Ghedin and Anne Pumfery contributed equally to the work and
should be regarded as joint first authors. We would like to thank Dr. C.
Wood (University of Nebraska) for various reagents used in this study and
Dr. Claire Fraser for her support of the work at TIGR. The work at The
Institute for Genomic Research (TIGR) was supported by an internal grant
to Elodie Ghedin; the work at The George Washington University was sup-
ported by a grant from the National Institute for Allergy and Infectious Dis-
eases, National Institutes of Health (NIAID/NIH) to Fatah Kashanchi. Fatah
Kashanchi and Steve Jacobson share senior authorship.
References
1. Hegde P, Qi R, Abernathy K, Gay C, Dharap S, Gaspard R, Hughes JE,
Snesrud E, Lee N, Quackenbush J: A concise guide to cDNA
microarray analysis. Biotechniques 2000, 29:548-50, 552-4, 556
passim.
2. Ramsay G: DNA chips: state-of-the art. Nat Biotechnol 1998,
16:40-44.
3. Li J, Chen S, Evans DH: Typing and subtyping influenza virus
using DNA microarrays and multiplex reverse transcriptase
PCR. J Clin Microbiol 2001, 39:696-704.
4. Wang D, Urisman A, Liu YT, Springer M, Ksiazek TG, Erdman DD,
Mardis ER, Hickenbotham M, Magrini V, Eldred J, Latreille JP, Wilson
RK, Ganem D, DeRisi JL: Viral Discovery and Sequence Recov-
ery Using DNA Microarrays. PLoS Biol 2003, 1:E2.
5. Zammatteo N, Hamels S, De Longueville F, Alexandre I, Gala JL,
Brasseur F, Remacle J: New chips for molecular biology and
diagnostics. Biotechnol Annu Rev 2002, 8:85-101.
6. Chambers J, Angulo A, Amaratunga D, Guo H, Jiang Y, Wan JS, Bittner
A, Frueh K, Jackson MR, Peterson PA, Erlander MG, Ghazal P: DNA
microarrays of the complex human cytomegalovirus
genome: profiling kinetic class with drug sensitivity of viral
gene expression. J Virol 1999, 73:5757-5766.
7. Stingley SW, Ramirez JJ, Aguilar SA, Simmen K, Sandri-Goldin RM,
Ghazal P, Wagner EK: Global analysis of herpes simplex virus
type 1 transcription using an oligonucleotide-based DNA
microarray. J Virol 2000, 74:9916-9927.
8. Paulose-Murphy M, Ha NK, Xiang C, Chen Y, Gillim L, Yarchoan R,
Meltzer P, Bittner M, Trent J, Zeichner S: Transcription program
of human herpesvirus 8 (kaposi's sarcoma-associated
herpesvirus). J Virol 2001, 75:4843-4853.
9. Feng WH, Israel B, Raab-Traub N, Busson P, Kenney SC: Chemo-
therapy induces lytic EBV replication and confers ganciclovir
susceptibility to EBV-positive epithelial cell tumors. Cancer
Res 2002, 62:1920-1926.
10. Wang HY, Malek RL, Kwitek AE, Greene AS, Luu TV, Behbahani B,
Frank B, Quackenbush J, Lee NH: Assessing unmodified 70-mer
oligonucleotide probe performance on glass-slide
microarrays. Genome Biol 2003, 4:R5.
11. Wang D, Coscoy L, Zylberberg M, Avila PC, Boushey HA, Ganem D,
DeRisi JL: Microarray-based detection and genotyping of viral
pathogens. Proc Natl Acad Sci U S A 2002, 99:15687-15692.
12. Primer 3.0 2001 [ />genome_software]. Whitehead Institute
13. Ablashi DV, Balachandran N, Josephs SF, Hung CL, Krueger GR, Kra-
marsky B, Salahuddin SZ, Gallo RC: Genomic polymorphism,
growth properties, and immunologic variations in human
herpesvirus-6 isolates. Virology 1991, 184:545-552.
14. Schirmer EC, Wyatt LS, Yamanishi K, Rodriguez WJ, Frenkel N: Dif-
ferentiation between two distinct classes of viruses now clas-
sified as human herpesvirus 6. Proc Natl Acad Sci U S A 1991,
88:5922-5926.
15. Dominguez G, Dambaugh TR, Stamey FR, Dewhurst S, Inoue N, Pel-
lett PE: Human herpesvirus 6B genome sequence: coding con-
tent and comparison with human herpesvirus 6A. J Virol 1999,
73:8040-8052.
16. Isegawa Y, Mukai T, Nakano K, Kagawa M, Chen J, Mori Y, Sunagawa
T, Kawanishi K, Sashihara J, Hata A, Zou P, Kosuge H, Yamanishi K:
Comparison of the complete DNA sequences of human her-
pesvirus 6 variants A and B. J Virol 1999, 73:8053-8063.
17. Lallemand F, Desire N, Rozenbaum W, Nicolas JC, Marechal V:
Quantitative analysis of human herpesvirus 8 viral load using
a real-time PCR assay. J Clin Microbiol 2000, 38:1404-1408.
18. Clouse KA, Powell D, Washington I, Poli G, Strebel K, Farrar W, Bar-
stad P, Kovacs J, Fauci AS, Folks TM: Monokine regulation of
human immunodeficiency virus-1 expression in a chronically
infected human T cell clone. J Immunol 1989, 142:431-438.
19. Folks TM, Justement J, Kinter A, Dinarello CA, Fauci AS: Cytokine-
induced expression of HIV-1 in a chronically infected prom-
onocyte cell line. Science 1987, 238:800-802.
20. Yoshida M, Miyoshi I, Hinuma Y: Isolation and characterization
of retrovirus from cell lines of human adult T-cell leukemia
and its implication in the disease. Proc Natl Acad Sci U S A 1982,
79:2031-2035.
21. Gallo D, Penning LM, Hanson CV: Detection and differentiation
of antibodies to human T-cell lymphotropic virus types I and
II by the immunofluorescence method. J Clin Microbiol 1991,
29:2345-2347.
22. Lacoste V, Judde JG, Bestett G, Cadranel J, Antoine M, Valensi F,
Delabesse E, Macintyre E, Gessain A: Virological and molecular
characterisation of a new B lymphoid cell line, established
from an AIDS patient with primary effusion lymphoma, har-
bouring both KSHV/HHV8 and EBV viruses. Leuk Lymphoma
2000, 38:401-409.
Additional File 1
Table listing the identity of the PCR primers used for the production of the
amplicons, their exact coordinates on the genomes, the sizes of the probes
generated and the success of the amplification. Also listed are product
names, ORF coordinates and sizes, and GC content of each ORF.
Click here for file
[ />4690-1-10-S1.xls]
Retrovirology 2004, 1 />Page 14 of 15
(page number not for citation purposes)
23. Morand P, Buisson M, Collandre H, Chanzy B, Genoulaz O, Bourgeat
MJ, Pinel N, Leclercq P, Leroux D, Marechal V, Fritsch L, Ruigrok R,
Seigneurin JM: Human herpesvirus 8 and Epstein Barr-virus in
a cutaneous B-cell lymphoma and a malignant cell line estab-
lished from the blood of an AIDS patient. Leuk Lymphoma 1999,
35:379-387.
24. Rapp JC, Krug LT, Inoue N, Dambaugh TR, Pellett PE: U94, the
human herpesvirus 6 homolog of the parvovirus nonstruc-
tural gene, is highly conserved among isolates and is
expressed at low mRNA levels as a spliced transcript. Virology
2000, 268:504-516.
25. Rotola A, Ravaioli T, Gonelli A, Dewhurst S, Cassai E, Di Luca D: U94
of human herpesvirus 6 is expressed in latently infected
peripheral blood mononuclear cells and blocks viral gene
expression in transformed lymphocytes in culture. Proc Natl
Acad Sci U S A 1998, 95:13911-13916.
26. Isegawa Y, Ping Z, Nakano K, Sugimoto N, Yamanishi K: Human
herpesvirus 6 open reading frame U12 encodes a functional
beta-chemokine receptor. J Virol 1998, 72:6104-6112.
27. Bartosiewicz M, Trounstine M, Barker D, Johnston R, Buckpitt A:
Development of a toxicological gene array and quantitative
assessment of this technology. Arch Biochem Biophys 2000,
376:66-73.
28. Taniguchi M, Miura K, Iwao H, Yamanaka S: Quantitative assess-
ment of DNA microarrays comparison with Northern blot
analyses. Genomics 2001, 71:34-39.
29. Bresnahan WA, Boldogh I, Chi P, Thompson EA, Albrecht T: Inhibi-
tion of cellular Cdk2 activity blocks human cytomegalovirus
replication. Virology 1997, 231:239-247.
30. Davido DJ, Leib DA, Schaffer PA: The cyclin-dependent kinase
inhibitor roscovitine inhibits the transactivating activity and
alters the posttranslational modification of herpes simplex
virus type 1 ICP0. J Virol 2002, 76:1077-1088.
31. Schang LM, Phillips J, Schaffer PA: Requirement for cellular cyclin-
dependent kinases in herpes simplex virus replication and
transcription. J Virol 1998, 72:5626-5637.
32. Schang LM, Rosenberg A, Schaffer PA: Transcription of herpes
simplex virus immediate-early and early genes is inhibited by
roscovitine, an inhibitor specific for cellular cyclin-depend-
ent kinases. J Virol 1999, 73:2161-2172.
33. Schang LM, Rosenberg A, Schaffer PA: Roscovitine, a specific
inhibitor of cellular cyclin-dependent kinases, inhibits herpes
simplex virus DNA synthesis in the presence of viral early
proteins. J Virol 2000, 74:2107-2120.
34. Schang LM: Cyclin-dependent kinases as cellular targets for
antiviral drugs. J Antimicrob Chemother 2002, 50:779-792.
35. Wang D, de la Fuente C, Deng L, Wang L, Zilberman I, Eadie C, Hea-
ley M, Stein D, Denny T, Harrison LE, Meijer L, Kashanchi F: Inhibi-
tion of human immunodeficiency virus type 1 transcription
by chemical cyclin-dependent kinase inhibitors. J Virol 2001,
75:7266-7279.
36. Schang LM, Bantly A, Knockaert M, Shaheen F, Meijer L, Malim MH,
Gray NS, Schaffer PA: Pharmacological cyclin-dependent
kinase inhibitors inhibit replication of wild-type and drug-
resistant strains of herpes simplex virus and human
immunodeficiency virus type 1 by targeting cellular, not
viral, proteins. J Virol 2002, 76:7874-7882.
37. Karn J: Tackling Tat. J Mol Biol 1999, 293:235-254.
38. Felber BK, Drysdale CM, Pavlakis GN: Feedback regulation of
human immunodeficiency virus type 1 expression by the Rev
protein. J Virol 1990, 64:3734-3741.
39. Renne R, Zhong W, Herndier B, McGrath M, Abbey N, Kedes D,
Ganem D: Lytic growth of Kaposi's sarcoma-associated her-
pesvirus (human herpesvirus 8) in culture. Nat Med 1996,
2:342-346.
40. Kuo MH, Allis CD: In vivo cross-linking and immunoprecipita-
tion for studying dynamic Protein:DNA associations in a
chromatin environment. Methods 1999, 19:425-433.
41. Spiller MP, Kambadur R, Jeanplong F, Thomas M, Martyn JK, Bass JJ,
Sharma M: The myostatin gene is a downstream target gene
of basic helix-loop-helix transcription factor MyoD. Mol Cell
Biol 2002, 22:7066-7082.
42. Holmes MC, Tjian R: Promoter-selective properties of the
TBP-related factor TRF1. Science 2000, 288:867-870.
43. de la Fuente C, Deng L, Santiago F, Arce L, Wang L, Kashanchi F:
Gene expression array of HTLV type 1-infected T cells: Up-
regulation of transcription factors and cell cycle genes. AIDS
Res Hum Retroviruses 2000, 16:1695-1700.
44. Ashburner BP, Westerheide SD, Baldwin A. S., Jr.: The p65 (RelA)
subunit of NF-kappaB interacts with the histone deacetylase
(HDAC) corepressors HDAC1 and HDAC2 to negatively
regulate gene expression. Mol Cell Biol 2001, 21:7065-7077.
45. Horak CE, Snyder M: ChIP-chip: a genomic approach for iden-
tifying transcription factor binding sites. Methods Enzymol 2002,
350:469-483.
46. Lee TI, Rinaldi NJ, Robert F, Odom DT, Bar-Joseph Z, Gerber GK,
Hannett NM, Harbison CT, Thompson CM, Simon I, Zeitlinger J, Jen-
nings EG, Murray HL, Gordon DB, Ren B, Wyrick JJ, Tagne JB, Volkert
TL, Fraenkel E, Gifford DK, Young RA: Transcriptional regulatory
networks in Saccharomyces cerevisiae. Science 2002,
298:799-804.
47. Workman JL, Kingston RE: Alteration of nucleosome structure
as a mechanism of transcriptional regulation. Annu Rev Biochem
1998, 67:545-579.
48. Verdin E, Paras P., Jr., Van Lint C: Chromatin disruption in the
promoter of human immunodeficiency virus type 1 during
transcriptional activation. Embo J 1993, 12:3249-3259.
49. Braunstein M, Rose AB, Holmes SG, Allis CD, Broach JR: Transcrip-
tional silencing in yeast is associated with reduced nucleo-
some acetylation. Genes Dev 1993, 7:592-604.
50. Mahadevan LC, Willis AC, Barratt MJ: Rapid histone H3 phospho-
rylation in response to growth factors, phorbol esters, oka-
daic acid, and protein synthesis inhibitors. Cell 1991,
65:775-783.
51. Dittmer D, Lagunoff M, Renne R, Staskus K, Haase A, Ganem D: A
cluster of latently expressed genes in Kaposi's sarcoma-asso-
ciated herpesvirus. J Virol 1998, 72:8309-8315.
52. Sun R, Lin SF, Staskus K, Gradoville L, Grogan E, Haase A, Miller G:
Kinetics of Kaposi's sarcoma-associated herpesvirus gene
expression. J Virol 1999, 73:2232-2242.
53. Sarid R, Flore O, Bohenzky RA, Chang Y, Moore PS: Transcription
mapping of the Kaposi's sarcoma-associated herpesvirus
(human herpesvirus 8) genome in a body cavity-based lym-
phoma cell line (BC-1). J Virol 1998, 72:1005-1012.
54. Rivas Carmen, Thlick Ai-En, Parravicini Carlo, Moore Patrick S.,
Chang Yuan: Kaposi's Sarcoma-Associated Herpesvirus
LANA2 Is a B-Cell-Specific Latent Viral Protein That Inhibits
p53. J Virol 2001, 75:429-438.
55. Sarid R, Wiezorek JS, Moore PS, Chang Y: Characterization and
cell cycle regulation of the major Kaposi's sarcoma-associ-
ated herpesvirus (human herpesvirus 8) latent genes and
their promoter. J Virol 1999, 73:1438-1446.
56. Zhu FX, Cusano T, Yuan Y: Identification of the immediate-
early transcripts of Kaposi's sarcoma-associated herpesvirus.
J Virol 1999, 73:5556-5567.
57. Sun R, Lin SF, Gradoville L, Yuan Y, Zhu F, Miller G: A viral gene
that activates lytic cycle expression of Kaposi's sarcoma-
associated herpesvirus. Proc Natl Acad Sci U S A 1998,
95:10866-10871.
58. Lukac DM, Renne R, Kirshner JR, Ganem D: Reactivation of
Kaposi's sarcoma-associated herpesvirus infection from
latency by expression of the ORF 50 transactivator, a
homolog of the EBV R protein. Virology 1998, 252:304-312.
59. Lin Su-Fang, Robinson Dan R., Miller George, Kung Hsing-Jien:
Kaposi's Sarcoma-Associated Herpesvirus Encodes a bZIP
Protein with Homology to BZLF1 of Epstein-Barr Virus. J
Virol 1999, 73:1909-1917.
60. Lukac DM, Kirshner JR, Ganem D: Transcriptional activation by
the product of open reading frame 50 of Kaposi's sarcoma-
associated herpesvirus is required for lytic viral reactivation
in B cells. J Virol 1999, 73:9348-9361.
61. Liang J, Slingerland JM: Multiple Roles of the PI3K/PKB (Akt)
Pathway in Cell Cycle Progression. Cell Cycle 2003, 2:339-345.
62. Vojtek AB, Taylor J, DeRuiter SL, Yu JY, Figueroa C, Kwok RP, Turner
DL: Akt regulates basic helix-loop-helix transcription factor-
coactivator complex formation and activity during neuronal
differentiation. Mol Cell Biol 2003, 23:4417-4427.
63. Lipskaia L, Pourci ML, Delomenie C, Combettes L, Goudouneche D,
Paul JL, Capiod T, Lompre AM: Phosphatidylinositol 3-kinase and
calcium-activated transcription pathways are required for
VLDL-induced smooth muscle cell proliferation. Circ Res 2003,
92:1115-1122.
Publish with BioMed Central and every
scientist can read your work free of charge
"BioMed Central will be the most significant development for
disseminating the results of biomedical researc h in our lifetime."
Sir Paul Nurse, Cancer Research UK
Your research papers will be:
available free of charge to the entire biomedical community
peer reviewed and published immediately upon acceptance
cited in PubMed and archived on PubMed Central
yours — you keep the copyright
Submit your manuscript here:
/>BioMedcentral
Retrovirology 2004, 1 />Page 15 of 15
(page number not for citation purposes)
64. Petrik J: Microarray technology: the future of blood testing?
Vox Sang 2001, 80:1-11.
65. Kasprzak A, Zabel M: Techniques of molecular biology in mor-
phological diagnosis of DNA and RNA viruses. Folia Histochem
Cytobiol 2001, 39:97-98.
66. Adler-Storthz K, Newland JR, Tessin BA, Yeudall WA, Shillitoe EJ:
Human papillomavirus type 2 DNA in oral verrucous
carcinoma. J Oral Path 1986, 15:472-475.
67. Molecular Cloning: A Laboratory Manual. Third edition. Edited
by: Sambrook J and Russell DW. Cold Spring Harbor, NY, Cold Spring
Harbor Laboratory Press; 2001.
68. Nitsche A, Muller CW, Radonic A, Landt O, Ellerbrok H, Pauli G,
Siegert W: Human herpesvirus 6A DNA Is detected fre-
quently in plasma but rarely in peripheral blood leukocytes
of patients after bone marrow transplantation. J Infect Dis
2001, 183:130-133.
69. Saeed AI, Sharov V, White J, Li J, Liang W, Bhagabati N, Braisted J,
Klapa M, Currier T, Thiagarajan M, Sturn A, Snuffin M, Rezantsev A,
Popov D, Ryltsov A, Kostukovich E, Borisovsky I, Liu Z, Vinsavich A,
Trush V, Quackenbush J: TM4: a free, open-source system for
microarray data management and analysis. Biotechniques 2003,
34:374-378.