Báo cáo y học: "Increased sinusoidal flow is not the primary stimulus to liver regeneration" pps
Bạn đang xem bản rút gọn của tài liệu. Xem và tải ngay bản đầy đủ của tài liệu tại đây (10.34 MB, 11 trang )
RESEA R C H Open Access
Increased sinusoidal flow is not the primary
stimulus to liver regeneration
Kim E Mortensen
1*
, Lene N Conley
2
, Ingvild Nygaard
1
, Peter Sorenesen
2
, Elin Mortensen
3
, Christian Bendixen
2
,
Arthur Revhaug
4
Abstract
Background: Hemodynamic changes in the liver remnant following partial hepatectomy (PHx) have been
suggested to be a primary stimulus in triggering liver regeneration. We hypothesized that it is the increased
sinusoidal flow per se and hence the shear-stress stimulus on the endothelial surface within the liver remnant
which is the main stimulus to regeneration. In order to test this hypothesis we wanted to increase the sinusoidal
flow without performing a concomitant liver resection. Accordingly, we constructed an aorto-portal shunt to the
left portal vein branch creating a standardized four-fold increase in flow to segments II, III and IV. The impact of
this manipulation was studied in both an acute model (6 animals, 9 hours) using a global porcine cDNA microarray
chip and in a chronic model observing weight and histological changes (7 animals, 3 weeks).
Results: Gene expression profiling from the shunted segments does not suggest that increased sinusoidal flow per
se results in activation of genes promoting mitosis. Hyperperfusion over three weeks results in the whole liver
gaining a supranormal weight of 3.9% of the total body weight (versus the normal 2.5%). Contrary to our
hypothesis, the weight gain was observed on the non-shunted side without an increase in sinusoidal flow.
Conclusions: An isolated increase in sinusoidal flow does not have the same genetic, microscopic or macroscopic
impact on the liver as that seen in the liver remnant after partial hepatectomy, indicating that increased sinusoidal
flow may not be a sufficient stimulus in itself for the initiation of liver regeneration.
Background
Since Higgins and Anderson formalized the study of
liver regeneration in 1931 [1] most studies have been
conducted in a model of 70% partial hepatectomy (PHx)
in rodents. Following PHx, several pro-mitotic (IL-1, IL-
6, EGF, HGF, TNFa) and pro-apoptotic factors (TGFb,
Fas ligand ) are known to be important substances regu-
lating the initiation, propagation and termination of
liver regeneration [2-5]. Many of thes e blood borne fac-
tors are detectable several hours after PHx [6-8], and
constitute the basis for the well established “humoral
theory” of liver regeneration.
However, later studies have shown that liver regenera-
tion commences already 15 minutes after PHx (via the
detection of c-fos mRNA) suggesting more immediate
triggering events [9]. Several studies indicate that the
increased portal pressure and flow per gram remaining
liver tissue and hence sinusoidal shear stress that occurs
immediately following PHx m ay be a primary stimulus
to regenera tion [7,10,11]. Endothelial shear stress results
in the production of Nitric Oxide (NO) in the liver
[12,13] and several studies have illustrated that liver
regeneration is inhibited by administration of the NO
synthase antagonist NG-nitro-L-arginine methyl ester
(L-NAME) and restored by the NO donor 3-morpholi-
nosydnonimine-1 (SIN-1) [9,14,15]. Consequently, a
“fl ow theory” on liver regeneration has emerged. Yet, to
the best of our knowledge, no study to date has been
conducted where shear stress as the sole stimulus has
been quantified in-vivo together with the local hepati c
NO production. Thus, the link between shear stress,
NO production and the triggering of regeneration is still
unclear.
More recent studies on the genetic regulation of the
regeneration cascade have employed microarray analysis
[16-20] in rodent models of PHx using liver specific
chips and collectively describe gene expression profiles
* Correspondence:
1
Surgical Research Laboratory, Institute of Clinical Medicine, University of
Tromsoe, Tromsoe, Norway
Mortensen et al. Comparative Hepatology 2010, 9:2
/>© 2010 Mortensen et al; licensee BioMed Central Ltd. This is an Open Access article distributed under the terms of the Creative
Commons Attribu tion License ( which permits unrestricted use, distribution, and
reproduction in any medium, provided the origina l work is properly cited.
in the regenerating liver over a time span of one minute
to one week after resection. Using a novel global porcine
cDNA chip, we recently demonstrated that the immedi-
ate genetic regenerative response in the porcine liver
remnant varies according to the volume of resection
and rise in portal venous pressure in the pig. We also
found differentially expressed genes in the liver remnant
after a 75% PHx to have functions primarily related to
apoptosis, nitric oxide metabolism a nd oxidative stress,
whereas differentially expressed genes in the liver rem-
nant after a 62% PHx primarily promoted cell cycle pro-
gression [21]. In our opinion, this partially corroborates
the “fl ow the ory” of liver regeneration because the
genetic response is influenced by changes in the portal
pressure increase and differences in flow per gram liver
tissue in the respective remnants.
However, the hemodynamic changes in the liver rem-
nant resulting from PHx results not only in increased
flow and shear stress in the remaining sinusoids, but also
increased delivery of hepatotrophic factors to the repli-
cating hepatocytes. Therefore, to distinguish the effe cts
of these two potentially different stimuli (increased sinu-
soidal flow/shear-stress versus increased delivery of hepa-
totrophic factors), and further scrutinize the potential
effects of increased sinusoidal flow, we hypothesized in
the present study that, according to the “ flow theory” of
liver regeneration, it is the increased sinusoidal flow in
itself, which is the primary stimulus to liver regeneration.
Consequently, selective ly increasing the flow to segments
II, III and IV should, lead to similar gene expression pro-
files as those seen shortly after PHx, and over time, lead
to hyperplasia/hypertrophy of these segments.
To create an isolated, regional increased sinusoidal flow
in-vivo with out simultaneous liver resection, we manipu-
lated the hepatic blood supply by creating an aorto-portal
shunt to the left portal vein branch, thereby selectively
increasing the flow to segments II, III and IV to a similar
flow rate (per gram liver) as that seen after a 75% PHx
[21]. This was done in a set of acute experiments, shunt-
ing these segments over a period of 6 hours, analyzing
cell cycle regulatory genes and also in a separate set of
chronic experiments over three weeks, measuring seg-
mental liver weight and histological changes.
The results of the present study show that an isolated
increase in sinusoidal flow does not have the same
impact on the liver as that seen in the liver remnant
after partial hepatectomy, indicating that increased sinu-
soidal flow may not be a the primary stimulus for the
initiation of liver regeneration
Methods
Animal preparation
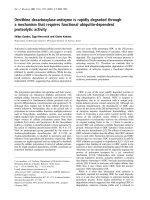
Fig. 1 displays the experimental setup. All experiments
were conducted in compliance with the institutional
animal care guidelines and the National Institute of
Health’s GuidefortheCareandUseofLaboratoryAni-
mals [DHHS Publication No. (NIH) 85-23, Revised
1985]. A total of nineteen pigs were used (Sus scrofa
domesticus), aged approximately 3 months; twelve in the
acute experiments, with an average weight of 33.5 kg (± 2
kg) and seven in the chronic experiments, with an aver-
age weight of 31.0 kg (± 2 kg). In the acute series, we fol-
lowed the same anesthesia protocol as previously
described [21]. In the chronic series, anesthesia for the
surg ical inter vention was maintained with isoflurane 1.5-
2% mixed with 55% oxygen. Respiratory rate was adjusted
to achieve an Et CO2 between 3.5 and 6 KPa. Mean
alveolar concentration of isoflurane was maintained at
1.3 using a Capnomac (Nycomed Jean Mette). Analgesia
was induced and maintained with fentanyl 0.01 mg/kg.
Before surgery, all animals received a single i.m. shot of
antibiotic prophylaxis (Enrofloxacin, 2.5 mg/kg).
Catheters
In the acute series, a 16G central venous cat heter (CVK,
Secalon® T) was placed in the left external jugular vein
for administr ation of anesthesia and infusions. A 5
French Swan-Ganz catheter (Edwards Lifesciences™) was
floated via the right external jugular vein to the pulmon-
ary artery for cardiac output (CO) measurements. A
16G CVK (Secalon® T) was placed in the left femoral
artery for continuous arterial blood pressure monitoring.
A 7 French 110 cm angiographic catheter (Cordis®,
Johnson&Johnson™) was placed in the right hepatic vein
draining segments V, VI, VII and VIII via the right
internal jugular vein for blood pressure monito ring and
blood sampling. A 5 French Swan-Ganz catheter
(Edwards Lifesciences™ ) was placed in the hepatic vein
draining segments II and III by direct transhepatic pla-
cement for pressure monitoring and blood sampling.
Inflation of the balloon allowed wedged hepatic pressure
measurement. A pediatric CVK (Arrow® International)
was placed in the portal vein for blood pressure moni-
toring and blood sampling.
No catheters were placed in the pigs in the chronic
series, as the main objective here was to anastomose the
shunt from the aorta to the left portal ve in branch with
minimal damage to the hepatic hilus.
Measurements
Acute series
Calibrated transducers (Transact 3™ , Abbott Critical
Care Systems, Chicago, IL, USA) were used for continu-
ous pressure registration and signals were stored elec-
tronically (Macintosh Quadra 950, Apple Computers,
CA, USA). Perivascular ultrasonic flow probes (Cardi-
oMed Systems, Medistim A/S, Oslo, Norway) were
placed around the portal vein, right hepatic artery, left
hepatic artery and around the aortoportal shunt. Cardiac
output was measured by thermo dilution (Vigilance™
Mortensen et al. Comparative Hepatology 2010, 9:2
/>Page 2 of 11
Volumetrics, Edwards Lifesciences™ ). Measurements
were made in triplicate and averaged. The heart rate
was monitored with an electrocardiogram (ECG).
Chronic series
The heart rate was monitored with an ECG. Flow in the
aortoportal shunt was measured using an 8 mm perivas-
cular ultrasonic flow probe (CardioMed Systems, Medi-
stim A/S, Oslo, Norway).
Surgery
Acute series
After a midline laparotomy and placement of all catheters
and flow probes as described above, we isolated and
recorded the flow in the left portal vein branch (LPVB).
When the activated clotting time (ACT) was above 250
seconds, a 5 mm Propaten Gore-Tex™ graft was anasto-
mosed end-to-side from the aorta (between truncus coe-
liacus (TC) and the superior mesenteric artery (SMA)) to
the LPVB. The LPVB was then ligated proximal to the
bifurcation to prevent backflow to the main portal vein
trunk (MPVT). The opening of the shunt was regarded as
time = 0 and noted. Flow in the shunt was standardized in
each experiment to 1000 mL/minute by gradual shunt
constriction using a ligature and a perivascular flow probe
(Fig. 1). Sham surgery consisted of all the steps above
except for the establishment of the aortoportal shunt.
Chronic series
After a midline laparotomy, a similar shunt was placed
from the aorta to the LPVB once the animal had
received 5000 IE heparin i.v. We used an interposed
aorta graft from a donor pig (as the Gore-Tex grafts™
tended to become occluded). The LPVB was ligated
proximal to the portal bifurcation to prevent backflow
to the MPVT. Flow was standardized (by concentric
constriction with a ligature) to 1000 mL/minute. Upon
relaparatomy three weeks later, the shunt was isolated
and flow measured. The flow in the MPVT (now sup-
plying the right liver only) was recorded.
Sampling
In the acute series, sequential biopsies were taken from
the shunted segments II, III and IV at time points 1, 5,
10,30,60,90minutesand2,3,4and6hoursafter
shunt opening (t = 0). The sampling time points were
thesameasinapreviousstudyofliverregeneration
after PHx [21] using the same microarray platform
allowing the direct comparison of gene expression pro-
files found in the present experiments with the former.
Biopsies were placed immediately in RNAlater
(Ambion®).
Blood extraction was performed before biopsy sam-
pling. Samples were taken from the portal vein, femoral
artery, and hepatic vein draining both sides of the liver.
Aspartate aminotransferase (ASAT), alanine aminotrans-
ferase (ALAT), glutamyl transpeptidase (GT), glucose,
bilirubin (Bil) and alkaline phosphatase (ALP) levels
were quantified by calorimetric, ultraviolet-photometric,
and HPLC analysis (Roche, PerkinElmer).
For cytokine analysis, a multiplex kit was developed
including four different cytokines; TNF-a,IL-1a,IL-6
Figure 1 Experimental setup. In the acute series, flow and pressur e in all vascular structures to the l iver were recorded continuously for the
whole experiment. In the chronic series, flow in the aortoportal shunt was recorded upon establishment and after three weeks upon
relaparatomy.
Mortensen et al. Comparative Hepatology 2010, 9:2
/>Page 3 of 11
and IL-10. Serum samples was analyzed in duplicates
using the Luminex 200™ with the Bioplex manager soft-
ware (BioRad, Hercules, CA) [22].
In the sham series, liver biopsies were taken from seg-
ments II, III and IV and blood was sampled from the
same locations at the same time points as in the
shunted animals.
In the chronic series, only peroperative arterial blood
gas samples were taken (directly from the aorta) to
monitor respiratory status.
Histological assessment
To evaluate the long-term (3 weeks) effects of arterial
hyperperfusion on the liver parenchyma we took biop-
sies from both the shunted and the portally perfused
sides of the liver before and after shunting. Specimens
were fixed in buffered formalin, paraf fin embedded, and
stained with hematoxylin-eosin (HE) to evaluate tissue
architecture. To evaluate proliferative activity, sections
were stained with Ki67 and phosphohisto ne H3. The
proliferative index was estimated by counting the num-
ber of Ki67 positive cells relative to the number of non-
stained hepatocytes per liver lobuli. Connective tissue
distribution was studied using reticulin staining. An
independent pathologist (EM) reviewed the sections in a
blinded manner.
Microarray analysis
Two-color microarray analyses of the samples from the
acute series were cond ucted to identify genes being sig-
nificantly differentially expressed between the different
time-points. The microarray experiment was conducted
as a common reference design using liver total-RNA
purified from an unrelated a nimal as the reference.
Total-RNA was extracted and aminoallyl-cDNA (aa-
cDNA)wassynthesizedfrom20μgoftotal-RNA.The
reference samples were labeled with Alexa 488 and indi-
vidual samples were labelled with Alexa 594. The sam-
ples were hybridized to the pig array DIAS_PIG_55K3,
which consist of 26,879 PCR products amplified from
unique cDNA clones. Following hybridization, washing
and drying, the slides were scanned and the median
intensities were computed. Statistical analysis was car-
ried out in the R computing environment using the Bio-
conductor package Limma. The log2-transformed rat ios
of Alexa-5 94 to Alexa-488 were normalized within-slide
using the loess function and were analyzed to identify
gene s being significantly differentially expressed by time
within treatment as well as between treatments. Time
contrasts were formed referring to the sample taken at
time point 1 min. Furthermore, multiple testing across
contrast s and genes was conducted. The false discovery
rate was controlled using the method o f Benjamini and
Hochberg [23] as implemented in Limma. The genes
were further analyzed by utilizing information from
Online Mendelian Inheritance in Man (OMIM, [24]) to
group the genes by function. More detailed descriptions
of the microarray experiments are available at the
NCBIs Gene Expression Omnibus [25,26] th rough the
GEO series accession number GSE13683.
Statistical analysis
Substrate flux across the liver remnant was analyzed
using linear mixed models in SPSS 15, testing time (T),
and group*time ( GT) interaction. P values ≤ 0.05 were
considered significant. A nalysis of diff erences in hemo-
dynamic changes between the shunt- and sham groups
was analyzed using scale-space analysis of time series
[27]. Comparison of group differences at specific time
points was done using a two-tailed Student’s t-test with
the Bonferroni correction for multiple measurements.
Results are expressed as mean values ± SD.
Results
Hemodynamics of the acute series (Additional file 1:
Table S1)
Upon opening the shunt, the mean arterial pressure
(MAP) decreased from 90.3 to 70.3 mmHg (p = 0.01).
The system ic vascular resistance (SVR) fell from 16.5 to
11.2 mmHg min/mL (p = 0.002). A reciprocal increase
in heart rate from 100 to 150 beats per minute (p <
0.05) and a sustained increase in cardiac output (CO)
from 5.01 to 6.65 mL/minute was observed (not signifi-
cant due to large standard deviation). This was in con-
trast to the sham animals, where these parameters
remained unchanged throughout the same time period.
The flow in the LPVB increased from the normal
average of 221 ml/minute of portal blood flow to an
average of 1050 ml/minute of arterial blood flow as a
result of the aortoportal shunting. This increased the
flow/gram liver in the shunted side by a factor of 4.7
from 0.61 mL/minute/gr am to 2.89 mL/min ute/gram (p
< 0.001). The flow in the right portal vein branch
(RPVB) decreased slightly from 647 mL to 636 mL after
ligating the LPVB. Hereafter, the flow fell gradually
throughout the experiment, the flow becoming increas-
ingly lower over time compared to the sham group (p =
0.01). No significant change in flow per gram liver in
the portally perfused segments was observed (1.57 mL/
minute/gram to 1.53 mL/minute/gram).
Conversely, the portal venous pressure (PVP) (in the
MPVT) increased in the shunt group from an average of
6.22 to 8.55 mmHg (after ligation of the LPVB) whilst
the PVP decreased in the sham group from an average
of 6 to 5 mmHg, the pressure change trends being sig-
nificantly different in the two groups (p < 0.05).
Upon opening the shunt, the flow fell abruptly in the
left hepatic artery from 169 to 122 mL/min and contin-
ued to fall significantly throughout the experiment (p =
0.023). The flow in the right hepatic artery also
decreased abruptly from 85 to 46 mL/min upon opening
Mortensen et al. Comparative Hepatology 2010, 9:2
/>Page 4 of 11
the shunt and fell in a similar manner over time (p =
0.022).
The free hepatic venous pressure remained unchanged
in both right and left hepatic veins in both shunt and
sham groups. However, the wedged pressure in the left
hepatic vein in the shunt group increased significantly
from 2.33 to 8 mmHg over six hours, in contrast to the
sham group where the pressure remained unchanged
(group*time interaction, p = 0.003).
Hemodynamics of the chronic series (Additional file 1:
Table S1)
Shunt: the averag e flow in the aortoportal shunt at
opening of the shunt, t = 0, was 1007 mL/minute. Upon
relaparotomy (t = 3 weeks), this had increased to1496
mL/minute (p = 0.004). However, the weight of the seg-
ments hyperperfused (segments II, III and IV) also
increased from 341.5 grams (calculated by using data
from a weight matched group of 6 pigs) to 633.9 grams
(p = 0.0001), thus the flow per gram liver decreased
from 2.97 to 2.38 mL/minute/gram (p = 0.045).
Portal flow: to avoid postoperative morbidity due to
damage and following leakage of the lymphatics in the
liver hilus, we did not expose the main portal vein trunk
at t = 0 in the chronic series. The average flow in the
main portal trunk at t = 0 was therefore calculated by
using data from a weight matche d group of 12 pigs
where the average flow in the main portal vein was 850
mL/minute. By adjusting the flow to segments I, V, VI,
VII and VIII, according to the weight that these seg-
ments comprised, the flow was calculated to be 459 mL/
minute (± 74) to these segments. At relaparatomy (t = 3
weeks) the flow in the portal vein (now supplying only
the right liver, segments I, V, VI, VII and VIII) was
1120 mL/minute. Accordingly, the flow to these seg-
ments had increased significantly (p =0.008).However,
due to the weight increase of these segments over three
weeks, the flow per gram liver actually decre ased from
2.07 to 1.08 mL/minute/gram (p < 0.0001).
Macroscopic changes in the chronic series
Over a period of three weeks the pigs gained weight
from 30.9 to 41.9 Kg ( p = 0.0002). The total liver weight
of six weight-matched pigs was 754 grams (± 107) at t =
0. After three weeks, the total liver weight in the
shunted pigs had increased to 1667 grams ( ± 223) ( p =
< 0.0001). By calculating the liver weight/body weight
percentagewegetanincreasefrom2.74%att=0to
3.99% at t = 3 weeks (p = 0.004). The weight of seg-
ments I, V, VI, VII and VIII in the weight-matched pigs
at t = 0 was 412.8 grams (± 71.5). The weight of these
segments at t = 3 weeks in the shunted animals was
1034.5 grams (± 166.5). The w eight of segments II, III
and IV at t = 0 was 341.6 (± 36.9). The weight of these
segments at t = 3 weeks was 633.3 grams (± 109.2). Cal-
culating the liver weight/body weight ratio by segments
wefoundanincreasein%forsegmentsI,V,VI,VII
and VIII from 1.49 to 2.47% (p =0.002)andforseg-
ments II, III and IV from 1.24 to 1.52% (not significant)
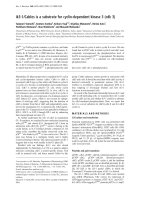
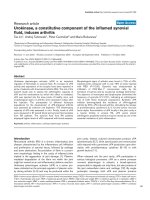
(Table S1, Additional file 1 and Fig. 2).
Macroscopically, a sharp line of demarcation between
the shunted and portally perfused sides of the liver was
seen on the organ surface (in vivo) upon relaparatomy
at t = three weeks (Fig. 3a). This line corresponded to
Figure 2 Liver/body weight ratio (%) by segments before and after 3 weeks of aortoportal shunting of segments II, III and IV. The total
liver weight increases over three weeks, the increase occurring in the non-shunted segments (I, V, VI, VII and VIII).
Mortensen et al. Comparative Hepatology 2010, 9:2
/>Page 5 of 11
the transitional zone between segments IV (perfused by
the shunt) and V/VIII (perfused by the portal vein).
Furthermore, we observed that the liver lobuli had
become larger on the portally perfused side.
Microscopic changes
On microscopic examination with HE staining (of biop-
sies taken from the chronic experiments), the lobuli on
the shunted arterialized side exhibited condensed, smal-
ler liver lobuli. However, reticulin staining revealed no
increase in con nective tissue deposition between portal
triads. Furthermore, no apparent bile duct hyperplasia
could be seen or overt signs of damage due to hyperper-
fusion. On the portally perfused side, the lobuli were
expanded, the hepatocytes larger (increased cytoplasm),
and the sinusoids, portal venules as well as the central
veins were dilated. There were no differences in the
density of Ki67 positive cel ls or Phosphohistone H3
positive cells between the two sides (Fig. 3b, c). Control
sections from sham animals and at baseline before
shunting revealed uniformly less Ki67 positive cells in
the liver lobuli, tentatively reflecting the pre-interven-
tional normal state.
Biochemical/cytokine analyses (acute experiments)
There were no statistically significant changes in the
concentration of ALAT, ASAT, GT, BIL or ALP at any
time nor were there any differences in t rends between
shunt and sham groups.
Serum IL-1 concentration increased slightly but
remained statistically unchanged in the sham experi-
ments. In the shunt experiments, IL-1 concentration
reached a peak value (63 ± 93 pmol/l) at t = 4 hours
after shunt o pening (p = 0.009). Serum IL-6 remained
unchanged in the sham experiments. In the shunt
groups, IL-6 reached a peak value of 596 (± 722 p mol/
L)att=4hours(p = 0.004). TNF-a was at most time
points undetectable in the sham groups. However, in
the shunt group we found a peak value of 20 (± 24
pmol/L)att=4hours(p = 0.0009). IL-10 concentra-
tions increased in both groups reaching a maximum
valueof12(±14pmol/L)intheshuntgroup(p =
0.0007) and 8 (± 9 pmol/L) in the sham group (p =
0.004), both at t = 2 hours. There were no significant
differences in concentrations of t he above cytokines in
the venous blood draining the shunted segment s and in
blood draining the portally perfused segments in the
shunted animals - the differences were found between
the shunt and sham animals as a whole.
Gene expression (Additional file 2: Table S2, for full name
and synonyms of gene abbreviations used in the
following text)
By analyzing differences between the shunt and sham
groups at individual sampling time points and examining
potential functions of the gene products by categorization
according to cellular process and molecular function
(Gene Ontology) we found that in terms of genetic func-
tion, although there were many genes whose expression
differed in the two groups at each time point of sampling
after shunt opening and sham surgery, the functional dis-
tribution of the potential gene products were similar in
both groups. However, there were far more genes differ-
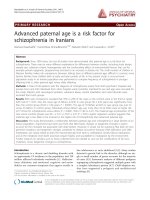
entially expressed in the sham group (Fig. 4).
By analyzing differential gene expression over time
within the sham and shunt groups, we found major
quantitative and qualitative differences. Not only were
there by far more genes differentially expressed in the
sham group, but genes associated with the regulation of
the cell cycle and apoptosis found in previous studies
[16,18-20] were more prominent (Additional file 3:
Table S3).
Cell cycle/apoptosis genes differentially expressed in the
shunt series (Additional file 3: Table S3)
PTMA (upregulated at 3h-1’ interval) dually regulates
apoptosis by modulating the caspase cascade as it inhi-
bits the activation of procaspase 9 by Apaf1 but at the
same time, inhibits caspase 9 itself [28]. SCYL 2 (down-
regulated at 3h-1’ and upregulated at 6h-1’) is associated
with SCYL 1, a gene involved in centrosome formation
and mitosis [29]. MAPK8IP2, (downregulated at 6h-1’)
potentially counteracts apoptosis [30].
Cell cycle/apoptosis genes differentially expressed in the
sham series (Additional file 3: Table S3)
Upregulated genes: KIF 4A (5-1’) and KIF 1B (6h-1’)are
associated with KIF 20A, which regulates the organiza-
tion of the microtubuli apparatus, involved in cell divi-
sion [31]. NME1 (5-1’ , 30-1’ ,3h-1’ ) potentially
counteracts DNA damage and cytolysis [32,33]. MAP-
K8I P2 (5-1’,2h-1’) inhibits apoptosis [30]. UBE2C (5-1’,
2h-1’,4h-1’) facilitates progression of the cell cycle via
APC activation and increased cyclin A [34]. UBE2M
(hUbc12) is a conjugatin g enzyme for NEDD8, involved
in the u biquitinylation of cell-cycle factors involved in
the G1/S transition [35]. IGFBP3 (5-1’ ) is associated
with IGFBP5, which in turn may lead to cell cycle arrest
in the G2/M phase [36]. CDK5 (10-1’)associatedwith
CDK6 promotes cell cycle transition in the G1 phase
[37].
Downregulated genes: MAPK13 (5-1’,30-1’,3h-1’,4h-
1’ ,6h-1’) is one of several protein kinases activated by
cellular stresses (including oxidative stress) and cyto-
kines IL-1 and TNFa and has been found to be a down-
stream carrier of the PKCdelta-dependent death signal
[38]. Over expression of BTG3 (1 0-1’ ,4h-1’ )hasbeen
shown to impair serum-induced cell cycle progression
from the G0/G1 to S phase [39]. UBE2C promotes pro-
gression of the cell cycle [34]. Bcl-rambo (2h-1’,3h-1’,
4h-1’ )isaBcl-2 member that induces cell death [40].
MAPK6 (3h-1
’,6h-1’ ) - over expression of this gene in
NIH 3T3 cells has been seen to inhibit DNA synthesis
Mortensen et al. Comparative Hepatology 2010, 9:2
/>Page 6 of 11
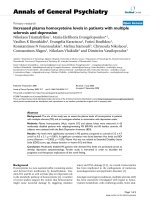
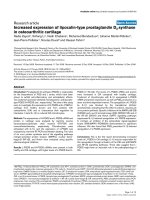
Figure 3 Macro-and microscopic changes after three weeks of sh unting. a) Close-up photograph of the transition zone between shunted
and portally perfused in-vivo liver after three weeks. The shunted side exhibits smaller condensed lobuli and a brighter (hyperoxygenized) color,
while the portally perfused side exhibits larger lobuli, b) HE stained section of the transition zone showing more condensed lobuli on the
shunted side and larger lobuli with dilated portal venules and central veins on the portally perfused side, c) sections from areas perfused by the
portal vein and by the shunt showing an even distribution of Ki67 positive cells (control sections of sham and baseline livers all show a lower
density of Ki67 positive cells).
Mortensen et al. Comparative Hepatology 2010, 9:2
/>Page 7 of 11
and G1 phase arrest [41] and the nucleocytoplasmic
shuttling of ERK3 regulates its inhibitory action on cell
cycle progression [42]. MDM2 transcriptional (3h-1’, 6h-
1’ ) products form complexes with p53 in the G0/G1
phases of the cell cycle and inhibit the G1 arrest and
inhibitory functions of p-53 [43].
Discussion
In this study we find that an isolated increase in sinusoi-
dal flow does not have the same macroscopic, micro-
scopic or genetic impact on the liver as that seen in the
liver remnant after partial hepatectomy. Our findings
indicate that increa sed sinusoidal flow may not be a suf-
ficient stimulus in itself for the initiation of liver
regeneration.
On histological examination of the transition zone
between the shunted and portally perfused sides (Fig. 3),
we found the liver lobuli larger on the portally perfused
side as previously observed by other i nvestigato rs [44].
Theexpansionwastheresultofnotonlyslightlycon-
gested sinusoids, but also by, in general, larger hepato-
cytes. These changes suggests to us t hat after three
weeks of mainly portal perfusion (the right hepatic
artery was intact) to segments I, V, VI, VII and VIII, the
metabolic and hepatot rophic stimuli from the splanch-
ninc blood results in selective growth of these segments,
independently from the shunted contra lateral side
(segments II, III and IV). The finding that the prolifera-
tive index and phosphohistone H3 distribution is similar
in both sides at t = 3 weeks, suggests that this selective
growth may be the result of hepatocyte hypertrophy.
Microarray analysis of the liver biopsies (from the
acute series) indicate that the shunting had a quantita-
tive impact on gene expression in th e shunted segments
as compared with the gene expression in the same seg-
ments in the sham animals, the effect being a relative
general down-regulation in transcriptional activity in the
shunted liver (Fig. 4).
On the basis of microarray analysis of biopsies from
the shunted liver segments and sham livers we found
that not only were there by far more genes differentially
expressed in the sham livers, but genes associated with
the regulation of the cell cycle and apoptosis found in
previous studies [16,18,20,21] were more prominent
(Additional file 3: Table S3).
Specific evaluation of the differential expressed genes
regulating the cell cycle and apoptosis in the shunt group
revealed that they we re not only quantitatively insign ifi-
cant compared to the sham group, but also qualitatively
equivocal as their potential f unctions diverged (some
promote and some inhibit mitosis). On the contr ary, all
upregulated genes associated with the cell c ycle and
apoptosis in the sham group potentially promote cell
division and inhibit ap optosis (with the exception o f
Figure 4 Functional distribution of differentially expressed genes. Illustration of differentially expressed genes at given time points sorted
by genetic function according to Gene Ontology in the shunted and sham pigs (contrasts within time points).
Mortensen et al. Comparative Hepatology 2010, 9:2
/>Page 8 of 11
IGFBP5). Furthermore, with the exception of UBE2C,the
differential expression of all downregulated genes asso-
ciated with the cell cycle in the sham group also favored
cell cycle progression (Additional file 3: Table S3).
As a whole, the microarray analysis of the immediate
gene expr essional activity in the shunted an d sham
livers indicate a relative increase in general transcrip-
tional activity and a more pronounced activity of cell
cycle promoting genes in the sham livers relative to the
shunted livers.
When comparing gene expression during aorto-portal
shunting in the present study to the profiles found after
liver resection [21] we find two differentially expressed
genes, common to both interventions, both involved in
apoptosis signalling. PTMA was upregulated at 3 hours
after a high pressure liver resection and aorto-portal
shunting respectively, and MAPK8IP2 was upregulated
90 minutes after a high pressure liver resection and
after 6 hours of aorto-portal shunting. The differential
expression of these genes tentatively reflects the large
hemodynamic impact of both interventions on cellular
stress and apoptosis mechanisms.
How can we explain our observation that the non-
shunted, portally perfused side of t he liver grows after
three weeks, resulting in the liver’s supranormal weight
gain to 3.9% of body weight while the weight percentage
of the shunted side does not change in the same period?
Firstly, the shunted blood was arterialized. It may be
that this increase in oxygen ation may have been unphy-
siological to such an extent that any potential growth
stimulating flow stimulus on th e endothelial surface was
suppressed. However, a high oxygen tension in portal
venous blood has been shown to be beneficial for regen-
eration after extended PHx in rats and for the outcome
of acute liver failure in swine [45,46]. Furthermore, ana-
lysis of the flux of liver enzymes, GT, ALP and bilirubin
flux across the liver bed and cytokine analysis o f blood
draining the shunted segments in the acute series, and
histological analysis of HE stained sections, does not
suggest any immediate deleterious effect on the liver
parenchyma as a result of the shunting.
Secondly, ligating the left portal vein branch proximal to
the anastomosed aortoportal shunt results in a portal pres-
sure increased from 6.22 mmHg to 8.55 mmHg (p < 0.05)
however, the flow per gram liver in these portally perfused
(not shunted) segments remained unchanged (1.57 to 1.53
mL/gram/minute, not significant) whereas the flow in the
shunted segments increased significantly from an average
of 0.61 to 2.89 mL/gram/minute after shunt opening giv-
ing a 4.75 fold increase in flow which is similar to the flow
increase seen after a 75% PHx [21]. Thus, it may be that it
is not the quantity of blood perfusing the liver sinusoids in
the remnant which is detrimental to liver regeneration,
but rather the quality of the blood (with hepatotrophic
factors) as previously suggested by Michalopoulos [47].
Supportive of this theory is the findings of Ladurner et al.
where extended hepatic resection with or without decom-
pressive portocaval shunting (and thus significant differ-
ences in flow in the liver remnant) did not reveal
differences in liver regeneration [48]. Conceivably equally
important, are the increased metabolic tasks per gram
remaining liver imposed on the liver remnant which may
lead to its growth.
We mainta in, on the basis of this experiment, that the
flow theory of increased shear stress as a primary stimu-
lus to liver regeneration is questionable because it is the
non-shunted, portally perfused side which hypertrophies
despite the fact that flow per gram liver on this side
remains unchanged. In contrast to this, the shunted seg-
ments exhibited contracted lobuli, no increase in volume
and a general downregulation in transcriptional activity.
We suggest that the portally perfused side of the liver
hypertrophied due to a combination of increased meta-
bolic demand (due to the functional deficiency of the
shunted side) and the presence of hepat otrophic growth
factors in the portal perfusate.
Finally, is it justifiable to study the process of liver
regeneration without performing a resection? In our
opinion, yes, b ecause the moment one performs a liver
resection, the relative increase in growth factors sup-
plied, and the increase in metabolic demand on the liver
remnant confounds the study of an isolated increase in
flow per gram remaining liver parenchyma. It is there-
fore necessary to create an “ unphysiological “ state to
study an isolated phenomenon in vivo.
Conclusions
Onthebasisofthepresentstudyweconcludethatan
isolated acute and chronic increase in sinusoidal flow
does not have the same genetic, microscopic or macro-
scopic impact on the liver as that seen in the liver rem-
nant after partial hepatectomy, indicating that increased
sinusoidal flow may not be a sufficient stimulus in itself
for the initiation of liver regeneration.
Additional file 1: Tabular data 1. Hemodynamics and liver weight
changes in acute- and chronic series.
Click here for file
[ />S1.PDF ]
Additional file 2: Tabular data 2. Full name and synonyms of gene
abbreviations used in the article text.
Click here for file
[ />S2.PDF ]
Additional file 3: Tabular data 3. Differentially expressed genes
regulating cell cycle and apoptosis. Light grey correspond to upregulated
genes and dark grey highlights the downregulated ones.
Click here for file
[ />S3.PDF ]
Mortensen et al. Comparative Hepatology 2010, 9:2
/>Page 9 of 11
Acknowledgements
The authors acknowledge the essential contributions of Ellinor Hareide,
Hege Hagerup, Viktoria Steinsund, Harry Jensen and Trine Kalstad at the
Surgical Research Laboratory, and Hege Hasvold, Siri Knudsen, and Ragnhild
Olsen in the Animal Department, Faculty of Medicine, University of Tromsoe.
The University of Tromsoe and the Northern Norway Regional Health
Authority funded all of the above contributors. This work performed by the
main author (KEM) was supported by a grant from the Northern Norway
Regional Health Authority and The Research Council of Norway. IN, EM, and
AR were funded by the University of Tromsoe. LNC, PS, and CB were funded
by the University of Aarhus, Denmark.
Author details
1
Surgical Research Laboratory, Institute of Clinical Medicine, University of
Tromsoe, Tromsoe, Norway.
2
Faculty of Agricultural Sciences, Department of
Genetics and Biotechnology, University of Aarhus, Aarhus, Denmark.
3
Department of Pathology, University Hospital of Northern-Norway, Tromsoe,
Norway.
4
Department of Gastrointestinal Surgery, University Hospital of
North-Norway, Tromsoe, Norway.
Authors’ contributions
KEM authored the study protocol, performed all surgical experiments,
interpreted all results drafted and revised the manuscript. LNC was
responsible for all aspects of the microarray analysis including parts of the
biostatical analysis. IN made substantial contributions to data acquisition. PS
conducted and supervised the biostatistical analysis of the microarray data.
EM was responsible for the preparation, analysis and interpretation of
histological sections. CB supervised the microarray analysis and made
contributions to its biological interpretation. AR was responsible for
conceiving the protocol hypothesis and study design and supervised
manuscript drafting and revising its intellectual content.
All authors have read and approved the final manuscript.
Competing interests
The authors declare that they have no competing interests.
Received: 16 August 2009
Accepted: 20 January 2010 Published: 20 January 2010
References
1. Higgins G, Anderson GM: Experimental Pathology of the Liver.
Restoration of the liver of the white rat following partial surgical
removal. Arch Pathol 1931, 12:186-202.
2. Cressman DE, Greenbaum LE, DeAngelis RA, Ciliberto G, Furth EE, Poli V,
Taub R: Liver failure and defective hepatocyte regeneration in
interleukin-6-deficient mice. Science 1996, 274:1379-1383.
3. Desbarats J, Newell MK: Fas engagement accelerates liver regeneration
after partial hepatectomy. Nat Med 2000, 6:920-923.
4. Fausto N: Liver regeneration. J Hepatol 2000, 32:19-31.
5. Taub R: Liver regeneration: From myth to mechanism. Nat Rev Mol Cell
Biol 2004, 5:836-847.
6. Mars WM, Liu ML, Kitson RP, Goldfarb RH, Gabauer MK, Michalopoulos GK:
Immediate-Early Detection of Urokinase Receptor After Partial-
Hepatectomy and Its Implications for Initiation of Liver-Regeneration.
Hepatology 1995, 21:1695-1701.
7. Niiya T, Murakami M, Aoki T, Murai N, Shimizu Y, Kusano M: Immediate
increase of portal pressure, reflecting sinusoidal shear stress, induced
liver regeneration after partial hepatectomy. J Hepatobiliary Pancreat Surg
1999, 6:275-280.
8. Wang HH, Lautt WW: Hepatocyte primary culture bioassay: A simplified
tool to assess the initiation of the liver regeneration cascade. J
Pharmacol Toxicol Methods 1997, 38:141-150.
9. Schoen JM, Lautt WW: Nitric oxide potentiates c-fos mRNA expression
after 2/3 hepatectomy. Proc West Pharmacol Soc 2002, 45:47-48.
10. Sato Y, Koyama S, Tsukada K, Hatakeyama K: Acute portal hypertension
reflecting shear stress as a trigger of liver regeneration following partial
hepatectomy. Surg Today - Jap J Surg 1997, 27:518-526.
11. Sato Y, Tsukada K, Hatakeyama K: Role of shear stress and immune
responses in liver regeneration after a partial hepatectomy. Surg Today -
Jap J Surg 1999, 29:1-9.
12. Macedo MP, Lautt WW: Shear-induced modulation of vasoconstriction in
the hepatic artery and portal vein by nitric oxide. Am J Physiol
Gastrointest Liver Physiol 1998, 37:G253-G260.
13. Wang HH, Lautt WW: Evidence of nitric oxide, a flow-dependent factor,
bein a trigger of liver regeneration in rats. Can J Physiol Pharmacol 1998,
76:1072-1079.
14. Garcia-Trevijano ER, Martinez-Chantar ML, Latasa MU, Mato JM, Avila MA:
NO sensitizes rat hepatocytes to proliferation by modifying S-
adenosylmethionine levels. Gastroenterology 2002, 122:1355-1363.
15. Schoen JM, Wang HH, Minuk GY, Lautt WW: Shear stress-induced nitric
oxide release triggers the liver regeneration cascade. Nitric Oxide 2001,
5:453-464.
16. Arai M, Yokosuka O, Chiba T, Imazeki F, Kato M, Hashida J, et al: Gene
Expression Profiling Reveals the Mechanism and Pathophysiology of
Mouse Liver Regeneration. J Biol Chem 2003, 278:29813-29818.
17. Fukuhara Y, Hirasawa A, Li XK, Kawasaki M, Fujino M, Funeshima N,
Katsuma S, Shiojima S, Yamada M, Okuyama T, Suzuki S, Tsujimoto G: Gene
expression profile in the regenerating rat liver after partial hepatectomy.
J Hepatol 2003, 38:784-792.
18. Locker J, Tian JM, Carver R, Concas D, Cossu C, Ledda-Columbano GM,
Columbano A: A common set of immediate-early response genes in liver
regeneration and hyperplasia. Hepatology 2003, 38:314-325.
19. Su AI, Guidotti LG, Pezacki JP, Chisari FV, Schultz PG: Gene expression
during the priming phase of liver regeneration after partial
hepatectomy in mice. PNAS 2002, 99:11181-11186.
20. White P, Brestelli JE, Kaestner KH, Greenbaum LE: Identification of
transcriptional networks during liver regeneration. J Biol Chem 2005,
280:3715-3722.
21. Mortensen KE, Conley LN, Hedegaard J, Kalstad T, Sorensen P, Bendixen C,
Revhaug A: Regenerative response in the pig liver remnant varies with
the degree of resection and rise in portal pressure. Am J Physiol
Gastrointest Liver Physiol 2008, 294:G819-G830.
22. Johannisson A, Jonasson R, Dernfalk J, Jensen-Waern M: Simultaneous
detection of porcine proinflammatory cytokines using multiplex flow
cytometry by the xMAP (TM) technology. Cytometry Part A 2006, 69A:391-
395.
23. Benjamini Y, Hochberg Y: Controlling the false discovery rate - A practical
and powerful approach to multiple testing. J Royal Stat Soc: Ser B(Stat
Methodol) 1995, 57:289-300.
24. Online Mendelian Inheritance in Man (OMIM). ij-genetics.
org/search_omim.html.
25. Barrett T, Suzek TO, Troup DB, Wilhite SE, Ngau WC, Ledoux P, Rudnev D,
Lash AE, Fujibuchi W, Edgar R: NCBI GEO: mining millions of expression
profiles - database and tools. Nucleic Acids Res 2005, 33:D562-D566.
26. Edgar R, Domrachev M, Lash AE: Gene Expression Omnibus: NCBI gene
expression and hybridization array data repository. Nucleic Acids Res 2002,
30:207-210.
27. Mortensen KE, Godtliebsen F, Revhaug A: Scale-space analysis of time
series in circulatory research. Am J Physiol Heart Circ Physiol 2006, 291:
H3012-H3022.
28. Jiang XJ, Kim HE, Shu HJ, Zhao YM, Zhang HC, Kofron J, Donnelly J,
Burns D, Ng SC, Rosenberg S, Wang X: Distinctive roles of PHAP proteins
and prothymosin-alpha in a death regulatory pathway.
Science 2003,
299:223-226.
29. Kato M, Yano K, Morotomi-Yano K, Saito H, Miki Y: Identification and
characterization of the human protein kinase-like gene NTKL: mitosis-
specific centrosomal localization of an alternatively spliced isoform.
Genomics 2002, 79:760-767.
30. Negri S, Oberson A, Steinmann M, Sauser C, Nicod P, Waeber G,
Schorderet DF, Bonny C: cDNA cloning and mapping of a novel islet-
brain/JNK-interacting protein. Genomics 2000, 64:324-330.
31. Hirokawa N: Kinesin and dynein superfamily proteins and the
mechanism of organelle transport. Science 1998, 279:519-526.
32. Fan ZS, Beresford PJ, Oh DY, Zhang D, Lieberman J: Tumor suppressor
NM23-H1 is a granzyme A-activated DNase during CTL-mediated
apoptosis, and the nucleosome assembly protein SET is its inhibitor. Cell
2003, 112:659-672.
33. Keim D, Hailat N, Melhem R, Zhu XX, Lascu I, Veron M, Strahler J,
Hanash SM: Proliferation-Related Expression of P19/Nm23 Nucleoside
Diphosphate Kinase. J Clinic Invest 1992, 89:919-924.
Mortensen et al. Comparative Hepatology 2010, 9:2
/>Page 10 of 11
34. Rape M, Kirschner MW: Autonomous regulation of the anaphase-
promoting complex couples mitosis to S-phase entry. Nature 2004,
432:588-595.
35. Osaka F, Kawasaki H, Aida N, Saeki M, Chiba T, Kawashima S, Tanaka K,
Kato S: A new NEDD8-ligating system for cullin-4A. Genes Dev 1998,
12:2263-2268.
36. Butt AJ, Dickson KA, McDougall F, Baxter RC: Insulin-like growth factor-
binding protein-5 inhibits the growth of human breast cancer cells in
vitro and in vivo. J Biol Chem 2003, 278:29676-29685.
37. Meyerson M, Harlow E: Identification of G(1) Kinase-Activity for Cdk6, A
Novel Cyclin-D Partner. Mol Cell Biol 1994, 14:2077-2086.
38. Efimova T, Broome AM, Eckert RL: Protein kinase C delta regulates
keratinocyte death and survival by regulating activity and subcellular
localization of a p38 delta-extracellular signal-regulated kinase 1/2
complex. Mol Cell Biol 2004, 24:8167-8183.
39. Yoshida Y, Matsuda S, Ikematsu N, Kawamura-Tsuzuku J, Inazawa J,
Umemori H, Yamamoto T: ANA, a novel member of Tob/BTG1 family, is
expressed in the ventricular zone of the developing central nervous
system. Oncogene 1998, 16:2687-2693.
40. Kataoka T, Holler N, Micheau O, Martinon F, Tinel A, Hofmann K, Tschopp J:
Bcl-rambo, a novel Bcl-2 homologue that induces apoptosis via its
unique C-terminal extension. J Biol Chem 2001, 276:19548-19554.
41. Coulombe P, Rodier G, Pelletier S, Pellerin J, Meloche S: Rapid turnover of
extracellular signal-regulated kinase 3 by the ubiquitin-proteasome
pathway defines a novel paradigm of mitogen-activated protein kinase
regulation during cellular differentiation. Mol Cell Biol 2003, 23:4542-4558.
42. Julien C, Coulombe P, Meloche S: Nuclear export of ERK3 by a CRM1-
dependent mechanism regulates its inhibitory action on cell cycle
progression. J Biol Chem 2003, 278:42615-42624.
43. Chen JD, Wu XW, Lin JY, Levine AJ: mdm-2 inhibits the G(1) arrest and
apoptosis functions of the p53 tumor suppressor protein. Mol Cell Biol
1996, 16:2445-2452.
44. Michalopoulos GK, DeFrances MC: Liver regeneration. Science 1997, 276:60-
66.
45. Nardo B, Tsivian M, Neri F, Piras G, Pariali M, Bertelli R, Cavallari G:
Extracorporeal portal vein oxygenation improves outcome of acute liver
failure in swine. Transplant Proc 2008, 40:2046-2048.
46. Shimizu Y, Miyazaki M, Shimizu H, Ito H, Nakagawa K, Ambiru S,
Yoshidome H, Nakajima N: Beneficial effects of arterialization of the
portal vein on extended hepatectomy. Br J Surg 2000, 87:784-789.
47. Michalopoulos GK: Liver regeneration. J Cell Physiol 2007, 213:286-300.
48. Ladurner R, Schenk M, Traub F, Koenigsrainer A, Glatzle J:
Cellular liver
regeneration after extended hepatic resection in pigs. Gastroenterology
2008, 134:A875.
doi:10.1186/1476-5926-9-2
Cite this article as: Mortensen et al.: Increased sinusoidal flow is not the
primary stimulus to liver regeneration. Comparative Hepatology 2010 9:2.
Publish with BioMed Central and every
scientist can read your work free of charge
"BioMed Central will be the most significant development for
disseminating the results of biomedical research in our lifetime."
Sir Paul Nurse, Cancer Research UK
Your research papers will be:
available free of charge to the entire biomedical community
peer reviewed and published immediately upon acceptance
cited in PubMed and archived on PubMed Central
yours — you keep the copyright
Submit your manuscript here:
/>BioMedcentral
Mortensen et al. Comparative Hepatology 2010, 9:2
/>Page 11 of 11