Báo cáo y học: "Programme costs in the economic evaluation of health interventions" docx
Bạn đang xem bản rút gọn của tài liệu. Xem và tải ngay bản đầy đủ của tài liệu tại đây (268.67 KB, 10 trang )
BioMed Central
Page 1 of 10
(page number not for citation purposes)
Cost Effectiveness and Resource
Allocation
Open Access
Methodology
Programme costs in the economic evaluation of health
interventions
Benjamin Johns*, Rob Baltussen and Raymond Hutubessy
Address: Global Programme on Evidence for Health Policy (GPE/EQC), World Health Organization, CH-1211 Geneva 27, Switzerland
Email: Benjamin Johns* - ; Rob Baltussen - ; Raymond Hutubessy -
* Corresponding author
Abstract
Estimating the costs of health interventions is important to policy-makers for a number of reasons
including the fact that the results can be used as a component in the assessment and improvement
of their health system performance. Costs can, for example, be used to assess if scarce resources
are being used efficiently or whether there is scope to reallocate them in a way that would lead to
improvements in population health. As part of its WHO-CHOICE project, WHO has been
developing a database on the overall costs of health interventions in different parts of the world as
an input to discussions about priority setting.
Programme costs, defined as costs incurred at the administrative levels outside the point of delivery
of health care to beneficiaries, may comprise an important component of total costs. Cost-
effectiveness analysis has sometimes omitted them if the main focus has been on personal curative
interventions or on the costs of making small changes within the existing administrative set-up.
However, this is not appropriate for non-personal interventions where programme costs are likely
to comprise a substantial proportion of total costs, or for sectoral analysis where questions of how
best to reallocate all existing health resources, including administrative resources, are being
considered.
This paper presents a first effort to systematically estimate programme costs for many health
interventions in different regions of the world. The approach includes the quantification of resource
inputs, choice of resource prices, and accounts for different levels of population coverage. By using
an ingredients approach, and making tools available on the World Wide Web, analysts can adapt
the programme costs reported here to their local settings. We report results for a selected
number of health interventions and show that programme costs vary considerably across
interventions and across regions, and that they can contribute substantially to the overall costs of
interventions.
Introduction
Estimating the costs of health interventions is important
to policy-makers for a number of reasons including the
fact that the results can be used as a component in the as-
sessment and improvement of the performance of their
health systems. As part of its WHO-CHOICE cost-effec-
tiveness work programme (go to />dence/cea for more details), WHO has undertaken an
effort to assess the overall costs and effects of a wide vari-
ety of health interventions [1]. Single global estimates of
intervention costs are not relevant to individual countries.
On the other hand, very few countries are able to estimate
Published: 26 February 2003
Cost Effectiveness and Resource Allocation 2003, 1:1
Received: 24 February 2003
Accepted: 26 February 2003
This article is available from: />© 2003 Johns et al; licensee BioMed Central Ltd. This is an Open Access article: verbatim copying and redistribution of this article are permitted in all
media for any purpose, provided this notice is preserved along with the article's original URL.
Cost Effectiveness and Resource Allocation 2003, 1 />Page 2 of 10
(page number not for citation purposes)
the costs of all possible interventions in their settings.
WHO-CHOICE is, therefore, assessing the costs and ef-
fects of a range of interventions for 14 epidemiologic sub
regions of the world. The provision of sub-regional esti-
mates allows interventions to be classified into broad cat-
egories for decision-making that have broad validity
across that set of countries – e.g. those that are very cost-
effective, those that are cost-effective, and those that are
cost-ineffective. Policy-makers can then ask if there are
good reasons why very cost-effective interventions are not
done in their setting, while at the same time cost-ineffec-
tive interventions are being done [2]. The results will be
presented in a way that analysts from countries in each re-
gion will be able to judge the appropriateness of the find-
ings for their country and adapt them to their own
settings. In the future, WHO-CHOICE will provide techni-
cal assistance to selected countries interested in applying
the tools of generalized cost-effectiveness analyses
Costs can be divided into 'patient costs' and non-patient
or 'programme costs'. Patient costs refer to all costs at the
point of delivery such as outpatient visits, bed days, drugs,
or laboratory tests. Programme costs include costs in-
curred at the administrative levels of the district, provin-
cial or central-levels, i.e. the costs incurred at a level other
than the delivery point of an intervention to beneficiaries.
The components include such items as administration,
training or media campaigns[3]. It is not uncommon for
analysts to ignore programme costs when performing
CEA. For example, only one [4] out of nine studies exam-
ining the cost-effectiveness of tuberculosis treatment strat-
egies clearly showed that programme costs had been
incorporated [5]. That study estimated the average cost of
different ways of directly observing tuberculosis treatment
as a means of improving adherence. For the option of
completely ambulatory short course chemotherapy with
daily supervision, programme costs accounted for 33%,
16% and 34% of estimated total costs in Mozambique,
Malawi and Tanzania in turn. These findings suggest that
programme costs can be a substantial proportion of total
costs, and that the proportion may well vary across set-
tings. They also mean that using a simple rule of thumb in
which programme costs are assumed to be a fixed percent-
age of patient costs may not always be appropriate – al-
though probably preferable than ignoring this category of
cost completely [6,7].
While most CEA guidelines recommend including all rel-
evant costs that vary between programmes, studies may ig-
nore them because they use an "incremental" approach to
costing – comparing the introduction of a new technology
against an existing intervention [8,9]. These studies are
concerned with marginal changes in costs and effects; they
assume that overhead items such as programme costs will
remain approximately the same for each alternative being
compared, and will not affect the choice between the giv-
en alternatives [8]. However, this is simply not appropri-
ate when considering non-personal health interventions,
such as mass media campaigns to encourage people to ex-
ercise more, where virtually the entire intervention con-
sists of programme costs. Nor is it appropriate in many
personal health interventions, such as the tuberculosis
case described above, or when analysts are interested in
answering the question of how best to use existing health
resources to improve population health[10].
This paper presents the systematic method for estimating
programme costs for health interventions across settings
used for WHO-CHOICE. The method and the resulting es-
timates can be used for different purposes, e.g. cost-effec-
tiveness analysis (CEA) and other types of costing
exercises such as estimating the costs of scaling-up inter-
ventions as part of the activities of such bodies as the Glo-
bal Fund to Fight AIDS, Tuberculosis and Malaria. The
following section presents the methods for identifying,
collecting and calculating programme costs, including
consideration of the theoretical basis for calculating pro-
gramme costs. The third section presents an application of
the approach including programme cost estimates for a
number of interventions. Conclusions are presented in
the final section.
Methods
This section describes the methods used in calculating
programme costs as part of WHO-CHOICE. The first part
discusses the theoretical approach for defining relevant
costs. The second and third parts document the methods
used to determine the amount of resource use and their
prices. The last part elucidates a means of accounting for
different coverage levels of an intervention.
Conceptual Approach
Observed prices or charges do not necessarily reflect eco-
nomic value. Generally, the economic definition of costs
should be used in cost valuation, not the accounting (or
financial) definition. This is based on the concept of 'op-
portunity cost', i.e. the value forgone by not utilizing the
same resource in its next best alternative use [11,12]. The
concept implies that all resources consumed by an inter-
vention should be valued, not just those constituting a
budgetary line item.
In collecting costs, several basic issues concerning the
costing process arise. The following issues outline the ap-
proach used to determine costs.
Joint or overhead costs
Programme cost analysis to inform decisions at the secto-
ral level requires information on the costs of introducing
each intervention singly and also in combination with
Cost Effectiveness and Resource Allocation 2003, 1 />Page 3 of 10
(page number not for citation purposes)
other related interventions. This requires identifying all
resources involved to establish and run each intervention,
including the necessary overheads.
The simplest way to identify intervention-specific over-
head costs is to identify shared resources used by the dif-
ferent interventions and use joint costing rules or some
basis of allocation related to the usage of the overhead
item[8]. The percentage of time devoted to each individu-
al intervention was used to allocate personnel costs and
the share of equipment used. Similarly with buildings and
vehicles, the proportion of intervention-specific utiliza-
tion to total utilization was used [8,13]. This implies that
the resources are divisible, or can be shared across inter-
ventions (e.g. it is feasible to use 0.2 vehicles for an indi-
vidual intervention). This is appropriate since most
resources can be shared across interventions and pro-
grammes, and particular types of personnel, transport,
and buildings can be hired in the short term or rented out
to other users. In theory, all costs related to a set of evalu-
ated interventions could be allocated. However, WHO-
CHOICE excludes two major types of 'ongoing' costs in
this context. First, some of the costs of central administra-
tion are not included – those that are part of the overall
planning and management of the health system that are
unrelated to the development and implementation of par-
ticular interventions aimed at improving health. Second,
the current level of education of health professionals is ex-
cluded; if the skills required to deliver an intervention are
available in the country under study, training costs to de-
velop those skills are not included in the programme costs
since a reallocation of health system resources does not af-
fect these costs.
Capacity utilization
The extent to which capital and labor are used can critical-
ly influences unit costs [5,8]. Capacity utilization is de-
fined as the proportion of the total target workload time a
resource is actually used; for example, a computer used 5
hours in a 10 hour work day has a capacity utilisation of
50%. In comparing the cost-effectiveness of interventions,
it is important to ensure that the observed differences are
due to the intrinsic characteristics of the intervention rath-
er than the extent to which capital and labor have been
utilized in the environment in which the interventions
were evaluated. WHO-CHOICE seeks to inform policy-
makers on the optimum mix of interventions if health re-
sources could be reallocated. It is not useful to perform
this analysis by analyzing some interventions that are de-
livered inefficiently and others delivered efficiently.
Therefore, for this analysis we report the cost-effectiveness
estimates of interventions that are done efficiently, using
80% capacity utilization as the norm. This is consistent
with recommendations made in CEA guidelines and en-
sures the comparability of cost-effectiveness ratios across
interventions and settings [8,9].
Ingredients approach
Rather than collecting data on total expenditures, the in-
gredients approach is used. The cost of any input to a pro-
duction process is the product of the quantity used and
the value (or price) of each unit. The ingredients approach
is useful for many reasons, the most important are that it
allows analysts and policy-makers to validate the assump-
tions used; judge whether the estimates presented can be
applied to their settings; and, if necessary, change some of
the parameters to replicate the analysis for their settings
[3,13,14].
Classification of costs
Costs are classified according to three characteristics:
phase of implementation of the intervention, organiza-
tional level where costs are incurred, and nature of costs.
This can be classified in the following three categories,
with primary classifications listed first:
• Start-up and Post Start-up costs: Programmes incur differ-
ent types of costs in the start-up and post-implementation
phases. The definition of the start-up period is the time
between the decision to implement an intervention and
starting its delivery to the first beneficiary. Quantities are
reported for the total time of the start-up period. If the
start-up period is 18 months, the quantities used for the
entire time are reported. Post start-up programme costs
for the full period of implementation of the intervention
were based on an estimate of the annual cost required to
run the intervention in a typical post start-up year when
the programme is fully implemented.
• Central versus Lower Levels costs: Factor inputs are classi-
fied according to where in the administrative and organi-
zational level of the health system they are used. In this
analysis we collected cost data from three programme-cost
levels: central, provincial and district levels, but the data
can be easily adapted to the relevant administrative classi-
fication in different settings.
• Recurrent versus Capital costs: Factor inputs are further
classified into recurrent and capital items. Following
standard practice, capital costs are annualized over the
useful life of the factor input, i.e. the 'equivalent annual
costs' are calculated.
Discounting across time
For country-specific analysis, the local rate of return on
long-term government bonds would ideally be used as the
social discount rate for costs. For our purposes, to allow
comparability across regions, a 3 % discount rate was used
as recommended by most guidelines [8].
Cost Effectiveness and Resource Allocation 2003, 1 />Page 4 of 10
(page number not for citation purposes)
Total start-up costs of the programme were considered as
a capital investment and annualized and discounted over
the life of the programme. For country-specific analysis,
the choice of the period over which start-up costs should
be annualised would be made on a case by case basis, but
to allow comparability for the sub regional analysis, 10
years was chosen as the useful life of a start-up period [3].
The sensitivity of the analysis to this assumption was ex-
plored in the individual intervention studies.
Data on quantities
In the period 2001–2, WHO-CHOICE invited regional ex-
pert teams representing countries from each of the 14 ep-
idemiologic sub regions to gather the quantities of
physical inputs (the ingredients) required for approxi-
mately 75 interventions using a standard tool (see End-
notes section, Note 1 for details of the data collection
tools and procedures). Most of the ingredients were for
specific interventions, but some were for generic cost com-
ponents which could be used in a number of interven-
tions – for example, the cost of training health workers on
case management using different combinations of
number of days, and number of participants.
The data they provided were compiled and compared to
form the basis of a set of costing sheets for the different ac-
tivities covered by programme costs. Next, a list of re-
quired activities and the intensity of each activity was
compiled for each intervention. For example, media out-
reach was classified into four intensities: extensive (daily
or more radio and television emissions), moderate (week-
ly emissions), minimal (monthly emissions or less), and
printed material only (for programmes which have some
information distribution requirements). Further activities
included basic administration, monitoring, evaluation,
and supervision, passage of legislation, training, and law
enforcement. Other activities relevant only to one or a few
programmes were entered separately. Training was divid-
ed into the costs involved in setting-up and running a spe-
cific training session, and the costs of overseeing and
administering a training programme. The former costs are
considered to vary with the number of trainees and length
of training, while the latter were considered a fixed cost
needed to run any training programme, no matter how
many trainees or the length of training. The use of this
standardized format ensures that different programmes
are valued consistently based on the activities needed.
This, in turn, ensures comparability of results.
Quantities were divided into fixed and variable costs.
Fixed costs include those necessary to set up and run a
programme no matter how many people are covered.
Some examples of fixed cost include parts of the central
administration, passage of legislation, and basic monitor-
ing activities. Some examples of items that vary by the
number of people covered include people delivering a
service, the amount of storage space and shipment need-
ed, supervision, and the production of printed informa-
tion materials.
The required quantities of inputs were based on the esti-
mates by the regional expert teams. However, because
there was missing data for some interventions in some re-
gions, the quantities for the variable and fixed cost func-
tions were standardized across regions for most
interventions (this was done except in cases where differ-
ence between regions is clearly justifiable, such as random
breath testing of motor vehicle drivers where significantly
different traffic patterns across regions would result in
very different needs for enforcement). Because of different
sizes of countries within the various regions, variable costs
obviously varied by region (this builds in economies of
scale, where fixed costs are spread over populations of dif-
ferent sizes).
The regional expert teams also estimated details such as
the office supplies, equipment, and office space different
staff members would consume in a year. Based on these
assumptions, the quantities of utilities used and mainte-
nance costs were also estimated (further details can be
found at />). Within the
broad categories outlined in the conceptual approach sec-
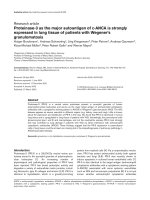
tion, inputs were classified in the manner reported in Ta-
ble 1.
Data on prices
This analysis requires the unit prices used to reflect the
economic cost of goods, and allow for inter-country com-
parison of costs of interventions. For this purpose, the
world price level was chosen as the numeraire or price level
[11], and a reference currency, i.e., the International Dol-
lar (I$), was chosen for the presentation of the results at
the international level. Costs in local country currency
units were converted to international dollars using pur-
chasing power parity (PPP) exchange rates. A PPP ex-
change rate is the number of units of a country's currency
required to buy the same amounts of goods and services
in the domestic market of a reference country, in this case
the United States. An international dollar is, therefore, a
hypothetical currency that is used as a means of translat-
ing and comparing costs from one country to the other.
Because published estimates of PPPs do not cover all 192
countries that are members of WHO, the PPP exchange
rates used in this analysis were developed by WHO and
are available on the WHO-CHOICE website.
Prices for traded goods
Traded goods are commodities that are available on the
international market, and all countries can purchase them
at an international market price. Since the international
Cost Effectiveness and Resource Allocation 2003, 1 />Page 5 of 10
(page number not for citation purposes)
market price reflects the opportunity cost of using a good
to the country, it is used as the price for traded goods, ad-
justed to include cost, insurance and freight (c.i.f.) for im-
ported goods and free on board (f.o.b.) for exported
goods.
International prices were derived from price indexes com-
piled in WHO publications and catalogues of prices from
firms and non-governmental organizations operating at
an international level that excluded costs of shipment and
taxes. These international values were placed in a com-
mon currency (year 2000 I$) using World Bank Gross Do-
mestic Product (GDP) deflators, or, when GDP deflators
were unavailable, Consumer Price Index deflators [15].
Generally, for small items that can be bought in bulk, the
lowest internationally listed price was selected. This as-
sumes the existence of a basic health infrastructure,
enabling the purchase of items in bulk. For larger items, a
middle level price was selected to represent a "typical"
price. In some cases, the price range for a good was too big
to justify the use of a mid-level price. For example, a given
model of a four-wheel-drive vehicle can range in price
from US$15,000 to US$25,000. Thus, for vehicle prices,
generators, and other large cost items, the regional expert
teams were asked to provide the local price of goods ex-
cluding taxes and subsidies.
The f.o.b. (free-on-board) price of exports includes the
production cost, transport costs, local marketing costs and
local port charges of the exporting country [16]. The c.i.f.
(cost-insurance-freight) price excludes import duties and
subsidies (transfer payments), and includes the selling
price of the producing country, freight, insurance, and un-
Table 1: Cost categories in programme cost sheet
A. Recurrent cost
A.1 Personnel Personnel time allocated to each intervention is netted out from time spent by those personnel in
other interventions. Personnel time used in the start-up and post start-up periods is expressed in
person-months.
A.2. Materials & Supplies Materials and supplies in terms of the quantities used for the programme. Examples are office sup-
plies that are used by the programme.
A.3. Media operating costs Media inputs such as radio or television time, leaflets or posters are provided in terms of their unit
of measurement (e.g. minutes for radio, or quarter page ads in newspapers).
A.4. Transport operating costs Transport is measured in terms of total kilometers traveled per mean of transport.
A.5. Equipment operating cost In cases when equipment is rented, the number of equipment and the duration of rental (in
months) are reported.
A.6. Maintenance Maintenance costs are listed as a percentage of annual costs.
A.7. Utilities The amounts of utility items allocated to the programme are listed here. Examples of utility items
are electricity, gas, and water. The allocation of the quantities used by the programme is based on
the square meter surface area used by the programme, after applying any further allocation
needed if the space is shared with other programmes.
A.8. Others
A.8.1. Rented buildings In case buildings are rented, both the total square meter surface area of the buildings and the dura-
tion of rental (in months) are used.
A.8.2. Per diems and travel allowances The types of personnel who are entitled for per diems and travel are listed. The types reflect the
activity they are involved in, e.g. trainers, trainees, support staff in meetings, participants of meet-
ings, supervisors visiting health facilities etc. Reported by the number of days per type of
personnel.
A.8.3. Miscellaneous items Any other category of recurrent resources used that is not provided in the list are reported here
by identifying the item and the quantities used.
B. Capital Costs
B.1. Building Space used by the programme are reported in terms of the total square meter surface area allo-
cated to that programme, i.e., if the space used by the programme is shared with other activities,
the share of the space used for the programme under study are estimated and the value are
entered here.
B.2. Transport The number of means of transport used by the programme is listed here. If they are only partly
used, the estimated share of their use are entered.
B.3. Equipment and implements The number of office equipment, storage and distribution, maintenance, cleaning and other capital
equipment are reported here. If they are only partly used, appropriate allocation is made, using the
same allocation factors used for building space.
B.4. Furniture See point B.3 above.
B.5. Other capital costs This section is used to report any other capital resources used by the programme.
Cost Effectiveness and Resource Allocation 2003, 1 />Page 6 of 10
(page number not for citation purposes)
loading charges. If a country imports the good, the costs
of local transport and distribution (termed 'domestic mar-
gin') were added to the c.i.f. price in order to approximate
the local opportunity cost [16]. Methods for calculating
c.i.f./f.o.b. adjustments are discussed in the section on
coverage levels.
Prices for non-traded goods
Prices of non-traded goods like labour vary across regions.
The regional expert teams provided local prices for non-
traded goods for reference countries in their regions.
Where possible, supplementary information from other
sources on country-specific prices of non-traded goods,
such as the International Labour Organization (ILO) da-
tabase on occupational salaries, was also used to deter-
mine a typical cost for the region as a whole.
Coverage Levels
As coverage expands into remote areas, the marginal costs
of providing an intervention to each additional person
will generally increase [17–19]. To account for the increas-
ing marginal costs of transportation to more remote areas,
the following methods were used to adjust costs for differ-
ent levels of population coverage. Transportation costs
consist of the cost of transporting goods to a country
(c.i.f./f.o.b.) and transporting goods within a country (the
domestic margin).
Adjusting prices for traded goods
The calculation of the cost of transportation was based on
the only available study showing the percentage change in
the price of a traded good based on the distance it travels
between countries, the transportation infrastructure and
the average GDP per capita of a country, and other varia-
bles relating to the availability of seaports, neighbouring
trade partners, etc. [20]. For purposes of calculating the
c.i.f./f.o.b. mark-up of goods, an infrastructure index was
calculated and applied using the price elasticity coeffi-
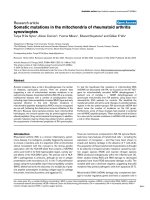
cients reported in Limão and Venables [21]. Table 2 illus-
trates the results of this analysis for selected countries in
different regions with the c.i.f./f.o.b. mark-up ranging
from 1.16 (16% increase in price) in Denmark to 1.71 in
Afghanistan, with a median mark-up of 1.28.
The domestic margin was calculated based on a hexagon
shaped regional distribution model [22]. Each hexagon
was assumed to cover 80 square kilometres, approximat-
ing the area served by one health centre reflecting a circu-
lar area with a radius of 5 km [23]. The population of each
hexagon was derived from Geographical Information Sys-
tem (GIS) data on the population density of a country. In
this model, the population density of the most crowded
80 square kilometres is assumed to be at the centre of the
country, with hexagons further from the centre having
progressively lower population densities. Thus, in the case
of Burkina Faso, 4% of the population is assumed to live
in the central hexagon, while only 2% of the population
is assumed to live in the adjacent hexagon.
Each country is also divided into provinces and districts
based on the number of provinces and districts reported
by WHO databases. In cases where the number of second-
ary or tertiary administrative units was not certain, an av-
erage was taken from the available sources. The average
size of a province or district was calculated by dividing the
total area of a country by the number of provinces or dis-
Table 2: Mark-up of goods to account for the cost of transport
Country CIF/FOB Ratio Domestic Margin
50% Coverage 80% Coverage 95% Coverage 100% Coverage
Afghanistan 1.71 1.73 1.73 1.74 1.74
Brunei Darussalam 1.24 1.25 1.25 1.25 1.26
Burkina Faso 1.49 1.50 1.50 1.51 1.51
China 1.30 1.30 1.31 1.31 1.31
Denmark 1.16 1.16 1.16 1.17 1.17
India 1.24 1.24 1.24 1.24 1.25
Jordan 1.31 1.31 1.32 1.32 1.33
Mexico 1.27 1.27 1.27 1.27 1.27
Nicaragua 1.41 1.41 1.42 1.42 1.43
Russian Federation 1.26 1.27 1.27 1.28 1.29
Thailand 1.29 1.29 1.30 1.31 1.31
The former Yugoslav Republic of
Macedonia
1.22 1.22 1.22 1.22 1.22
United Republic of Tanzania 1.42 1.43 1.43 1.44 1.44
United States of America 1.18 1.19 1.19 1.20 1.21
Cost Effectiveness and Resource Allocation 2003, 1 />Page 7 of 10
(page number not for citation purposes)
tricts, which were then incorporated into the hexagonal
grid. A traded good was assumed to travel, on average, half
the distance from the central hexagon to the centre of the
most peripheral province, and then to the centre of a dis-
trict. The Limão and Venables price elasticity for distance
was then used with this calculated distance to derive the
domestic margin. Since, in this model, the central areas
are more crowded than outlying areas, a programme cov-
ering 50% of the population will have a proportionately
lower mark-up than a programme covering 95% of the
population. However, as shown in Table 2, the domestic
margin is a minor cost compared to the cost of initially
transporting a good to the country.
Impact on resource utilization
When an intervention covers a larger part of the popula-
tion, the resources required to run the intervention also
increase. As coverage goes up, certain cost parameter val-
ues were increased as follows:
• As indicated above, the hexagon shaped regional distri-
bution model assumes a health centre for every 80 square
kilometres of space. This implies that health centres may
not always run at 80% capacity, since more remote areas
may have a very low population density. Since costs of
training of health care professionals are independent of
population density, these costs – expressed as costs per
capita – will increase as coverage levels increase
• The number of provinces covered increases as coverage
expands. Under the assumptions listed above, one or two
provinces may contain 50% or more of the population.
Thus, as coverage expands, the number of provinces cov-
ered will increase, but each new province covered will
have fewer people. Since there are fixed costs associated
with running a programme at the province level, this pro-
duces diseconomies of scale.
• The distance travelled in a supervision visit increases. At
the national level, this is calculated as the distance from
the centre to the most remote province covered (the aver-
age distance would be half the distance from the center to
the periphery; however, because supervision visits are as-
sumed to be round trips, the full distance from the center
to the periphery is used). The distance travelled for super-
vision visits within provinces is similarly calculated.
• Thus, the number of programme staff involved in super-
vision activities needs to increase both in proportion to
the increased distances covered and to account for the in-
creased number of provinces. Each province was assumed
to need an equal number of supervision visits.
It is possible that salaries may be higher in very remote ar-
eas to give health personnel extra incentive to relocate to
these areas. In the absence of data, this factor was not
incorporated.
Organising and using the data
The predicted quantities of resources needed were multi-
plied by their respective prices to calculate the total pro-
gramme costs for a ten-year period of implementation.
These ten-year costs are calculated in year 2000 interna-
tional dollars using a standard net present value formula
[8].
Validation
Once the data had been collected and analysed, the accu-
racy of the data was verified. Where possible, previous
costing or CE studies which included programme costs
were used as a benchmark for comparison, but very few
presented programme cost estimates using the ingredients
approach (e.g. [24]). In addition, disease and public
health experts or programme managers who are familiar
with the particular interventions and settings for a
number of diseases reviewed the final costing figures. In
the cases where the estimates did not have face validity,
controls were made to ensure that there had not been mis-
takes with coding, and discussions were held with the re-
gional costing experts to confirm the basis of their
quantity and price estimates.
Results
WHO-CHOICE has used the methods described above to
produce a set of cost-effectiveness estimates, initially for
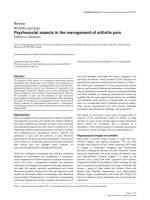
14 epidemiologic sub regions [25]. Table 3 reports the av-
erage annual programme cost per capita, and as a percent-
age of total intervention cost per capita, for selected
interventions in these regions. Costs are presented in 2000
International dollars. The table shows that programme
costs vary across interventions and across regions for a giv-
en intervention. For example, cost per capita of educating
sex workers totals I$ 0.01 in SearB, whereas it amounts to
$0.07 in AfrE. For a population of 100 million people,
this would mean programme costs differ substantially –
$1 million in the former and $7 million in the latter sub
region. Variations are caused by differences in the number
of sex workers and in the number of social workers re-
quired to train sex worker peer educators, and to differenc-
es in regional price levels of inputs. (Note also that a
straight comparison of cost per capita across interventions
is misleading in deciding whether an intervention is of
low cost or more expensive at a population level, because
there is wide variation in the target populations for each
of these interventions.)
The importance of programme cost in comparison with
patient cost also varies by intervention and by region. Ob-
viously, non-personal interventions such as the introduc-
tion of random breath testing for drivers to reduce the
Cost Effectiveness and Resource Allocation 2003, 1 />Page 8 of 10
(page number not for citation purposes)
burden of motor vehicle accidents consists entirely of pro-
gramme costs. On the other hand, the provision of brief
physician advice to heavy alcohol users consists largely of
patient costs, with programme costs ranging from less
than 1% of total costs to almost 30%.
The tools used to estimate these results are available on
the Internet at /> for use
by local analysts. They include:
• a database of prices for traded goods,
• a database listing the reported useful life of capital
goods,
• a workbook listing activities used in programme costs
together with assumptions of quantities of resources used
based on the data collected by WHO, and
• a costing tool CostIt
©
to calculate and present the final
results of the costing exercise.
• a tool for uncertainty analysis MCLeague
©
to calculate
uncertainty regions around cost-effectiveness ratios and
present stochastic league tables.
All of the estimates presented could be modified by ana-
lysts to suit the particularities of their own setting. In
adapting these tools, analysts have to assess if the
assumptions outlined in this paper are appropriate for
their own setting. The following list highlights some ma-
jor considerations:
• Local analysts may wish to carry out the analysis using a
capacity utilization rate other than 80% to better reflect
their actual situation. However, one standard rate should
be used for the evaluation of all interventions to ensure
comparability. The CostIt
©
tool allows this to be done
automatically.
• Local analyst may wish to use local prices rather than in-
ternational prices as estimated by WHO-CHOICE. Analyst
can also vary prices for non-traded goods according to the
location within the country where they are incurred; for
example, provincial staff may have lower salaries than
staff in the capital city, or vice-versa.
• The spatial model for scaling-up can be revised to the ge-
ography of a particular country. For example, multiple
points of entry for traded goods can be considered. Alter-
natively, local analysts may be able to gather data on the
prices of goods in various parts of the country, or the costs
of transportation, and thus not need to employ the model
Table 3: Average annual program cost per capita for selected interventions in GBD regions* (2000 I $)
Disease /
intervention
HIV/AIDS: Preventing
Mother To Child
Transmission
HIV/AIDS: Educating sex workers Alcohol: Random
breath testing of
drivers**
Alcohol: Brief physician
advice to reduce heavy
alcohol use
†
Coverage
level
Antenatal care
coverage
††
50% 80% 95% 95% 50%
GBD2000
region‡
PC‡‡ PC as % of
Total
Costs
PC PC as % of
Total
Costs
PC PC as % of
Total
Costs
PC PC as % of
Total
Costs
PC PC as % of
Total
Costs
PC PC as % of
Total
Costs
AfrD $0.08 8% $0.05 70% $0.06 63% $0.06 61% $0.31 100% $ 0.011 21%
AfrE $0.15 10% $0.07 74% $0.09 69% $0.10 67% $0.42 100% $ 0.012 8%
AmrA $0.19 5% $0.06 92% $0.09 91% $0.10 91% $0.29 100% $ 0.006 0%
AmrB $0.05 5% $0.02 84% $0.03 78% $0.03 76% $0.28 100% $ 0.007 2%
AmrD $0.03 4% $0.02 62% $0.02 55% $0.03 52% $0.45 100% $ 0.005 8%
EmrB $0.11 9% $0.08 96% $0.09 96% $0.09 96% NA N.A. N.A. N.A.
EmrD $0.08 15% $0.06 94% $0.06 94% $0.06 94% NA N.A. N.A. N.A.
EurA $0.17 9% $0.09 97% $0.10 96% $0.11 96% $0.55 100% $ 0.025 1%
EurB $0.14 18% $0.05 91% $0.05 91% $0.05 91% $0.51 100% $ 0.008 2%
EurC $0.03 9% $0.03 83% $0.03 83% $0.03 83% $0.25 100% $ 0.003 0%
SearB $0.07 9% $0.01 36% $0.02 35% $0.02 34% $0.19 100% $ 0.001 2%
SearD $0.02 4% $0.03 69% $0.03 65% $0.04 64% $0.17 100% $ 0.004 29%
WprA $0.19 9% $0.10 97% $0.11 97% $0.12 96% $0.95 100% $ 0.022 4%
WprB $0.09 15% $0.10 89% $0.11 89% $0.11 89% $0.23 100% $ 0.006 5%
* Costs are average annual discounted programme costs of implementing an intervention during 10 years ** Only relevant at 95% coverage † Only
relevant at 50% coverage ††Current antenatal care coverage in GBD regions; defined as percentage of target population with at least one antenatal
care visit during pregnancy ‡ AFR = Africa Region; AMR = Region of the Americas; EMR = Eastern Mediterranean Region; EUR = European Region;
SEAR = South East Asian Region; WPR = Western Pacific Region. A sub regions have very low rates of adult and child mortality; B = low adult, low
child; C = high adult, low child; D = high adult, high child; E = very high adult, high child mortality.
Cost Effectiveness and Resource Allocation 2003, 1 />Page 9 of 10
(page number not for citation purposes)
as used by WHO-CHOICE. Further, the assumption that
the number of provinces expands with increasing popula-
tion coverage may not accurately reflect how a country im-
plements health interventions, and analysts should adjust
their assumptions accordingly. Finally, the coverage area
of health centres can be determined locally.
Conclusion
Programme costs can constitute a substantial component
of costs even for personal health interventions and should
not be ignored in the economic evaluation of health inter-
ventions. This paper has presented a first effort to system-
atically analyze programme costs in different sub regions
of the world. The use of a standardized methodology en-
sures comparability of cost estimates across interventions
and settings.
In addition, this paper has introduced "ready-to-use"
tools and programme cost estimates that are available on
the World Wide Web. The programme cost estimates con-
stitute an important part of WHO-CHOICE database on
costs and effects of multiple interventions in various re-
gions in the world exploring the question of whether re-
sources are being used to achieve the maximum possible
level of population health. Analysts may wish to adapt the
regional estimates to their local setting to make the results
more relevant for local decision makers. This paper has
shown that, in this process, special attention should be
paid to issues such as capacity utilization, prices of goods,
and increasing marginal costs of delivering interventions
into more remote areas.
As with any innovative work, there are some limitations to
the approach that has been used, which offers possibilities
of further development over time. For example, in the
consultation process with regional expert teams to obtain
input quantities and prices, considerable efforts were
made to standardize reporting approaches. Nevertheless,
reported quantities still showed considerable variation
beyond that reasonably expected on the basis of regional
differences, and it was necessary to return to the experts
for clarification and to seek the input of external data
sources and expert advice. Analysts wishing to adapt the
results to their own settings should be aware that they
would need to seek the advice of more than one expert in
their own countries before adapting the quantities of in-
puts and unit prices reported here. WHO-CHOICE incor-
porates extensive efforts to develop methods for
uncertainty analysis, to reflect uncertainty in the final cost
and cost-effectiveness estimates. This is designed to help
local policy makers decide the extent to which the results
of the WHO-CHOICE analysis inform policy in their
countries [26,27].
A key element in our approach is the specification of in-
tervention cost functions at various coverage levels.
Whereas other studies have estimated costs of scaling-up
health services using a linear cost function, the present
study includes non-linearities [28]. Economies of scale
have been incorporated by allowing some costs to be fixed
regardless of the size of the population reached – televi-
sion broadcasts are a case in point. On the other hand, di-
seconomies of scale have been included by using higher
prices (for transport costs) and higher quantities (for
training and supervision) at higher coverage levels. This is
an important step for showing the impact of higher cover-
age on costs and outcomes. However, further work is re-
quired to add non-spatial determinants of increasing costs
relating to scaling-up.
Conflict of Interest
None.
Authors' contributions
BJ has day-to-day responsibility for the data management
of programme costs, participated in the development of
the methodology and drafted the manuscript. RB and RH
participated in the development and coordination of the
methodology. All authors read and approved the final
manuscript.
Endnote section
Note 1
WHO-CHOICE instructed the costing experts on data
gathering techniques. Each was given a standardised col-
lecting tool and a guideline, and most attended a work-
shop detailing the methods to be used. The standardized
data collection tool involved two Microsoft Excel spread-
sheets. The first, the "general information" sheet, docu-
ments general health system parameters of a country. This
sheet contains five tables, some for use in determining pa-
tient costs, some for use in determining programme costs.
The second spreadsheet provided a template for recording
the quantities of resource inputs for each intervention (see
Table 1). A WHO-CHOICE team member made a follow-
up visit to each country to determine the adequacy of the
experts' techniques, answer questions, and provide further
guidance. Responses were checked against those of other
experts, as well as the literature, allowing outliers to be
identified and the sources of any difference to be explored
and corrected if necessary.
Acknowledgements
The authors would like to thank Yunpeng Huang, Nataly Sabharwal, and
Steeve Ebener for their work in compiling and processing the data neces-
sary for this exercise; to Osmat Azzam, Richard Catto, Gatien Ekanmian,
Ruth Lucio, Benjamin Nganda, Subhash Pokhrel, Elena Potaptchik, Enrique
Villarreal Ríos, Mahmoud A.L. Salem, André Soton, and Lu Ye as represent-
atives of their regional expert teams for their efforts to gather data at the
country level; and to Taghreed Adam, Dan Chisholm, and Moses Aikins for
Publish with Bio Med Central and every
scientist can read your work free of charge
"BioMed Central will be the most significant development for
disseminating the results of biomedical research in our lifetime."
Sir Paul Nurse, Cancer Research UK
Your research papers will be:
available free of charge to the entire biomedical community
peer reviewed and published immediately upon acceptance
cited in PubMed and archived on PubMed Central
yours — you keep the copyright
Submit your manuscript here:
/>BioMedcentral
Cost Effectiveness and Resource Allocation 2003, 1 />Page 10 of 10
(page number not for citation purposes)
their input in the development of the methods used. We are grateful to
Chris Murray, David Evans, and Tessa Tan Torres for general guidance
throughout this project.
The open peer review comments of Dr Guy Hutton (Switzerland) and Dr
Frederick Mugisha (Kenya) on an earlier version of this paper are also grate-
fully acknowledged.
The views expressed are those of the authors and not necessarily those of
the organization they represent.
References
1. Hutubessy RCW, Baltussen RMPM, Tan Torres-Edejer T and Evans
DB Generalised cost-effectiveness analysis: an aid to decision
making in health. Applied Health Economics and Health Policy 2002,
1:89-95
2. Murray CJ and Lopez AD Global mortality, disability, and the
contribution of risk factors: Global Burden of Disease Study.
Lancet 1997, 349:1436-1442
3. Baltussen RM, Adam T, Tan Torres T, Hutubessy RC, Acharya A and
Evans DB Generalized Cost-Effectiveness Analysis: A Guide.
Geneva, World Health Organization, Global Programme on Evidence for
Health Policy 2002,
4. de Jonghe E, Murray CJ, Chum HJ, Nyangulu DS, Salomao A and Sty-
blo K Cost-effectiveness of chemotherapy for sputum smear-
positive pulmonary tuberculosis in Malawi, Mozambique and
Tanzania. Int J Health Plann Manage 1994, 9:151-181
5. Adam T, Evans DB and Koopmanschap MA Cost-effectiveness
analysis: can we reduce variability in costing methods? Int J
Technol Assess Health Care
6. Floyd K, Wilkinson D and Gilks C Comparison of cost effective-
ness of directly observed treatment (DOT) and convention-
ally delivered treatment for tuberculosis: experience from
rural South Africa. BMJ 1997, 315:1407-1411
7. Creese A and Parker D Cost Analysis in Primary Health Care:
A Training Manual for Programme Managers. Geneva, World
Health Organization 1994,
8. Drummond MF, O'Brien BJ, Stoddart GL and Torrance GW Meth-
ods for the Economic Evaluation of Health Care Pro-
grammes 2 ed. Oxford, Oxford Univeristy Press 1997,
9. Gold MR, Siegel JE, Russel LB and Weinstein MC Cost-effective-
ness in Health and Medicine. New York, Oxford University Press
1996,
10. Murray CJ, Evans DB, Acharya A and Baltussen RM Development
of WHO guidelines on generalized cost-effectiveness
analysis. Health Econ 2000, 9:235-251
11. Little IMD and Mirrlees JA Project Appraisal and Planning for
Developing Countries. London, Heinemann Educational Books 1974,
12. Mishan EJ Cost-benefit Analysis. London, George Allen & Unwin (Pub-
lishers) Ltd 1982,
13. Creese A and Parker D Cost Analysis in Primary Health Care:
A Training Manual for Programme Managers. Geneva, World
Health Organization 1994,
14. Walker D How to do (or not to do) Cost and cost-effective-
ness guidelines: which ones to use? Health Policy Plan 2001,
16:113-121
15. World Bank World Development Indicators 2001. Washington,
D.C: World Bank 2001,
16. Gittinger J Economic analysis of agricultural projects. John Hop-
kins Press 1984,
17. Berman P, Brotowasisto , Nadjib M, Sakai S and Gani A The costs of
public primary health care services in rural Indonesia. Bull
World Health Organ 1989, 67:685-694
18. Berman P Cost efficiency in primary health care: studies of
health facilities in Indonesia. Health Policy Plan 1989, 4:316-322
19. Over M The effect of scale on cost projections for a primary
health care program in a developing country. Soc Sci Med 1986,
22:351-360
20. Limao N and Venables AJ Infrastructure, geographical disadvan-
tage, transport costs, and trade. World Bank Economic Review
2001, 15:451-479
21. Roncek DW Learning more from tobit coefficients: extending
a comparative analysis of political protest. American Sociological
Review 1992, 57:503-507
22. Gusein-Zade SM Comments on "A note on the location of
medical facilities" by Z. Drezner. Journal of Regional Sciences 1992,
32:229-231
23. Khan MM, Ali D, Ferdousy Z and Al Mamun A A cost-minimization
approach to planning the geographical distribution of health
facilities. Health Policy Plan 2001, 16:264-272
24. Sweat M, Gregorich S, Sangiwa G, Furlonge C, Balmer D, Kamenga C,
Grinstead O and Coates T Cost-effectiveness of voluntary HIV-
1 counselling and testing in reducing sexual transmission of
HIV-1 in Kenya and Tanzania. Lancet 2000, 356:113-121
25. World Health Organization The World Health Report 2002: Re-
ducing Risks, Promoting Healthy Life. Geneva, World Health
Organization 2002,
26. Baltussen RM, Hutubessy RC, Evans DB and Murray CJ Uncertainty
in cost-effectiveness analysis: Probabilistic uncertainty anal-
ysis and stochastic league tables. Int J Technol Assess Health Care
2002, 18:112-119
27. Hutubessy RC, Baltussen RM, Evans DB, Barendregt JJ and Murray CJ
Stochastic league tables: communicating cost-effectiveness
results to decision-makers. Health Econ 2001, 10:473-477
28. WHO Commission on Macroeconomics and Health Macroeco-
nomics and Health: Investing in Health for Economic Devel-
opment. Report of the Commission on Macroeconomics and
Health. Geneva, World Health Organization 2001,