Báo cáo y học: "Spectral counting assessment of protein dynamic range in cerebrospinal fluid following depletion with plasma-designed immunoaffinity columns" doc
Bạn đang xem bản rút gọn của tài liệu. Xem và tải ngay bản đầy đủ của tài liệu tại đây (1.33 MB, 15 trang )
CLINICAL
PROTEOMICS
Spectral counting assessment of protein dynamic
range in cerebrospinal fluid following depletion
with plasma-designed immunoaffinity columns
Borg et al.
Borg et al. Clinical Proteomics 2011, 8:6
(3 June 2011)
RESEARCH Open Access
Spectral counting assessment of protein dynamic
range in cerebrospinal fluid following depletion
with plasma-designed immunoaffinity columns
Jacques Borg
1*
, Alex Campos
2
, Claudio Diema
3
, Núria Omeñaca
3
, Eliandre de Oliveira
2
, Joan Guinovart
4
and
Marta Vilaseca
3
* Correspondence: Jacques.
1
Laboratoire de Neurobiochimie,
Université Jean Monnet, Saint-
Etienne, France
Full list of author information is
available at the end of the article
Abstract
Background: In cerebrospinal fluid (CSF), which is a rich source of biomarkers for
neurological diseases, identification of biomarkers requires methods that allow
reproducible detection of low abundance proteins. It is therefore crucial to decrease
dynamic range and improve assessment of protein abundance.
Results: We applied LC-MS/MS to compare the performance of two CSF enrichment
techniques that immunodeplete either albumin alone (IgYHSA) or 14 high-
abundance proteins (IgY14). In order to estimate dynamic range of proteins
identified, we measured protein abundance with APEX spectral counting method.
Both immunodepletion methods improved the number of low-abundance proteins
detected (3-fold for IgYHSA, 4-fold for IgY14). The 10 most abundant proteins
following immunodepletion accounted for 41% (IgY14) and 46% (IgYHSA) of CSF
protein content, whereas they accounted for 64% in non-depleted samples, thus
demonstrating significant enrichment of low-abundance proteins. Defined
proteomics experiment metrics showed overall good reproducibility of the two
immunodepletion methods and MS analysis. Moreover, offline peptide fractionation
in IgYHSA sample allowed a 4-fold increase of proteins identified (520 vs. 131
without fractionation), without hindering reproducibility.
Conclusions: The novelty of this study was to show the advantages and drawbacks
of these methods side-to-side. Taking into account the improved detection and
potential loss of non-target proteins following extensive immunodepletion, it is
concluded that both depletion methods combined with spectral counting may be of
interest before further fractionation, when searching for CSF biomarkers. According
to the reliable identification and quantitation obtained with APEX algorithm, it may
be considered as a cheap and quick alternative to study sample proteomic content.
Keywords: CSF, APEX, Biomarkers, depletion column, enrichment, low-abundance
proteins
Borg et al. Clinical Proteomics 2011, 8:6
/>CLINICAL
PROTEOMICS
© 2011 Borg et a l; licensee BioMed C entral Ltd. This is an Open Access article distributed under the terms of the Creative Commons
Attribution License ( /by/2.0), which permits unrestricted use, distribution, and reproduct ion in
any medium, provided the original work is properly cited.
Introduction
Biomarkers are key tools for detecting and monitoring neurodegenerative processes.
Clinical Proteomics is especially well-suited to the discovery and implementation of
biomarkers derived from biofluids. A majo r limiting factor for in-depth proteomics
profiling is the im mense dynamic range of biofluid proteins, which spans 10 to 12
orders of magnitude [1]. In human plasma, the 22 most abundant proteins are respon-
sibl e for ~99% of the bulk mass of the total proteins, thus leaving several hundr eds or
thousands of proteins in the remaining 1%. Many biomarkers of “interest” are antici-
pated to be present at low concentrations and their detection is therefore hindered by
highly abundant proteins. To overcome this problem, enrichment techniques and
orthogonal fractiona tion strategies are routinely applied in proteomics studies prior to
mass spectrometry (MS) analysis. Recent studies have demonstrated a substantial
impact of multid imensional fractionation on the overall number of protein s identified
and on sequence coverage [2-6]. Despite its benefits, extensive fractionation contributes
to experimental variability and limits sample throughput.
Cerebrosp inal fluid (CSF) in particular is directly related to the extracellular space of
the brain and is therefore a valuable reporter of processes t hat occur in CNS. In t he
last few years, a number of proteomics stra tegies have been adopted to achieve in-
depth coverage of the human CSF proteome. SCX-fractionation and LC-MALDI were
used to identi fy 1,583 CSF proteins [2]. GeLC-MS/MS approach allowed identification
of 798 proteins from albumin-depleted CSF [6]. Recently, combinatorial peptide ligand
library was employed to decrease CSF dynamic range and identify 1,212 proteins [7].
In an attempt to generate a comprehensive CSF database, Pan et al. [8] combined and
re-analyzed the results of various CSF proteomics studies and reported 2,594 unique
proteins with high confidence.
A number of commercial depletion systems are available for highly selective removal
of 1, 14, 20, or over 60 of the most abundant proteins present in human plasma.
Although these systems were initially designed to deplete plasma/serum samples, they
have been widely used for other biofluids such as CSF. A number of reports have eval-
uated the efficiency and reproducibility of these systems [9-15]. They have also pointed
out the potential loss of non-target proteins as a result of non-specific binding to
immunodepletion columns [10,12].
Here we evaluated the advantages afforded by immunodepletion and pre-fractionation
of CSF samples. For this purpose, human CSF samples were analyzed after the removal
of albumin or 14 HAP (high abundance protein) and were compared with non-depleted
CSF samples without further offline fractionation. Noteworthy, the commercial deple-
tion system used to remove 14 HAP was designed to stoichiometrically remove the 14
most abundant proteins in normal plasma/serum samples . Depleted samples were then
analyzed by LC-MS/MS and further profiled using a modified spectral counting
appr oach. In addition to proteome depth, we evaluated the performance of CSF enrich-
ment and fractionation strategies in terms of reproducibility and experimental bias.
Results
Protein recovery after immunodepletion
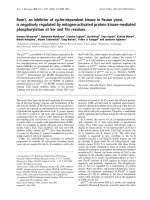
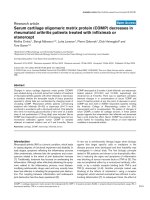
Figure 1 schematically illustrates the sample processing strategies adopted in this study.
The amount of protein recovered in the flow-through (~ 3 or 4 mL for IgYHSA or
Borg et al. Clinical Proteomics 2011, 8:6
/>Page 2 of 14
IgY14 columns, respectively) following sample concentration with Amicon filters wa s
around 13% and 30% of applied protein for the IgY14 and IgYHSA columns, respec-
tively ( Table 1). Furthermore, the amount of protein recovered in the fractions bound
to the IgY14 and IgYHSA columns was 52% and 37%, respectively.
Reproducibility
To evaluate the technical variability of immunodepletion strategies, a single pooled
CSF sample was aliquoted and the assays were run as triplicates. Run-to-run reprodu-
cibility was evaluated using a set of proteomics experiment metrics. The number of
MS1 and MS2 spectra acquired during the retention time perio d over which the mid-
dle 50% of the identified peptides elute, are direct measures of the effective speed of
sampling during the most information-rich section of the run. Notably, the total num-
ber of MS1 and MS2 spectra was consistent across all samples (Table 2). The number
of MS2 spectra was also reproducible between the three replicates of each method.
Taken together, MS1 and MS2 scan counts metrics provide a broad perspective of the
Figure 1 Overview of the work flow used for CSF proteome a nalysis. A pooled CSF sample was
divided into 12 equal aliquots. Each aliquot was subjected to immunoaffinity protein depletion as follows:
14 proteins; albumin only; or were not subjected to depletion (controls). 75 μg of each flow-through (or
non-depleted sample) was trypsin-digested and further analyzed by LC-MS/MS. MS raw data files were
processed with Mascot Distiller and further analyzed with PeptideProphet algorithm. Protein abundance
was calculated with APEX spectral counting method. Right-hand column shows analysis including reversed-
phase LC peptide fractionation.
Table 1 Total protein quantitation upon immunodepletion procedure
Before depletion (μg) Flow-through fraction (μg) Bound fraction (μg)
IgYHSA 780 248 ± 40 301 ± 25
IgY14 780 106 ± 2 425 ± 6
Protein quantification was carried out in triplicate in CSF samples depleted for 14 proteins (IgY14) or albumin (IgYHSA)
with bicinchoninic a cid colorimetric method. Results are shown as mean ± SD.
Borg et al. Clinical Proteomics 2011, 8:6
/>Page 3 of 14
reliability of sample preparation and LC-MS performance for subsequent label-free
quantitative analysis.
To evaluate pattern similarities across runs, we applied a label-free strategy based on
matching features (m/z and retention time) across the three LC-MS replicates for each
method. Briefly, features across replicate were mapped and aligned using SuperHirn
algorithm, which clusters monoisotopic masses of the same charge state and m/z value
(integration tolerance = 0.005 Da) across subsequent scans. Therefore, each feature is
summarized by its m/z, retention time start/apex/end, and total feature area. Only fea-
tures with charges 2+, 3+, 4+ and 5+ were considered in this a nalysis. In order to
match two features between two or more replicates, we considered only features within
10 ppm and 60 s tolerance in m/z and retentio n time, respectively. Immunodepletion
improved the final number of features found in t he triplicate LC-MS analyses by
approximately 20% (Table 3). Non -depl eted samples presented slightly better reprodu-
cibility compared to the immunodepleted samples in terms of percentage of overlap-
ping features among the three replicates (although lower in absolute number).
Approximately 60% of all features detected in the non-depleted triplicates were found
at least in 2 out of 3 replicates, whereas this number decreased to 55% in both immu-
nodep letion techniques (Table 3). These observations demonstrate overall good repro-
ducibility of the two immunodepletion methods.
Dynamic range
Under the premise that spectral counting is correlated with peptide abundance [16,17],
we evaluated the changes in CSF proteome content after depletion of highly abundant
plasma proteins. Recently, the protein abundance calculated by APEX has been
Table 2 Reproducibility of MS1 or MS2 spectral counts following various depletion
methods
MS1 scans MS2 scans
IgY14_1 787 3347
IgY14_2 933 3222
IgY14_3 911 3194
IgYHSA_1 783 2906
IgYHSA_2 778 2870
IgYHSA_3 606 2366
Undepleted_1 903 2372
Undepleted_2 1052 2781
Undepleted_3 1058 2888
Depleted or non-depleted CSF samples were analyzed as triplicates. Number of MS1 and MS2 scans over which the
middle 50% of the identified peptides elute are shown for each CSF aliquot.
Table 3 Pattern similarity following various depletion methods
Method Number of
detected
features
Number of common
features in 3 replicates
Number of common
features in 2 replicates
Number of features
in only 1 replicate
IgY14 5478 1740 (31.8%) 1229 (22.4%) 2509 (45.8%)
IgYHSA 5446 1611 (29.5%) 1387 (25.5%) 2448 (45%)
Undepleted 4344 1465 (33.7%) 1124 (25.9%) 1755 (40.4%)
Table shows features (extracted and aligned with SuperHirn program) common to all 3 replicates in each depletion
methods, those common to 2 replicates (excluding those common to the 3 replicates) and those found in only 1
replicate.
Borg et al. Clinical Proteomics 2011, 8:6
/>Page 4 of 14
demonstrated to b e a close approximation of the relative abundance of a particular
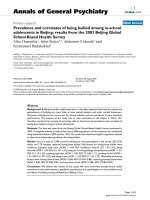
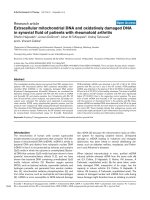
protein [10]. Fig ure 2 shows a comparison of the dynamic range profile of CSF pro-
teome achieved after immunodepletion as measured by APEX algorithm. Our data
demons trate an improvement in the overall number of low abundance proteins (LAP;
below 2 logs of magnitude from the most abundant protein) in samples subjected to
IgYHSA (14 proteins) or IgY14-depletion (18 proteins) compared to non-depleted (5
proteins) samples.
Peptide and protein identification
As expected, the enrichment of LAP following immunodepletion significantly improved
proteome coverage. The number of proteins identif ied increased af ter immunodeple-
tion, particularly with IgY14 column (Table 4). A total of 665 unique peptides were
confident ly (PeptideProphet > 0.95) identified in the three IgYHSA replicates, of which
467 (70%) were found in at least two runs. Regarding IgY14 method, 775 unique pep-
tides were confidently identified, of which 452 (58%) were identified in at least two
replicates. Finally, for the non-depleted samples, a total of 466 peptides were confi-
dently identified, of which 335 (72%) were common to at least two runs. Despite the
improved proteome coverage achieved with the IgY14 depletion, there was a drop in
the percentage of peptides identified in at least two replicates.
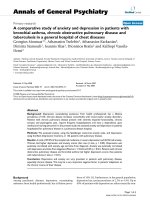
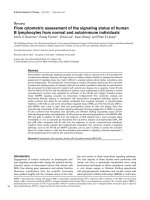
At the protein level, we found 90 proteins common to the three IgY14 replicates
from a total of 156 proteins; 72 proteins were common to all three IgYHSA replicates
from a total of 131 proteins; and 55 proteins w ere common to all three non-depleted
Figure 2 Dynamic range of protein abundance. Abundance of each identified protein was calculated
with APEX algorithm. Abundance is plotted on log scale spanning 4 orders of magnitude. Proteins with an
APEX value below 0.1log are considered LAP. Data shown were obtained from one typical set of data for
each depletion method. A: non-depletion; B: IgY14-depletion; C: IgYHSA-depletion. D: IgYHSA-depletion and
RP-fractionation.
Borg et al. Clinical Proteomics 2011, 8:6
/>Page 5 of 14
replicates from a total of 90 proteins (Figure 3). Overall, approximately 80% of the pro-
teins identified in each method were found in at least 2 replicates.
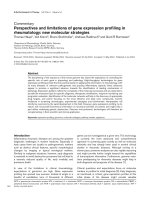
Figure 4 shows the similarities in terms of peptide and protein identification across
the three methods. 231 peptides and 67 proteins were commonly identified in the
three methods, while 432 peptides and 107 proteins were commonly identified in both
depleted samples. The differences between proteins identified in the IgYHSA-dep leted
replicates and undetecte d in the IgY14-depleted replicates are attributed, in p art, to
Table 4 Summary of peptide and protein identification after application of depletion
methods and peptides prefractionation
Number of spectra
identified
Number of unique peptides
identified
1
Number of proteins
identified
2
IgY14_1 893 571 136
IgY14_2 823 473 124
IgY14_3 881 463 120
Total
unique
775 156
IgYHSA_1 837 518 105
IgYHSA_2 804 493 112
IgYHSA_3 652 366 84
Total
unique
665 131
Undepl_1 724 277 67
Undepl_2 795 355 78
Undepl_3 773 384 75
Total
unique
466 90
IgYHSA-
RP30_1
15,992 2,470 433
IgYHSA-
RP30_2
12,549 2,282 396
IgYHSA-
RP30_3
12,381 2,164 390
Total
unique
3,026 535
CSF samples were analyzed as triplicates following depletion of 14 proteins (IgY14), albumin only (IgYHSA) or no
depletion (Undepl). Additionally CSF samples were analyzed after albumin depletion and further fractionation by
reversed-phase liquid chromatography (IgYHSA-RP30).
1. only hits with Peptide Prophet ≥ 0.95
2. protein identification with Peptide Prophet ≥ 0.9.
Figure 3 Venn diagrams showing distribution of proteins identified in tri plicate experiments after
various depletion methods.
Borg et al. Clinical Proteomics 2011, 8:6
/>Page 6 of 14
more proteins being targeted for depletion in the latter method. A manual inspection
of the protein list not identified in samples subjected to IgY14 depletion indicates that
13 proteins (out of 24) were removed by IgY14 column (isoforms of haptoglobulin,
fibrinogen, complement C3, and a number of immunoglobulin fragments). The lists of
proteins and peptides identified are available as Additional File 1 Table S1 and Addi-
tional File 2 Table S2, respectively, along with corresponding protein abundance as cal-
culated by APEX (Additional File 3 Tables S3, Additional Fi le 4 Table S4 and
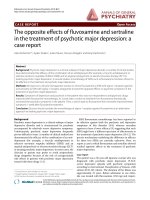
Additional File 5 Table S5). The distribution of most abundant proteins showed that
9-10 proteins accounted each f or more than 2% of total identified proteins (Figure 5).
The 10 most abundant proteins following immunodepletion accounted for 41% (IgY14)
and 46% (IgYHSA) of total CSF protein content, whereas they accounted for 64% of
total protein content in non-depleted CSF samples. Except for abundant proteins com-
mon with plasma, our data also point out other proteins, such as Prostaglandin H2 D-
isomerase (PTGDS) and Cystatin-C (CSTC3) that account for approximately 40% of
total CSF content after depletion vs 20% in non-depleted CSF. On the other hand, low
and medium a bundance proteins account for 59% , 54% an d 36% in IgY14, IgYHSA
and non depleted samples respectively, thus demonstrating significant enrichment of
low- and medium-abundance proteins.
Peptide fractionation
Peptide fractionation techniques are expected to increase the depth of analysis while
possibly deteriorating experimental reproducibility. We set out to evaluate: (1) the gain
in proteome coverage attained after peptide fractio nation using offline reversed-phase;
(2) the overall improvement of samp le dynamic range; ( 3) experimenta l reproducibility
in terms of peptide and protein identification.
Albumin-depleted CSF sample was fractionated into 30 fractions using preparative
reversed-phase chromatography under basic pH. The numbers of confident peptide
and protein identifications obtained from fractionated samples are summarized in
Table 4. A total of 3,026 unique peptides were identified among the 3 replicates (1637
Figure 4 Venn diagram showing distribution of unique peptides (left) and proteins (right)
identified with various depletion methods with PeptideProphet confidence > 0.95.
Borg et al. Clinical Proteomics 2011, 8:6
/>Page 7 of 14
were common to the 3 replicates; Figure 6), corresponding to 535 non-redundant pro-
teins (289 were common to the 3 replicates). Moreover RSD (relative standard devia-
tion) was not increased when compared to unfractionated samples.
We compared the protein list generated with Mascot search alone using a target-
decoy strategy or Mascot search combined with PeptideProphet and ProteinProphet
validation analyses. CSF immunodepletion with IgYHSA column and analysis with
2DLC-MS/MS of one of the replicates led to the identification of 913 prot eins with
Figure 5 Distribution of the 10 most abundant proteins identified in CSF in immunodepleted and
non-depleted samples. A: IgY14-depletion; B: IgYHSA-depletion. C: non-depletion. Protein abbreviations
are as follows: AGT, Angiotensinogen; ALB, albumin; APOA2, Apolipoprotein A-II; B2 M, Beta-2-
microglobulin; CST3, Cystatin-C; DKK3, Dickkopf-related protein-3; GC, Vitamin-D-binding protein; HPX,
Hemopexin; IGFBP6, Insulin-like growth factor-binding protein-6; IGKC; KLK6, kallikrein-6; ORM1,
orosomucoid-1; PTGDS, Prostaglandin-H2-D-isomerase; SERPINA1, Alpha-1-antitrypsin; TF, Serotransferrin;
and TTR, Transthyretin.
Figure 6 Venn diagrams showing distribution of pept ides (left) o r proteins (right ) identified in
triplicate experiments after fractionation.
Borg et al. Clinical Proteomics 2011, 8:6
/>Page 8 of 14
Mascot alone (FDR < 0.001). In contrast, with Mascot-TPP (PeptideProphet and Pro-
teinProphet) strategy, a total of 947 proteins were identified, 402 of which were identi-
fied with high confidence and the remaining 545 identifications were grouped into one
of the 187 protein groups for which members could not be disting uished on the basis
of the peptides observed. The other replicates followed a similar trend.
The increased depth of analysis achieved with fractionation was also evident in terms
of number of LAP detected in the sample. The number of proteins below 2 orders of
magnitude from the most abundant protein as determined by APEX was used as a
parameter to evaluate sample dynamic range following peptide pre-fractionation.
Immunodepletion alone improved the number of LAP from 5 to 18 (Figure 2), whereas
immunodepletion coupled with reversed-phase pre-fractionation further improved it to
53 proteins (Figure 2D).
Discussion
Here we demonstrate that the reduction of sample complexity prior to analysis improves
proteome cover age and the resolution of LAP. The combination of immunodepletion of
the HAP and peptide fractionation is particularly attractive for “mining ” CSF proteome.
The objective of the study was to compare two immunodepletion methods with a simple
and efficient procedure rather than identifying the largest number of proteins.
Protein inference following shotgun LC-MS/MS experimentsisparticularlycompli-
cated in biofluids, such as blood plasma or CSF, because of the frequent occurrence of
protein families, multiple protein isoforms, and homologous proteins. The presence of
peptides common to multi ple proteins may lead to erroneous results at the qualitative
and quantitative levels [18]. In the present study, we used ProteinProphet software
with Occam’s razor rules to reduce the protein list to the minimal set that can explain
the peptides observed. To illustrat e the effects of this strategy on our dataset, we com-
pared the protein list generated with the Mascot search alone using a target-decoy
strategy or Mascot search combined with PeptideProphet and ProteinProphet valida-
tion analyses. It should be noted that more than 86% proteins were identified with
more than one peptide and that all peptide-spectrum matches (PSM) passed the > 0.95
PeptideProphet score. The enhancement of protein identification observed following
CSF immunodepletion is in accordance with previous reports [ 11-14]. It should be
noted that albumin depletion significantly improved protein identification in the pre-
sent study. Moreover, 25 additional proteins were identified following 14-proteins vs.
albumin depletion, while a previous study did not report increased identification with
depletion of 6 proteins compared to albumin alone [13]. Another study compared two
brands of 14 HAP depletion columns [19]. A large number of proteins were identified
with both methods, but no quantitation was performed in the flow-through. Further-
more, in serum, improved protein identification appears to be related, but to a certain
extent only, to the number of proteins depleted [20].
One of the most remarkable aspects of this study was the use of a spectral counting
approach, namely APEX, to calculate protein abundance in the sample. Of note, the
global dynamic range calculated with APEX was similar in t he immunodepleted and
the non-depleted samples. This finding was expected since the experimental dynamic
range observed is a function of the MS dynamic range. It is in accordance with pre-
vious reports [13,14]. Nevertheless, we observed a significant improvem ent not only in
Borg et al. Clinical Proteomics 2011, 8:6
/>Page 9 of 14
the overall number of proteins and peptides identified, but also in the number of pro-
teins with at least two orders of magnitude below the abundance of the most concen-
trated protein in the sample. These improvements were observed regardless of the
immunodepletion system used, as only 4 LAP were additionally identified following
14-proteins d epletion vs. albumin only. These results suggest that the ideal workf low
should be elaborated individually for each study, taking into account number of identi-
fied proteins, as well as loss of non-target proteins. Dynamic range may possibly
extend to 3 logs belo w that of HAP, if depletion methods were specifically designed to
CSF and contained specific HAP like Prostaglandin-D-isomerase or Cystatin-C. Combi-
natorial peptide ligand library technology is another technique that was recently used
to decrease dynamical range and thus increase LAP identification [7]. Several hundreds
of new proteins were identified. However this method needs large sample volumes and
extensive fractionation. When this method was adapted to small volumes, the total
number of identified proteins was reduced to 530, which is quite similar to the number
reported in the present study following fractionation (n = 520).
Conclusion
Here we compared various methods attempting at enrichment of low-abundance pro-
teins in CSF. This approach may be particularly useful in an effort to i dentify biomar-
kers for neurological diseases. The novelty of this study was to show the advantages
and drawbacks of these methods side-to-side. We named and ranked proteins follow-
ing two depletion strategies. Immunodepletion of high abundance proteins was shown
to improve at least 3 folds detection of low abundan ce proteins, with good reproduci-
bility. We compared dynamic range following immunodepletion alone or combined
with peptide prefractionation. Offline fractionation using reversed-phase LC further
incr ease d 3 to 4 folds the o verall number of proteins identified. According to the reli-
able identification and qu antitation obtained with APEX algorithm, it may be consid-
ered as a cheap and quick alternative to study sample proteomic content, helping
proteomics researchers to design more suitable analytical strategies. The optimal
method should allow enhanced detection of LAP and prevent unspecific protein losses.
These data also stres s the urgent need for immunod epl etion columns that specifically
target the most abundant CSF proteins
Materials and methods
CSF samples
Using an atraumatic needle, CSF was obtained by lumbar puncture (2-4 ml per patient)
from subjects attending the Department of Neurology at University Hospital Saint Eti-
enne. CSF was collected in 12-mL polypropylene tubes (VWR), transferred on ice to the
laboratory and centrifuged (3.000 × g, 10 min, +4°C). Fluid was aliquoted into 0.5 mL
polypropylene cryotubes (VWR) and stored at -80°C. The study was approved by t he
local ethics committee of University of Saint Etienne. CSF samples from 5 ALS patients
(Amyotrophic Lateral Sclero sis) aged 50-76 with clinically diagnosed or probab le ALS
following El Escorial diagnostic criteria were pooled and used for further analysis.
Sample setup
The present study was devised using a single pooled CSF sample that was further
divided into 12 aliquots. Each aliquot contained 780 μg total protein (Table 1). Nine of
Borg et al. Clinical Proteomics 2011, 8:6
/>Page 10 of 14
these aliquots were used for immunodepletion evaluation as follows: 3 were depleted of
the 14 most abundant proteins (IgY14 ), 3 were depleted of albumin (IgYHSA), and the
remaining 3 were not immunodepleted. The remaining 3 aliquots were depleted of
albumin and further offline-frac tionated using reversed-phase liquid chromatography
under basic pH after protein digestion.
Immunoaffinity depletion of highly abundant proteins
CSF immunodepletion of highly abundant proteins was performed using pre-packed
liquid chromatography Seppro
®
columns (GenWay Biotech Inc.). The term IgYHSA,
refers to the column used for immunodepletion of albumin alone while IgY14 refers to
that used for immuno depletion of albumin, IgG, a1-antitryps in, IgA, IgM, transferrin,
haptoglobin, a1-acid glycoprotein, a2-macroglobulin, fibrino gen, complement C3, and
apolipoproteins A-I, A-II and B. Prior to injection on the column, each CSF sample
was passed through a 0.45 μm pore size filter to remove particulates. As a result of the
loading capacity of IgY14 columns, CSF aliquots subjected to these columns were
further concentrated using a 3 kDa molecular weight cutoff (MWCO) filter (Millipore).
A chromatographic column was set up on an ÄKTA Ettan system (GE Healthcare)
and run following manufacturer’s instructi ons. Finally, flow-through was desalted and
proteins concentrated using a 3 kDa MWCO filter.
Sample preparation for LC and LC-MS/MS
The final protein concentration of the depleted samples was determined by a bicincho-
ninic acid colorimetric assay (Pierce Biotechnology) using BSA as standard. Se venty
five μg protein of each sample in dissolution buffer (0.1 M triethylammoni um bicarbo-
nate, 0.1%SDS) was reduced with 5 mM tris-(2-carboxy-ethyl)-phosphine for 60 min at
60°C. Free sulfhydryl groups of cysteine residues were then blocked with 15 mM
iodoacetamide for 20 min at room temperature. Digestion with trypsin (Promega) was
performed overnight at 37°C at a 1:50 enzyme-substrate ratio.
Peptide pre-fractionation
To evaluate the impact of peptide fractionation following IgYHSA immunodepletion,
trypsin-digested peptides were pre-fractionated offline by reversed phase liquid chro-
matography under b asic pH conditions (RPb) on an ÄKTA system (GE Healthcare)
using a 300 Extend C
18
column (150 mm length × 2.1 mm ID, 5 μm particles, 300Å
pore size; Agilent). CSF peptides were fractionated into 30 fractions. Peptide mixture
dissolved in buffer A (25 mM NH
4
OH, pH9.5) was loaded onto the column and eluted
with a gradient of 0 to 10% buffer B (25 mM NH
4
OH in acetonitrile pH9.5) over 3
min, then 10% to 28% buffer B for 8 min, and 28% to 45% buffer B for 4 min at 0.5
mL/min column flow rate. Fractions were collected at intervals of 30 seconds. Finally,
acetonitrile was removed by evaporation and fractions were stored at -20°C until
further use.
Mass spectrometry
Prior to LC-MS/MS analysis, dried p eptid e samples were reconstituted with 0.1% aq u-
eous formic acid. Peptide concentration estimates were extrapolated either from pro-
tein concentrations (non-fractionated samples) or from peptid e absorbance at 215 nm
Borg et al. Clinical Proteomics 2011, 8:6
/>Page 11 of 14
during fractionation (RPb-fractionated samples). Approximately 200 ng of each sample
was then loaded onto a 0.180 mm × 20 mm C
18
precolumn Symmetr y
®
(Waters
Corp., Milford, MA) coupled to an analytical C
18
column (BEH130™ 75 μm × 10 cm,
1.7 μm, Waters Corp.) at 15 μl/min flow rate using nanoACQUITY Ultra Performance
LC™ system (Waters Corp., Milford, MA). Peptides were separated in a 70 min gradi-
ent of 1-35% buffer B, followed by 15 min of 35-50% B (A = 0.1% formic acid in water,
B = 0.1% formic acid in acetonitrile), at 250 nl/min flow rate. The column outlet was
directly connected to an Advion Triversa Nanomate (Advion) fitted on an LTQ-FT
Ultra mass spectrometer (Thermo). The mass spectrometer was operated in a data-
dependent mode. Survey full-scan MS spectra (m/z 400-1800) were acquired in the FT
with R = 100.000 at m/z 400 (after accu mulation of a target value of 1e
6
). The five
most intense ions were sequentially isolated for fragmentation and detection in the lin-
ear ion trap using collisionally induced dissociation at a target value of 50.000, 1
microscan averaging and a normalized collision energy of 35%. Target ions already
selected for MS/MS were dynamically excluded for 30 s. Spray voltage and delivery
pressure in the Nanomate source were set to 1.75 kV and 0.3 psi respectively. Capillary
voltageandtubelensontheLTQ-FTweretunedto35Vand109V.Minimalsignal
required to trigger MS to MS/MS switch was set to 100 and activation Q was 0.250.
The spectrometer was working in positive polarity mode and singly charge state pre-
cursors were rejected for fragmentation. We performed at least one blank run before
each analysis in order to ensure the absence of cross contamination from previous
samples.
Data analysis
MS raw data fi les were processed with Mascot Distiller (Version 2.3.2, Matrix Science,
London). The resulting peak lists were searched with Mascot (Version 2.1) against the
human International Protein Index (IPI) database (Version 3.71) concatenated with
reversed IPI sequences. Search criteria were as follows: full tryptic specificity was
required with up to 2 missed cleavage sites allowed; the precursor ion m/z tolerance
was set at 20 ppm; the product ion m/z tolerance at 0.6 Da; carbamidomethylation
(Cys) was set as fixed modification and oxidation (Met) as variable modification.
Peptide-spectrum matches (PSMs) were subjected to statistical validation with t he
PeptideProphet algorithm (TransProteomic Pipeline - TPP v4.3) using the accurate
mass model option and the semi-supervised approach [21]. In brief, the expectation-
maximization (EM) algorithm used by PeptideProphet to construct a Bayes classifier
incorporates decoy peptide hits information from a target-decoy database search. All
PSMs with PeptideProphet ≥ 0.95 were kept for further analyses. Finally, Occam’s
razor logic as implemented in ProteinProphet algorithm was applied to generate the
most coherent list of proteins identified. Therefore, redundant protein entries were
removed by clustering peptides by matching multiple members of a protein family to a
single protein group and considering them as a single identification. Degenerate pep-
tides were discarded before downstream quantitative analysis.
To gain insight into the protein profiling distinctiveness of the three protein deple-
tion strategies, we used the modified spectral counting technique A PEX (v1.2)[16].
This approach makes use of a machine-learning classification algorithm to predict pep-
tide detectability. The program generates a correction factor for each protein ( O
i
Borg et al. Clinical Proteomics 2011, 8:6
/>Page 12 of 14
value), which is then used to predict the number of tryptic peptides expected to be
detected for a given amount of a particular protein. Finally, spectral counts for each
protein observed in a given run are corrected with their respective predicted O
i
value.
TheAPEXabundanceisthereforeamodifiedspectralcountingmethodinwhichthe
total observed spectral count for a given protein is normalized by expected (predicted)
count (Oi) for one molecule or protein. In this regard, APEX abundance is considered
the relative abundance of a particular protein with respect to all other proteins in the
same sample.
Pattern similarity and quantitative analyses were performed using SuperHirn a lgo-
rithm [22]. Bri efly, SuperHirn performs peak detection and deisotoping followed by
peak integration on each LC-MS run in order to build a peptide feature map. Multiple
peptide feature maps are then aligned using 10 ppm precursor tolerance within a win-
dow of 60 second retention time.
Additional material
Additional file 1: Table S1: peptide identification after various depletion methods. CSF samples were
analyzed after depletion of 14 proteins (IgY14), albumin only (IgYHSA) or no depletion. LC-MS/MS analysis allowed
identification of 1075 peptides validated with Peptide Prophet ≥ 0.95. Table shows list of peptides present (Y) or
absent (N) after depletion.
Additional file 2: Table S2: protein identification after various depletion methods. CSF samples were
analyzed after depletion of 14 proteins (IgY14), albumin only (IgYHSA) or no depletion. LC-MS/MS analysis allowed
identification of 189 proteins validated with Peptide Prophet ≥ 0.9. Table shows list of proteins present (Y) or
absent (N) after depletion.
Additional file 3: Table S3: proteins abundance after 14 proteins depletion. CSF samples were analyzed after
depletion of 14 proteins (IgY14). Table shows list of proteins, number of peptides used for identification and APEX
abundance score.
Additional file 4: Table S4: proteins abundance after albumin depletion. CSF samples were analyzed after
depletion of albumin (IgYHSA). Table shows list of proteins, number of peptides used for identification and APEX
abundance score.
Additional file 5: Table S5: proteins abundance without depletion. Non depleted CSF samples were analyzed
by LC-MS/MS. Table shows list of proteins, number of peptides used for identification and APEX abundance score.
Acknowledgements
We thank Barcelona Science Park for Alexandre Campos fellowship and the Spanish Proteomics Network, ProteoRed-
ISCIII. Tanya Yates (Institute for Research in Biomedicine, Barcelona) is gratefully acknowledged for excellent assistance
in writing the manuscript. We also deeply appreciate those who donated their CSF for this study.
Author details
1
Laboratoire de Neurobiochimie, Université Jean Monnet, Saint-Etienne, France.
2
Proteomics Platform, Barcelona
Science Park, Barcelona, Spain.
3
Mass Spectrometry Core Facility, Institute for Research in Biomedicine, Barcelona,
Spain.
4
Institute for Research in Biomedicine, Barcelona, Spain.
Authors’ contributions
JB conceived and coordinated the study, acquired the data, and drafted the manuscript. AC designed the study,
acquired the data, performed statistical analysis, and drafted the manuscript. CD acquired the data, performed the
statistical analysis, and helped draft manuscript. NO acquired the data. EdO designed the study, and helped draft
manuscript. JG coordinated the study and revised manuscript. MV designed the study, acquired the data, and helped
draft manuscript. All authors read and approved final manuscript.
Competing interests
The authors declare that they have no competing interests.
Received: 6 May 2011 Accepted: 3 June 2011 Published: 3 June 2011
References
1. Roche S, Gabelle A, Lehmann S: Clinical proteomics of CSF: towards discovery of new biomarkers. Proteomics Clin
Appl 2008, 2:428-436.
Borg et al. Clinical Proteomics 2011, 8:6
/>Page 13 of 14
2. Abdi F, Quinn JF, Jankovic J, et al: Detection of biomarkers with a multiplex quantitative proteomic platform in CSF
of patients with neurodegenerative disorders. J Alzheimers Dis 2006, 9:293-348.
3. Faca V, Pitteri SJ, Newcomb L, Glukhova V, et al: Contribution of protein fractionation to depth of analysis of serum
and plasma proteomes. J Proteome Res 2007, 6:3558-65.
4. Yuan X, Desiderio DM: Proteomics analysis of human CSF. J Chromatogr 2005, 815:179-89.
5. Zhang J, Goodlett DR, Peskind ER, Quinn JF, et al: Quantitative proteomic analysis of age-related changes in human
CSF. Neurobio Aging 2005, 26:207-227.
6. Zougman A, Pilch B, Podtelejnikov A, Kiehntopf M, et al: Integrated analysis of CSF peptidome and proteome. J
Proteome Res 2008, 7:386-399.
7. Mouton Barbosa E, Roux-Dalvai F, Bouyssie D, Berger F, et al: In-depth exploration of CSF by combining peptide
ligand library treatment and label-free protein quantification. Mol Cell Proteomics 2010, 9:1006-21.
8. Pan S, Zhu D, Quinn JF, Peskind ER, et al: A combined dataset of human CSF proteins identified by multi-
dimensional chromatography and tandem mass spectrometry. Proteomics 2007, 7:469-473.
9. Schutzer SE, Liu T, Natelson BH, Angel TE, et al: Establishing the proteome of normal human CSF. PLoSOne 2010,
5:10980.
10. Liu T, Qian WJ, Mottaz HM, Gritsenko MA, et al: Evaluation of Multiprotein Immunoaffinity Subtraction for Plasma
Proteomics and Candidate Biomarker Discovery Using Mass Spectrometry. Molecular & Cellular Proteomics 2006,
5:2167-2174.
11. Ramstrom M, Hagman C, Mitchell JK, Derrick PJ, Hakansson P, Bergquist J: Depletion of high-abundant proteins in
body fluids prior to liquid chromatography fourier transform ion cyclotron resonance mass spectrometry. J
Proteome Res 2005, 4:410-6.
12. Wetterhall M, Zuberovic A, Hanrieder J, Bergquist J: Assessment of the partitioning capacity of high abundant
proteins in human CSF using affinity and immunoaffinity subtraction spin columns. J Chromatography 2010,
878:1519-1530.
13. Shores KS, Knapp DR: Assessment approach for evaluating high abundance protein depletion methods for CSF
proteomic analysis. J Proteome Res 2007, 6:3739-51.
14. Thouvenot E, Urbach S, Dantec C, Poncet J, Seveno M, Demettre E: Enhanced detection of CNS cell secretome in
plasma protein-depleted CSF. J Proteome Res 2008, 7:4409-21.
15. Xu J, Chen J, Peskind ER, Jin J, et al: Characterization of proteome of human CSF. Int Rev Neurobiol 2006, 73:29-98.
16. Lu P, Vogel C, Wang R, Yao X, Marcotte EM: Absolute protein expression profiling estimates the relative
contributions of transcriptional and translational regulation. Nat Biotechnol 2007, 25:117-24.
17. Vogel C, Marcotte EM: Calculating absolute and relative protein abundance from mass spectrometry-based protein
expression data. Nat Protoc 2008, 3:1444-51.
18. Jin S, Daly DS, Springer DL, Miller JH: The effects of shared peptides on protein quantitation in label-free
proteomics by LC/MS/MS. J Proteome Res 2008, 7:164-9.
19. Fratantoni SA, Piersma SR, Jimenez CR: Comparison of the performance of two affinity depletion spin filters for
quantitative proteomics of CSF: Evaluation of sensitivity and reproducibility of CSF analysis using GeLC-MS/MS
and spectral counting. Proteomics Clin Appl 2010, 4:613-617.
20. Roche S, Tiers L, Provansal M, Sevenod M, et al: Depletion of one, six, twelve or twenty major blood proteins before
proteomic analysis: The more the better? J Proteomics 2009, 72:945-951.
21. Choi H, Nesvizhskii AI: Semisupervised model-based validation of peptide identifications in mass spectrometry-
based proteomics. J Proteome Res 2008, 7:254-65.
22. Mueller LN, Rinner O, Schmidt A, Letarte S, et al: SuperHirn - a novel tool for high resolution LC-MS-based peptide/
protein profiling. Proteomics 2007, 7:3470-80.
doi:10.1186/1559-0275-8-6
Cite this article as: Borg et al.: Spectral counting assessment of protein dynamic range in cerebrospinal fluid
following depletion with plasma-designed immunoaffinity columns. Clinical Proteomics 2011 8:6.
Submit your next manuscript to BioMed Central
and take full advantage of:
• Convenient online submission
• Thorough peer review
• No space constraints or color figure charges
• Immediate publication on acceptance
• Inclusion in PubMed, CAS, Scopus and Google Scholar
• Research which is freely available for redistribution
Submit your manuscript at
www.biomedcentral.com/submit
Borg et al. Clinical Proteomics 2011, 8:6
/>Page 14 of 14