Báo cáo y học: "Trauma, poverty and mental health among Somali and Rwandese refugees living in an African refugee settlement – an epidemiological study" pps
Bạn đang xem bản rút gọn của tài liệu. Xem và tải ngay bản đầy đủ của tài liệu tại đây (326.47 KB, 16 trang )
BioMed Central
Page 1 of 16
(page number not for citation purposes)
Conflict and Health
Open Access
Research
Trauma, poverty and mental health among Somali and Rwandese
refugees living in an African refugee settlement – an
epidemiological study
LamaroPOnyut*
1,2
, Frank Neuner
3,4
, Verena Ertl
3,4
, Elisabeth Schauer
4
,
Michael Odenwald
2,4
and Thomas Elbert
2,4
Address:
1
Mbarara University of Science and Technology, Uganda,
2
University of Konstanz, Germany,
3
University of Bielefeld, Germany and
4
Vivo
International, Zur Setze 7, 78476 Allensbach, Germany
Email: Lamaro P Onyut* - ; Frank Neuner - ; Verena Ertl - ;
Elisabeth Schauer - ; Michael Odenwald - ;
Thomas Elbert -
* Corresponding author
Abstract
Background: The aim of this study was to establish the prevalence of posttraumatic stress
disorder (PTSD) and depression among Rwandese and Somali refugees resident in a Ugandan
refugee settlement, as a measure of the mental health consequences of armed conflict, as well as
to inform a subsequent mental health outreach program. The study population comprised a sample
from 14400 (n = 519 Somali and n = 906 Rwandese) refugees resident in Nakivale refugee
settlement in South Western Uganda during the year 2003.
Methods: The Posttraumatic Diagnostic Scale (PDS) and the Hopkins Symptom Checklist 25 were
used to screen for posttraumatic stress disorder and depression.
Results: Thirty two percent of the Rwandese and 48.1% of the Somali refugees were found to
suffer from PTSD. The Somalis refugees had a mean of 11.95 (SD = 6.17) separate traumatic event
types while the Rwandese had 8.86 (SD = 5.05). The Somalis scored a mean sum score of 21.17
(SD = 16.19) on the PDS while the Rwandese had a mean sum score of 10.05 (SD = 9.7).
Conclusion: Mental health consequences of conflict remain long after the events are over, and
therefore mental health intervention is as urgent for post-conflict migrant populations as physical
health and other emergency interventions. A mental health outreach program was initiated based
on this study.
Background
The firm establishment of Posttraumatic Stress Disorder
(PTSD) as a category of mental ill health in the Diagnostic
and Statistical Manual (DSM) has inspired fervent
research into its epidemiological manifestations and char-
acteristics.
Since the critically acclaimed National Co-morbidity Sur-
vey of 8,098 subjects in the United States [1]other epide-
miological studies have established PTSD prevalence rates
and other epidemiological characteristics in European [2-
6], Australian and other western populations.
Published: 26 May 2009
Conflict and Health 2009, 3:6 doi:10.1186/1752-1505-3-6
Received: 15 January 2009
Accepted: 26 May 2009
This article is available from: />© 2009 Onyut et al; licensee BioMed Central Ltd.
This is an Open Access article distributed under the terms of the Creative Commons Attribution License ( />),
which permits unrestricted use, distribution, and reproduction in any medium, provided the original work is properly cited.
Conflict and Health 2009, 3:6 />Page 2 of 16
(page number not for citation purposes)
More recently, research has focused on post-conflict refu-
gee populations from low-income countries who have
relocated to western countries. These include Southeast
Asian (Indochinese) [7], Kosovar [8], Cambodian [9], or
Bosnian refugees [10] relocated to the United States or
Australia [11], or to the United Kingdom [12], who in
general show higher prevalence rates than western popu-
lations.
In a similar vein, emerging research in post-conflict popu-
lations relocated to other low-income host countries or
remnant in their countries of origin, such as Bosnian refu-
gees relocated to Croatia [13], Afghan refugees resident in
Pakistan [14] or Tibetan refugees resident in India [15]
continue to demonstrate the disturbingly high prevalence
rates of traumatic stress reactions and related disorders
among post-conflict populations.
This is especially true for Africa, where many of the
world's conflicts, displacing thousands of survivors, take
place. According to UNHCR, Africa hosts at least 20% and
rising of the world's refugees and other migrant popula-
tions [16].
Studies carried out among post-conflict populations in
Africa in order to quantify the incidence and prevalence of
PTSD and depression are of growing interest. For example,
De Jong et al. cite 37.4% PTSD prevalence in Algeria and
15.8% in Ethiopia in a study encompassing four different
post-conflict settings with differing backgrounds [17].
In a representative survey conducted in Rwanda after the
Rwanda genocide, Pham et al. found that 24.8% of the
respondents met the symptom criteria for PTSD [18].
Dyregrov et al. found that 79% of the youth in Rwanda
were at risk of developing PTSD [19]. In a later study,
Schaal et al. found a 44% prevalence of PTSD among
respondents who were children at the time of the geno-
cide [20].
Uganda, a small East African country with a population of
little over 28 million inhabitants, has long been a host to
refugees from the region due to various conflicts. One of
the bigger refugee populations has been the refugees from
the Rwandan genocide in the year 1994. Other popula-
tions include the Somali refugees from the conflicts in
Somalia dating to 1991. Adequate information about
these refugees is necessary in order to plan appropriately
for emergency care and mental health care provision.
Some studies have been conducted in Uganda on some
refugee populations. For example, Neuner et al. found
50.5% PTSD prevalence among Sudanese refugees resi-
dent in northern Uganda, compared to 44.6% of Suda-
nese nationals still resident in the Sudan and 23.2% of
Ugandan nationals resident in north Uganda [21,22]. To
date, such data has been unavailable about the sizable
Rwandese and Somali refugee populations in Uganda,
mostly resident in the south of the country.
The concern that data on the prevalence of diagnosed
common mental health disorders, including PTSD,
among post-conflict populations in Africa is still scanty, is
compounded by the fact that methodological inconsisten-
cies still prevail in existing and continuing studies. For
instance, most researchers use diagnostic instruments
whose translations have not been validated in the target
population. Setting the standard, Mollica et al. rightly val-
idated the Havard Trauma Questionnaire among the
Indochinese before using it for measurements within the
same questionnaire [23]. Other studies, however, have
used the same questionnaire without validating it within
the target population, thus raising questions about the
quality of measurements. Additionally, many researchers
still merely estimate risk for PTSD, without affirming a
PTSD diagnosis. Such prevalence outcomes are difficult to
compare with studies where PTSD is diagnosed according
to the DSM-IV.
Since more and more Africans are fleeing from conflicts in
their own land to neighbouring low-income host nations,
such as Rwandese and Somali refugees fleeing to Uganda,
the urgency consists in not only learning more about the
prevalence rates of PTSD and its co-morbid disorders
among refugee and other displaced survivor populations
with a view to planning mental health outreach to the
populations of concern, but also to acquire this knowl-
edge by employing studies that meet international meth-
odological standards.
Our goal was a comprehensive methodologically strin-
gent epidemiological study in order to establish rates of
trauma exposure, and subsequent PTSD and depression
prevalence among post-conflict refugee survivors in an
African setting. Unlike any other previous studies, a care-
ful measure of the socio-economic status of respondents
was undertaken, in order to investigate how poverty inter-
acts with mental health disorders in a post-conflict popu-
lation resident in a low-income country. The bulk of
interviews, carried out by local trained lay interviewers,
only proceeded after the validation exercise, and even
then only under close supervision.
Methods
Setting
Nakivale Refugee Settlement is one of the 8 official refu-
gee camps in Uganda. It is situated in South-western
Uganda 60 kilometres from Mbarara, the third largest
town in Uganda. Nakivale settlement, 42 square kilome-
tres in size, is also one of the oldest in Uganda, having
Conflict and Health 2009, 3:6 />Page 3 of 16
(page number not for citation purposes)
already been in existence by 1952. At the time the study
was carried out, (2003), Nakivale was host to 14,400 ref-
ugees -12,000 of them Rwandan Hutu refugees from the
conflicts in the early 1990s – and slightly over 500 Soma-
lis who fled to Uganda via Kenya [24]. A confirmatory age-
restricted replica study was carried out in 2006 in connec-
tion with a human genome study [25].
These numbers are according to the official camp statistics
from the camp administration. The refugees receive basic
health care and a minimum of food aid. Educational
opportunities are available for primary school-age chil-
dren, and every family can supplement its income
through agriculture from land granted by the Ugandan
government at no cost. Mental health support for the ref-
ugees has been negligible.
Refugees are a protected population and refugee settle-
ments are protected areas under the joint custodianship of
UNHCR and the Ugandan government, represented in the
settlement by the Camp Commandant.
Permission to carry out the study was obtained from both
the above-named parties, and the study was approved by
the ethical boards of Mbarara University of Science and
Technology, Uganda and the University of Konstanz, Ger-
many.
During the pre-inquiry phase of the study, the communi-
ties and their leaders were informed in depth about the
proposed study, and the sampling rationale was explained
in brief.
At the very outset, it was made clear to all the respondents
that the interviews were entirely voluntary, and no mone-
tary or food-item inducements would be offered.
Participants
Participants came from the Rwandese and Somali refugees
resident in Nakivale refugee settlement in South Western
Uganda. The inclusion criteria encompassed all Rwandese
(Hutu) and Somali refugees of either sex above the age of
12 officially registered and resident in Nakivale refugee
settlement.
Participants were fully informed before participation,
albeit verbally, since most of them were analphabetic.
They gave a verbal informed consent before the interview
was begun.
Since this study was completed, the respondent Somali
refugee population has been resettled almost in entirety.
It has been replaced by new refugees, whom the data here
presented may not represent.
Aims
We aimed to (a) assess the general nutritional, socio-eco-
nomical, educational and physical health status of the ref-
ugees (b) assess the prevalence of mental disorders
associated with exposure to stressful and traumatic armed
conflict situations, specifically posttraumatic stress disor-
der and depression and (c) ascertain the types, descrip-
tions and numbers of extremely stressful and traumatic
events to which survivors were exposed.
It was expected that PTSD and depression could be iden-
tified in this non-western population; that the PTSD con-
struct would prove valid in this population, and that
prevalence rates would resemble those from studies based
on other non-western post-conflict populations in low-
income countries.
As already mentioned, the bulk of data for this study was
collected in the year 2003. However, an age-restricted rep-
lica study was conducted in the year 2006, which largely
confirms the results here presented. For purposes of clarity
and brevity, these will be reported separately.
Instrumentation
Socio-demographic interview
We employed a previously developed sociodemographic
survey to assess nutritional, educational, socio-economic
and physical health indicators as well as displacement and
general demographic information [21,22,26].
The interview began with personal information like gen-
der, age and marital status, as well as displacement his-
tory. Nutrition was assessed by asking for the number of
meals eaten the previous day and by listing the various
food items consumed. Since the refugees rarely have
steady income flow, their economical status was ascer-
tained by counting the number of essential household
assets such as blankets, mattresses, cooking pots and water
containers. These items would be acquired whenever any
sort of income was available. In analysis, the value of the
items was then weighted according to then-current market
prices in Uganda. This value is presented as American dol-
lars in the data. Educational achievement was indicated
by the number of years of schooling completed. Physical
health was evaluated against a checklist of common ill-
nesses experienced within the last-one-month period.
Such illnesses include malaria, cough, headache, tubercu-
losis, epilepsies, scabies, leprosy and sexually transmitted
diseases.
Event Checklist
A 34-item Event Checklist developed by this group of
researchers in previous studies with post-conflict popula-
tions was used to identify extremely stressful and trau-
matic events that the interviewees had experienced within
Conflict and Health 2009, 3:6 />Page 4 of 16
(page number not for citation purposes)
their lifetimes [21,22,26]. The list includes different event
types including combat, assaultive violence, torture, sex-
ual violence, accident, natural disasters as well as forced
circumcision and marriage. Each event was scored as ever
experienced (within the lifetime) and experienced in the past
year. The number of different experienced and witnessed
types of traumatic events was used as an estimate of the
severity of trauma exposure.
Assisted Self-Report
A key objective of this study was to evaluate the efficacy of
local capacity building within a community-based
approach both in the procedure of scientific inquiry, and
in the provision of treatment. A local team of non-profes-
sional interviewers therefore conducted the interviews
under supervision after rigorous training. In order to
screen for Post Traumatic Stress Disorder (PTSD), the
Posttraumatic Stress Diagnostic Survey (PDS) was
employed as a standardized assisted self-report instru-
ment [27]. Both the frequency and severity of PTSD were
indicated.
For this study, the PDS was chosen as the chief diagnostic
tool because of its confirmed psychometric properties as a
self-report questionnaire [27,28]. It is the only self-report
measure to assess all six (A-F) criteria for PTSD in the
DSM-IV. Part 1 of the PDS is a 13-item checklist of poten-
tial traumatic events. Part 2 consists of eight items that
help determine if an event meets the DSM-IV definition of
Criterion A. Part 3 assesses the frequency over the past
month of the 17 PTSD symptoms, using a 4-point scale
ranging from 0 – Not at all or only one time to 3 – 5 or
more times a week/almost always. Part 4 assesses the
impact of symptoms on various aspects of social and
occupational functioning.
An eight-point list of possible functioning deficits (which
the respondent attributed to posttraumatic symptoms)
was applied. This included 1) ability to engage in occupa-
tional activities (earn a living), 2) ability to engage in con-
structive activities within the household such as
performing household chores, 3) ability to sustain
healthy relationships with friends 4) ability to engage in
hobbies, 5) ability to take part in instructional activities
such as schooling, 6) ability to sustain healthy family rela-
tions, 7) general satisfaction with life and 8) overall func-
tions in all areas of life. This is presented in the results as
sum score of functioning deficits.
The PDS yields both a dichotomous diagnostic score and
a cumulative symptom frequency score. An individual
PTSD symptom is counted as present if the corresponding
PDS item is endorsed as a 1 or higher.
In our validations of the PDS, over an interval of approx-
imately two weeks, test-retest cum inter-rater reliability for
symptom severity achieved a kappa of 0.74, for diagnostic
agreement between the two administrations. The PDS had
reasonable diagnostic utility against a PTSD diagnosis
based on the CIDI, with a sensitivity of .85, a specificity of
.84, an efficiency of .79. A validation report of all instru-
ments here cited is reported in detail by Ertl et al. [29].
Validation Interview
The Composite International Diagnostic Interview (CIDI)
[30] version 2.1 was chosen as the clinician-administered
instrument, which would validate the PDS in its local lan-
guage translation as a diagnostic tool. In the validation, a
sample of the respondents interviewed by the local inter-
viewers (who used the PDS) were re-interviewed by clini-
cians using the CIDI section K, within a two-week period.
The Hopkins Symptom Checklist 25 (HSCL-25) was cho-
sen as an assisted self-report interview to indicate the pos-
sibility of co-morbid depression [31,32]. The respective
CIDI section E was used for validation purposes. A more
extensive investigation with other sections of the CIDI was
considered impractical given personnel and other con-
straints.
The entire questionnaire (encompassing the socio-demo-
graphic interview, the Event Checklist as well as the PDS
and HSCL-25 diagnostic interviews) was then translated
into the local languages Somali and Kinyarwanda using
several steps of translations, blind back translations and
subsequent corrections by independent groups of transla-
tors. Details of training, translation and validation of the
local language instruments are elsewhere described [33].
Procedure
Sampling
The Somali population totalled approximately 500 per-
sons. They were mostly refugees from the 1991–1992 civil
war in Somalia, who have fled to Uganda via Kenya. In
addition to the war events, many had flight events that
had forced them to flee further than their initial destina-
tions of refuge, e.g. Kenya. For this population, a complete
sample was carried out, i.e. a hut-to-hut interviewing pro-
cedure for all the huts was effected. Every Somali refugee
above the age of 12 in every household permanently resi-
dent in the camp was interviewed.
Of the 14.400 refugees in this settlement, 12.000 are
Rwandese, of mostly Hutu ethnic origin. These are refu-
gees from the ethnic conflicts in Rwanda in the early
1990s. For this population, a single-stage cluster sampling
procedure was employed, with cluster units of unequal
size (the households were of unequal size); the house-
holds being the listing units. The list of households in
Conflict and Health 2009, 3:6 />Page 5 of 16
(page number not for citation purposes)
each zone constituted the sampling frame. From the lists
of households in each Rwandese zone, a number of
households were sampled at random in the ratio of the
size of the zone in proportion to the total number of
Rwandese households in the camp. Since the zones were
arranged in no discernible order, the middle of the zone
(usually a trading centre), was used as a starting point. A
hut-to-hut interview procedure was enacted with huts
being selected according to the random cluster sample.
The interviewers sampled huts outwards in the four direc-
tions from the centre of the village. All present household
members of the selected huts were interviewed, beginning
with the household head and including any adolescents
above the age of 12. Every attempt was made to interview
members of the specific huts before any re-assignments
were made. In the sample, assignments were made with-
out replacement. Each respondent was interviewed once
by a local, trained non-professional interviewer, except for
the random sub-sample that was re-interviewed within
two weeks by expert clinicians using the CIDI for purposes
of validation. Both the assisted self-report and expert
interviews were face-to-face at-home interviews. The
response rate was over 90%.
Validation
In order to validate the instruments that were translated, a
validation exercise was carried out by the expert team. A
random sample of the interviews that were conducted by
the local trained lay interviewers using the PDS (n = 98)
were re-interviewed by the expert clinicians using the CIDI
Section K, within a time space of two-weeks. The valida-
tion was both a test-retest validation since the same
patients were interviewed twice within a two-week period
using two different instruments, as well as an inter-rater
validation since the expert team re-tested the interviews
done by the trained lay local interviewers.
The Kinyarwanda version of the PDS (n = 60; 6.5% of the
Rwandese interviews) had a kappa score of 0.72, a sensi-
tivity of 0.83 and a specificity of 0.89. The Somali version
of the PDS (n = 38; 7% of the Somali interviews) had a
kappa score of 0.71, a sensitivity of 0.88 and a specificity
of 0.85. Both local instruments had a joint kappa score of
0.74, a sensitivity of 0.86 and a specificity of 0.88. Addi-
tionally, the correlation between the PTSD diagnosis
made by the trained lay interviewers using the PDS and
the diagnosis made by the expert clinicians using the CIDI
was 0.732; p < .001.
The section of the HSCL-25 measuring depression was
validated using the CIDI Section E within a two-week
period. The kappa value of the Rwandese version of the
HSCL-25 depression section where a cut-off score of 1.75
was employed was 0.11; where a cut-off score of 1.67 was
employed was 0.24 and 0.46 using the Bolton algorithm.
The Rwandese version of the HSCl-25 has a sensitivity
value of 0.10 for a 1.75 cut-off score, 0.20 for a cut-off
score of 1.67 and 0.50 for the Bolton algorithm. This ver-
sion also had a specificity value of 0.98 at the 1.75 cut-off
score, 0.98 at the 1.67 cut-off score and 0.93 when the
Bolton algorithm was employed. (This algorithm was
developed and tested by the Havard Program in Refugee
Trauma. Since the HSCL-25 was created prior to the DSM
Depression criteria, it is not entirely consistent with the
DSM 'A' criteria for depression. The algorithm was devel-
oped to match HSCL-25 Depression questions to DSM
Criteria for Major Depression [34]. The Somali version of
the HSCL-25 depression section had a kappa value of 0.35
at the 1.75 cut-off score, 0.37 at the 1.67 cut-off score and
0.13 when the Bolton algorithm was employed. This ver-
sion also had a sensitivity of 0.57 at the 1.75 cutoff score,
0.64 at the 1.67 cut-off score and 0.79 using the Bolton
algorithm. A specificity of 0.77 was achieved at the 1.75
cut-off score, 0.73 at the 1.67 cut-off score and 0.36
employing the Bolton algorithm.
Taken together, both local language versions of the
depression section of the HSCL-25 achieved a kappa value
of 0.31 at the 1.75 cut-off score, 0.37 at the 1.67 cut-off
score and 0.35 employing the Bolton algorithm. A joint
sensitivity value of 0.38 at the 1.75 cut-off score was
achieved, 0.46 at the 1.67 cut-off score and 0.67 employ-
ing the Bolton algorithm. A joint specificity value of 0.90
at the 1.75 cut-off score, 0.89 at the 1.67 cut-off score and
0.73 using the Bolton algorithm was achieved. The Event
List used was a newly-arranged version of one used in a
previous study [21]. It showed a high internal consistency
(Cronbach's α > .88); significant retest-reliability (r = .73;
p < .001) and significant accordance with the CIDI Event
List. The Socio-Demographic Survey produced data which
proved to be satisfactory. Of 36 items, 31 reached signifi-
cance with correlations between r = .38, p = .021 and r =
.97, p < .001; and kappa scores between κ = .48; p < .001
and K = 1.00, p < .001 respectively.
A more detailed account of the validation results can be
consulted in Ertl et al. [29].
Results
Demographic Profile of the Sample
Over 1491 interviews were completed, of which 1422
were used in the analyses (n = 516 Somalis and n = 906
Rwandese). The remaining interviews were excluded
because the respondents were Kinyarwanda-speaking but
were not ethnic Rwandese.
Religion and Marital Status
All the Somalis except 1 were Muslims (n = 515) while
90.5% of the Rwandese were Christian. More than half of
Conflict and Health 2009, 3:6 />Page 6 of 16
(page number not for citation purposes)
the respondents (57.9%) were married, 26.4% were sin-
gle, and 8.5% were widowed while the remaining 6.8%
were separated, co-habiting or divorced.
Education and Occupation
Of the respondents, 34.6% had never been to school,
while 46.3% had had basic primary education (1–7) years
of schooling. 17% had had at least 12 years of schooling,
which translates to secondary education. Only 1.5% had
had more than 13 years of schooling, which translates to
tertiary (professional, vocational or university) education.
The mean number of years of schooling was 3.82 (SD =
3.83).
Before their first experience of displacement, 35.8% of the
respondents were farmers, 29.5% had no occupation and
13.8% were displaced as students. At the time of the study,
41.6% of the respondents had no occupation, 39.5% were
farmers and 8.2% worked within a household. Other
occupations included working for non-governmental
organizations, working for the police or army or operating
a restaurant or repair shop. Differences between national
groups in occupation before displacement were signifi-
cant; χ
2
= 459.5, p < .000.
Only 2.9% of the Somalis claimed to have been farmers
before displacement, and just 0.58% claimed to be farm-
ers at the time of the study, in contrast to 54.5% of the
Rwandese who were farmers before displacement and
61.7% who had become farmers since their displacement.
These findings are mirrored in the fact that less than 1%
of the Somalis rely on agriculture as a source of food.
While 46.5% of the Somalis and 19.6% of the Rwandese
had no occupation before displacement, a hefty 79.8% of
the Somalis and only 19.6% of the Rwandese claimed no
occupation since displacement. Differences between
national groups in occupation after displacement were
also significant; χ
2
= 657.8, p < .000.
Nutrition
Of the total number of respondents, 93.9% cited the food-
aid provided by the UNHCR as their primary source of
food while barter trade was an important food source for
3.1% and agriculture for 2.2%. Notably, 99% of the
Somalis depended on food-aid. Barter trade and agricul-
ture combined were a primary food source for at least 8%
of the Rwandese. The mean number of meals was 1.43
(SD = 0.53). Only 71 people (5%) of the sample had fish
or meat as part of their diet.
Economic Indicators
Of the sample, 1251 (88.2%) have a rent-free accommo-
dation (semi-permanent house). The asset value used in
analyses does not include the value of rent-free accommo-
dation, a free water supply (though not piped), subsidized
educational opportunities for primary school children,
subsidised health care and free recreational sports access.
The mean asset value was $ 9.99 (SD = 12.1).
Migration Factors
Migration into Nakivale camp began as early as 1952 and
was still going on in 2003. The greatest influx were in
1991 (n = 357), and 1994 (n = 786) which coincide with
the Somali war and the Rwanda genocide and respec-
tively. The mean number of years spent in the camp was
3.88 (SD = 2.64). Everyone had been displaced at least
once.
Mental Health Indicators
The mean number of separate traumatic events experi-
enced over the lifetime was 9.98 (SD = 5.68). Over the
past year, a mean of 0.29 (SD = 1.27) events were experi-
enced. The mean sum score on the PDS (number of sepa-
rate PTSD symptoms) was 14.1 (SD = 13.5) from a
possible 51. The mean scores on the symptom sub-clus-
ters were: arousal M = 3.76 (SD = 4.2), intrusion (M = 5.0
(SD = 4.85) and avoidance M = 5.32 (SD = 5.61). The
mean score on depression on the HSCL-25 was 0.77 (SD
= 0.81) and 0.75 (SD = 0.74) on anxiety. The mean
number of separate physical complaints in the past
month was 4.35 (SD = 2.54) and 2.07 (SD = 2.26) func-
tioning deficits within the same period.
Nationality Differences
The two national groups were clearly distinct in general
characteristics: The Somalis tended to have larger house-
holds than the Rwandese, had spent more years in the
camp, had fewer meals daily but were a younger popula-
tion and had had more years of education. Differences in
education did not however translate into differences in
value of possessions, which were insignificant across
nationality and gender (M = $9.99, SD = 12.1).
The Somalis had experienced more lifetime traumatic
events than the Rwandese, more traumatic events within
the past year and therefore scored higher on the PDS. The
Somalis also scored higher than the Rwandese on separate
PTSD symptom clusters: intrusions, avoidance, arousal,
active avoidance, passive avoidance, anxiety symptoms,
and depression symptoms.
The different levels of trauma exposure and PTSD preva-
lence did not occasion any nationality differences in
reported number of health complaints or in functioning
deficits.
The Somali national group was more homogeneous than
the Rwandese national group. For example, within the
Somali national group, there were no differences in PTSD
Conflict and Health 2009, 3:6 />Page 7 of 16
(page number not for citation purposes)
prevalence, number of lifetime and recent event types,
PDS sum score, intrusive PTSD symptoms, passive and
active avoidance PTSD symptoms, depression scores,
number of health or functioning deficits, number of years
spent in the camp, age or value of possessions between
Somali men and women. However, the women scored
higher on arousal symptoms of PTSD and anxiety symp-
toms than the men. Somali women also had fewer meals,
had had fewer years of schooling, had larger households
than Somali men and reported less substance use (khat).
Among the Rwandese, the men had a higher PTSD preva-
lence, a higher number of lifetime traumatic events, a
higher PDS sum score, higher active avoidance and pas-
sive avoidance symptom scores, and higher depression
scores. Rwandese men also scored higher on intrusion
symptoms as well as avoidance symptoms taken as a
whole and had less to eat than the women. They also
reported more functioning deficits than the women and
more substance use.
The Rwandese women had larger households, however,
had fewer possessions, had had fewer years of schooling
and were younger than the men.
Gender differences in recent traumatic events, arousal
PTSD symptoms, anxiety levels, health deficits and years
spent in the camp among the Rwandese were not signifi-
cant.
Gender
Gender did not prove to be a uniform factor across cul-
tures. While the Rwandese women had the fewest number
of lifetime traumatic events, the lowest prevalence of
PTSD as well as the lowest PDS sum score, the Somali
women were highly traumatised, had as many events as
the Somali men and as high a PDS score. On all indicators
of ill health, the Somali women scored higher than the
Rwandese women. Somali women had experienced more
lifetime and recent traumatic events than Rwandese
women, and therefore scored higher on the PDS and on
all three symptom clusters. Somali women also scored
higher than Rwandese women on the avoidance sub-clus-
ters (active and passive avoidance) as well on anxiety and
depression symptoms
The Somali women had spent more years in the camp
than the Rwandese women, had larger households and
less to eat. Rwandese women reported more substance use
(crude liquor) than Somali women.
There were no differences in age, level of education, value
of possessions or health and functioning between the two
national groups of women.
Among the men, differences were also evident along
nationality lines. Somali men scored higher than Rwan-
dese men on all ill-health parameters: they had experi-
enced more lifetime traumatic events and scored higher
on the PDS. Somali men also displayed a higher number
of intrusive, avoidance and arousal symptoms than Rwan-
dese men. Somali men scored higher on the avoidance
sub-clusters (active and passive avoidance) as well as on
depression symptoms than Rwandese men.
Somali men also had spent more years in the camp, had
larger households and had less to eat than the Rwandese.
They were also younger and better educated. Rwandese
men reported the highest use of addictive substances (in
this case local alcoholic brew). The differences between
number of recent events experienced by Somali and
Rwandese men, health and functioning were not signifi-
cant. (A table summarising means of important variables
across gender and nationality is provided at the end of the man-
uscript: see Table 1. A table showing t-tests for variable differ-
ences across gender and nationality is attached as an
Additional file: see Additional file 1)
Prevalence
The prevalence of PTSD in the whole sample was 37.8%
(n = 538). Gender and nationality differences were evi-
dent, with more men (42.7%, n = 269) suffering than
women (34%, n = 269) and more Somali (48.1%, n =
248) than Rwandese (32%, n = 290). Within nationality
groups, further differences manifested themselves. While
Somali men and women suffered equally (48.1%, n =
126; 48%, n = 122) respectively, Rwandese men suffered
more from PTSD than the women (38.9%, n = 143;
27.3%, n = 147). (A table summarising the PTSD prevalence
rates is included at the end of the manuscript: see Table 2).
Nationality differences in PTSD prevalence were signifi-
cant: χ
2
(df = 1) = 36.02; p < .000. Gender differences in
PTSD prevalence were significant only within the Rwan-
dese national group: χ
2
(df = 1) = 13.52; p < .000. Gender
differences in PTSD prevalence across cultural groups
were also significant: Somali women had a higher PTSD
prevalence than Rwandese women: χ
2
(df = 1) = 33.08; p
< .000, while Somali men showed a higher prevalence of
PTSD than Rwandese men: χ
2
= 5.27; p = .022.
Event types
The single most reported event was witnessing dead or
mutilated bodies, reported by 73.5% of the respondents
(n = 1065). Other often-reported events were shelling or
bomb attack, reported by 69.3%; witnessed injury with a
weapon, reported by 67.7%; experiencing crossfire or
sniper attacks, reported by 60.3% and experiencing burn-
ing houses, reported by 60.2%.
Conflict and Health 2009, 3:6 />Page 8 of 16
(page number not for citation purposes)
Table 1: Means of important indicators across national and gender groups (Standard Deviation in brackets)
Key Indicators Camp Men Women Somali Rwandese Somali Men Somali Women Rwandese Men Rwandese Women
No. of Events
(Lifetime)
9.98
(5.68)
11
(5.54)
9.17
(5.66)
11.95
(6.17)
8.86
(5.05)
11.75
(5.97)
12.16
(6.38)
10.47
(5.16)
7.77
(4.67)
No. of recent Events 0.29
(1.27)
0.3
(0.99)
0.29
(1.45)
0.45
(1.93)
0.2
(0.63)
0.38
(1.3)
0.53
(2.42)
0.23
(0.71)
0.17
(0.58)
PDS Sum Score 14.1
(13.54)
14.77
(13.33)
13.53
(13.69)
21.17
(16.19)
10.05
(9.7)
19.81
(15.82)
22.58
(16.48)
11.17
(9.77)
9.28
(9.58)
Arousal symptoms 3.76
(4.2)
3.77
(4.03)
3.75
(4.34)
5.73
(5.23)
2.63
(2.95)
5.19
(4.89)
6.28
(5.52)
2.75
(2.89)
2.56
(2.99)
Intrusion symptoms 5.0
(4.85)
5.22
(4.9)
4.83
(4.81)
7.19
(5.98)
3.76
(3.51)
6.71
(6.06)
7.7
(5.89)
4.15
(3.51)
3.49
(3.49)
Avoidance symptoms 5.32
(5.61)
5.78
(5.72)
4.95
(5.5)
8.25
(6.46)
3.66
(4.25)
7.91
(6.62)
8.6
(6.28)
4.27
(4.42)
3.23
(4.09)
Active Avoidance 2.79
(2.82)
2.97
(2.79)
2.65
(2.83)
4.46
(2.95)
1.84
(2.24)
4.27
(2.93)
4.65
(2.97)
2.05
(2.27)
1.7
(2.21)
Passive Avoidance 2.53
(3.35)
2.81
(3.54)
2.3
(3.16)
3.8
(4.28)
1.81
(2.39)
3.65
(4.47)
3.95
(4.08)
2.22
(2.54)
1.53
(2.24)
Anxiety 0.75
(0.74)
0.72
(0.70)
0.78
(0.77)
0.95
(0.91)
0.64
(0.59)
0.81
(0.82)
1.09
(0.98)
0.65
(0.58)
0.63
(0.59)
Depression 0.77
(0.81)
0.81
(0.81)
0.73
(0.81)
1.33
(1.01)
0.44
(0.42)
1.25
(0.98)
1.40
(1.03)
0.49
(0.44)
0.42
(0.41)
Meals 1.43
(0.53)
1.39
(0.51)
1.46
(0.54)
1.06
(0.34)
1.64
(0.5)
1.10
(0.38)
1.02
(0.29)
1.60
(0.49)
1.67
(0.5)
Health complaints sum score 4.35
(2.54)
4.18
(2.57)
4.48
(2.52)
4.22
(2.77)
4.42
(2.41)
4.05
(2.65)
4.41
(2.87)
4.28
(2.50)
4.5
(2.34)
Functioning Deficits 2.07
(2.26)
2.44
(2.36)
1.81
(2.16)
2.45
(3.14)
2.02
(2.09)
2.23
(3.01)
2.71
(3.31)
2.48
(2.21)
1.71
(1.97)
Drug sum score 0.74
(3.25)
1.33
(4.65)
0.27
(1.22)
0.27
(1.57)
0.99
(3.87)
0.53
(2.18)
0.004
(0.06)
1.89
(5.72)
0.4
(1.46)
Household size 5.39
(3.27)
5.05
(3.26)
5.66
(3.25)
6.68
(3.76)
4.65
(2.69)
6.19
(3.44)
7.19
(3.99)
4.23
(2.85)
4.93
(2.53)
Years spent in camp 3.88
(2.64)
4.12
(2.67)
3.69
(2.60)
5.7
(2.03)
2.85
(2.38)
5.74
(2.14)
5.65
(1.91)
2.96
(2.39)
2.78
(2.37)
Education 3.82
(3.83)
4.92
(4.18)
2.95
(3.28)
5.04
(4.49)
3.13
(3.20)
6.83
(4.45)
3.2
(3.73)
3.57
(3.38)
2.84
(3.04)
Asset value
($)
9.99
(12.1)
11.59
$(14)
8.73
(10.15)
(10.21)
(12.24)
9.87
(12.0)
11.04
(12.5)
9.36
(11.9)
11.98
(15.0)
8.43
(9.20)
Age 31.65
(12.7)
32.46
(13.1)
31.00
(12.4)
29.55
(12.3)
32.84
(12.8)
28.89
(11.2)
30.22
(13.4)
34.98
(13.8
31.37
(11.9)
Sexual Events 0.79
(1.34)
0.43
(0.92)
0.95
(1.47)
1.29
(1.87)
0.64
(1.11)
0.00
(0.00)
1.36
(1.88)
0.45
(0.94)
0.77
(1.19)
Violent Events 6.23
(3.25)
6.69
(3.12)
5.84
(3.27)
6.93
(3.31)
5.83
(3.12)
6.99
(3.16)
6.89
(3.54)
6.52
(3.01)
5.36
(3.05)
Conflict and Health 2009, 3:6 />Page 9 of 16
(page number not for citation purposes)
Other common traumatic events included witnessing
beatings or torture (59.1%), witnessing combat (50.9%),
witnessing killing or murder (50.9%) and harassment by
armed personnel (48.7%). The percentages overlap as
most respondents experienced multiple traumatic events.
Sexual crimes appear to have been less important than
violent crimes in this population. Rape was reported by
4.2% of the respondents (both Somali and Rwandese),
sexual harassment by 6.0%, forced prostitution by 2.1%
(mainly Rwandese), forced circumcision by 4.1% (mainly
Somalis) and sex for food or security by 1.4%. Many more
had witnessed the same events happen to someone else,
however: rape (14.1%), forced prostitution (12.7%) and
forced circumcision (9.8%).
Of the 34 traumatic events on the Event List, 10 events
involved sexual violence. The mean number of sexual vio-
lence events reported was 0.79 (SD = 1.34), compared to
the mean number of the ten most reported violent events,
6.23 (SD = 3.25). Somali women reported the highest
number of sexually violent events (1.36, SD = 1.88),
although this was less than the number of violent events
they reported (M = 6.89, SD = 3.54). Somali men reported
the least number of sexually violent events (M = 0.00, SD
= 0.00), although they reported a high number of violent
events (M = 6.99, SD = 3.16). Somali women reported a
significantly higher number of traumatic sexually violent
events than Somali men (t(246) = 11.33; p < .000), and
than Rwandese women (t(339) = 4.5; p < .000), who also
reported a higher number of violent traumatic events (M
= 5.36, SD = 3.05) than sexually violent events (M = 0.77,
SD = 1.19).
Rwandese men also reported more non-sexual violent
traumatic events (6.52, SD = 3.01) than sexually violent
events (M = 0.45, SD = 0.94). Rwandese women had expe-
rienced significantly more sexually violent events (t(846)
= 4.46; p < .000) than the men. The difference in sexually
violent events reported by Somali and Rwandese men did
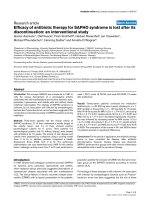
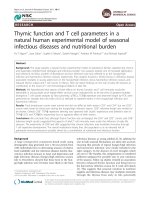
not reach significance. (A figure illustrating occurrence of
lifetime traumatic events is included at the end of the manu-
script: see Figure 1. A second figure depicting recent (within
the past year) traumatic events is included as Figure 2). The
Event List is included as a table at the end of the manuscript:
see Table 3).
As a measure of the internal validity of the data and the
diagnoses, correlations (Pearson) were carried out
between key indicators. For example, the PDS sum score,
referring to the total number of PTSD symptoms, corre-
lates significantly with the sum of arousal symptoms
(0.912); the sum of avoidance symptoms (0.933); the
sum of intrusion symptoms (0.922) as well as with the
sum of functioning deficits (0.657). It also correlates sig-
nificantly with the sum of anxiety symptoms (0.784), the
sum of depression symptoms (0.858) and the total
number of traumatic events (0.544).
It does not, however, correlate significantly with the
amount of addictive substances consumed (the drug sum
score) and only weakly with the sum of physical health
deficits, suggesting that physical ill-health in this popula-
tion is not predicted by mental ill-health alone.
In turn, the anxiety sum score correlates significantly with
the PTSD arousal (0.785), avoidance (0.699) and intru-
sion symptoms (0.697) and functioning loss (0.640). The
sum of depression symptoms also correlates significantly
with functioning loss (0.645), arousal (0.829), avoidance
(0.786) and intrusion symptoms (0.766).
(Correlations of key indicators are summarised as a table: see
Table 4).
Discussion
This refugee population is very poor, with individual pos-
sessions totalling less than ten dollars in worth. It is also
under-nourished, with individuals eating little over one
meal a day, containing no fish or meat. It is also a popu-
lation with little education and therefore few employment
prospects.
The refugees are also physically unhealthy, reporting at
least four separate physical complaints each within a one-
month period. This could be attributed partly to poor
nutrition, and partly to mental ill health, which often
manifests itself in psychosomatic symptoms.
It is conceivable that this is the profile of many refugee
populations in Africa. The value of this information is evi-
dent because conflicts continue to proliferate in Africa and
even more people are forced to migrate. For example,
Uganda is receiving an influx of thousands of new refu-
gees from the Congo. Such information is vital for plan-
ning emergency and other services in the host countries
[16].
Table 2: PTSD prevalence according to gender and nationality
Total Men Women
Camp (n = 538) 37.8% 42.7% 34%
Somali (n = 248) 48.1% 48.1% 48.1%
Rwandese (n = 290) 32% 38.9% 27.3%
Conflict and Health 2009, 3:6 />Page 10 of 16
(page number not for citation purposes)
The refugees had spent an average of over three years in
the refugee settlement, a place that did not guarantee
absolute safety.
The sample manifested a high traumatic load, with over
nine separate traumatic events each, including sexual
events. This is reflected in the high PTSD symptom load of
14 separate symptoms. The separate PTSD symptom clus-
ters, as well as anxiety and depression symptoms were also
high across the board. This contributed to the physically
run-down state of the refugees as well as to functioning
deficits. The refugees reported at least two such deficits on
the average. Such deficits include the inability to engage in
economically productive activities – which further com-
plicates an already precarious economic situation – as
well as the inability to benefit from educational opportu-
nities. Other functioning deficits include dysfunctional
marital and family life, and addictive substance abuse.
The rates of prevalence of PTSD within this refugee popu-
lation are consistent with findings from other post-con-
flict populations. Notably, the prevalence rates among the
Somali respondents were exceptionally high (half of the
population). The Somalis have experienced more trau-
matic events and are more vulnerable across all mental
health and nutrition variables, which could predispose
them to mental illness.
It is possible that this is an especially vulnerable sample of
the Somali refugees, possibly a self-select group that could
have been exposed to traumatic events of unusual number
and severity during numerous conflict situations and a
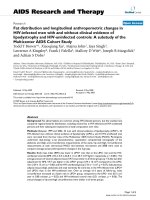
illustrates the occurrence of lifetime traumatic events by nationalityFigure 1
illustrates the occurrence of lifetime traumatic events by nationality.
Most frequently experienced traumatic
events
0.00% 20.00% 40.00% 60.00% 80.00% 100.00%
No. 25
No. 7
No. 31
No. 8
No. 9
No. 26
No. 27
No. 32
No. 30
No. 15
No. 23
No. 11
No. 20
No. 34
No. 4
No. 22
No. 10
No. 24
No. 2
Ev en t s
Percentage
Rw andese%
Somalis%
Camp total %
Conflict and Health 2009, 3:6 />Page 11 of 16
(page number not for citation purposes)
prolonged forced migration process. However, it is also
conceivable that Somali war survivors in general have had
an unusually high exposure to conflict-related events dur-
ing the long periods of repeated unrest. The Somali popu-
lation was also more vulnerable to recent traumatic events
that took place within the refugee settlement (in the past
year). That such events continue to take place shows that
such refuges do not offer absolute safety for refugees.
The researchers did not set out to establish construct valid-
ity of the PTSD construct within these cultural groups.
However, the significant correlations between various
health measures such as posttraumatic stress disorder
symptom sum score, depression and anxiety scores and
subsequent functioning deficits may indicate the validity
of the PTSD construct in these populations (see Table 4).
The researchers did seek to establish criterion validity and,
as mentioned before, the results are reported fully in [35].
Notably, the HSCL-25 in both languages had a low Kappa
score (0.31 when taken together). This indicates a defi-
ciency in the accuracy of the rendition of the HSCL-25
into the local languages Kinyarwanda and Somali, thus
limiting the reliability of the depression and anxiety meas-
ures.
Conclusion
As shown, post-conflict refugee populations relocated to
low-income countries in Africa may have high prevalence
of both PTSD and depression, which may persist years
after the causative experiences. It is therefore clear that
allocations for mental health provision are just as urgent
as any emergency material provisions made for forced
migrants – maybe even more so. This is also very impor-
tant information for third host countries, for example the
high-income countries to which the entire Somali sample
in this study was later resettled.
Provision of access to mental health interventions should
be taken into account by all agencies that offer relief to ref-
ugees and other migrant populations. As noted, mental
illness severely handicaps the functioning of sufferers
across a range of domains, reducing their capacity to
reconstruct their lives or build up progressive communi-
ties. Mental ill health also contributes to poor physical
health. As such, untreated mental illness carries an enor-
mous hidden economic cost that may hinder the recovery
of forced migrant populations. The identification and
treatment of different mental illnesses such as posttrau-
matic stress disorder and depression among post-conflict
populations is therefore a matter of urgency.
This group of researchers initiated a mental health inter-
vention program based on these findings. The main aim
of the program was to build capacity among local lay
interviewers and therapists, with a view to providing treat-
ment for posttraumatic stress disorder and depres-
sion[36].
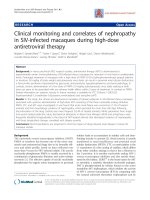
depicts the occurrence of recent (within the past year) traumatic events by nationalityFigure 2
depicts the occurrence of recent (within the past year) traumatic events by nationality.
Traum atic Events experienced most in the past
year
3.90%
3.50%
2.00%
1.80%
1.80%
1.80%
5%
2.13%
0.20%
3%
4%
3.68%
3.20%
4.30%
3%
1.30%
0.88%
0.66%
0.00% 1.00% 2.00% 3.00% 4.00% 5.00% 6.00%
N0. 26
N0. 9
N0. 17
N0. 20
N0. 4
N0. 30
Ev en t s
Percentage
Rw an dese%
Somali%
Camp total%
Conflict and Health 2009, 3:6 />Page 12 of 16
(page number not for citation purposes)
Table 3: Prevalence (%) of traumatic event types experienced ever (lifetime) and in the past year by nationality
Ever In the past year
Events n (%) Camp Total Somali Rwande Camp total Somali Rwande
1. Abduction or forceful recruitment 124 (8.7) 112 12 3 (0.2) 3 (0.2) 0
2. Accident 310 (21.8) 143 (27.7) 167 (18.4) 14 (1.0) 7 7
3. Beating by spouse (*for women) 111 (7.8) 18 93 19 (1.3) 2 17
4. Beating or torture 428 (30.1) 190 (36.8) 238 (26) 26 (1.8) 18 (3.5) 8 (0.1)
5. Child marriage 58 (4.1) 23 35 0 0 0
6. Combat situation 33 (2.3) 4 29 1 (0.1) 0 1
7. Shelling/bomb attack 985 (69.3) 341 (66.1) 644 (71.1) 16 (1.1) 4 12
8. Experienced crossfire or sniper attack 857 (60.3) 315 (61) 542 (59.8) 9 (0.6) 5 4
9. Experienced burning houses 856 (60.2) 348 (67.4) 508 (56) 50 (3.5) 11 (2.1) 39 (4.3)
10. Property confiscated by officials 415 (29.2) 107 (20.7) 308 (34) 7 (0.5) 3 4
11. Dangerous evacuation 522 (36.7) 314 (60.9) 208 (23) 5 (0.4) 5 0
12. Injured with weapon 230 (16.2) 156 74 4 (0.3) 4 0
13. Forced circumcision *(for women) 59 (4.1) 50 9 1 (0.1) 1 0
14. Forced prostitution or sexual slavery 30 (2.1) 3 27 0 0 0
15. Harrassed by armed personnel 692 (48.7) 216 (41.9) 476 (52.5) 19 (1.3) 14 5
16. Imprisoned 221 (15.5) 65 156 15 (1.1) 9 6
Conflict and Health 2009, 3:6 />Page 13 of 16
(page number not for citation purposes)
17. Experienced poisoning or witchcraft 246 (17.3) 12 234 28 (2.0) 1 (0.2) 27 (3)
18. Rape 60 (4.2) 34 26 7 (0.5) 1 6
19. Sexual harassment (touch) 85 (6.0) 29 56 10 (0.7) 5 5
20. Experienced robbery or looting 468 (32.9) 331 (64.1) 137 (15.1) 25 (1.8) 13 (2.5) 12 (1.3)
21. Sex for food/security 20 (1.4) 6 14 0 0 0
22. Witnessed abduction or forced recruitment 422 (29.7) 252 (48.8) 170 (18.8) 5 (0.4) 4 1
23. Witnessed accident 542 (38.1) 150 (29.1) 392 (43.3) 20 (1.4) 6 14
24. Witnessed suicide 395 (27.8) 50 (9.7) 345 (38.1) 13 (0.9) 10 3
25. Witnessed dead or mutilated bodies 1045 (73.5) 401(77.7) 644(71.1) 16 (1.1) 11 5
26. Witnessed beatings or torture 841 (59.1) 293 (56.8) 548 (60.5) 55 (3.9) 26 (5) 29 (3.2)
27. Witnessed combat s 724 (50.9) 402 (77.9) 322 (62.4) 8 (0.6) 8 0
28. Witnessed forced circumcision 139 (9.8) 116 23 15 (1.1) 14 1
29. Witnessed forced prostitution 180 (12.7) 56 124 10 (0.7) 8 2
30. Witnessed harassment by armed personnel 721 (50.7) 236 (45.7) 485 (53.5) 25 (1.8) 19 (3.7) 6 (0.7)
31. Witnessed injury with weapon 963 (67.7) 421 (81.6) 542 (59.8) 13 (0.9) 9 4
32. Witnessed killing or murder 724 (50.9) 369 (71.5) 355 (39.2) 7 (0.5) 6 1
33. Witnessed rape 201 (14.1) 106 95 12 (0.8) 6 6
34. Witnessed robbery/looting 459 (32.3) 296 (57.4) 163 (18) 11 (0.8) 8 3
Table 3: Prevalence (%) of traumatic event types experienced ever (lifetime) and in the past year by nationality (Continued)
Conflict and Health 2009, 3:6 />Page 14 of 16
(page number not for citation purposes)
Table 4: Pearson's Correlation between key health variables.
Indicator Statistic Func sum Drug sum PDS sum Arou sum Avoi sum Intru sum Hscl anxs Hscl deps No. of
events
Heal sum
Function Sum
score
Pear.Cor 1 .064 .657 .583 .625 .592 .640 645 .455 .232
Sig(2) . .133 .000 .000 .000 .000 .000 .000 .000 .000
N 560 550 560 560 560 560 555 555 555 560
Drug Sum
score
Pear.Cor .064 1 .022 .007 .023 .028 .002 027 .049 034
Sig.(2) .133 . .408 .790 .380 .239 .950 .319 .068 .002
N 550 1401 1401 1401 1401 1401 1393 1393 1395 1401
PDS Sum
score
Pear.Cor .657 .022 1 .912 .933 .922 .784 .858 .544 .362
Sig.(2) .000 .408 . .000 .000 .000 .000 .000 .000 .000
N 560 1401 1421 1421 1421 1421 1413 1413 1414 1421
Arousal Sum
score
Pear.Cor .583 .007 .912 1 .776 .781 .785 .829 .503 .366
Sig.(2) .000 .790 .000 . .000 .000 .000 .000 .000 .000
N 560 1401 1421 1421 1421 1421 1413 1413 1414 1421
Avoidance
Sum score
Pear.Cor .625 .023 .933 .776 1 .774 .699 .786 .476 .315
Sig (2) .000 .380 .000 .000 . .000 .000 .000 .000 .000
N 560 1401 1421 1421 1421 1421 1413 1413 1414 1421
Intrusion
Sum score
Pear.Cor .592 .028 .922 .781 .774 1 .697 .766 .532 .329
Sig.(2) .000 .289 .000 .000 .000 . .000 .000 .000 .000
N 560 1401 1421 1421 1421 1421 1413 1413 1414 1421
HSCL
Anxiety Sum
score
Pear.Cor .640 .002 .784 .785 .699 .697 1 .776 .511 .467
Sig.(2) .000 .950 .000 .000 .000 .000 . .000 .000 .000
N 555 1393 1413 1413 1413 1413 1413 1413 1406 1413
HSCL
Depression
Sum score
Pear.Cor .645 027 .858 .829 .786 .766 .776 1 .526 .333
Sig.(2) .000 .319 .000 .000 .000 .000 .000 . .000 .000
N 555 1393 1413 1413 1413 1413 1413 1413 1406 1413
Total No. of
Event types
Pear.Cor .455 .049 .544 .503 .476 .532 .511 .526 1 .254
Sig.(2) .000 .068 .000 .000 .000 .000 .000 .000 . .000
N 555 1395 1414 1414 1414 1414 1406 1406 1414 1414
Health Sum
score
Pear.Cor .232 034 .362 .366 .315 .329 .467 .333 .254 1
Sig. (2) .000 .200 .000 .000 .000 .000 .000 .000 .000 .
N 560 1401 1421 1421 1421 1421 1413 1413 1414 1422
Correlation is significant at the 0.01 level (2-tailed).
Conflict and Health 2009, 3:6 />Page 15 of 16
(page number not for citation purposes)
Limitations
Although no effort was spared to make this study as com-
prehensive as possible, the study manifests some limita-
tions. Firstly, the CIDI was used as a criterion for
validation of the PDS in the local languages. However, the
CIDI had not been validated for this setting, and it is not
exclusively a clinician-administered diagnostic interview,
thus limiting its validity as a criterion.
Secondly, it would have been informative to have data
from the host Ugandan population – for example regard-
ing income or physical and mental health indicators – for
purposes of comparison, which is not the case. This could
be improved on in future studies.
Competing interests
The authors declare that they have no competing interests.
Authors' contributions
LPO drafted the manuscript, managed and participated in
the data collection and was involved in data analysis and
interpretation.
TE and FN conceived and designed the study, participated
in data collection, guided data analysis and interpretation
and critically revised the document before submission. VE
participated in data collection and was involved in data
management, analysis and interpretation.
ES and MO participated in data collection and interpreta-
tion.
Additional material
Acknowledgements
We gratefully acknowledge all of our local interviewers who made this
project possible through hard work and great enthusiasm, particularly: Jan-
uary Ntahondereye, Abdulkarim, Lamech Wasswa, Mohammed Farah
Mohammed, Hinda Mohammed, Elias Noor, Ahmed Mohammed Abdi,
Mohammed Abdi and Adan Shale.
Stimulating discussions with Prof. Dr. Brigitte Rockstroh (vivo Interna-
tional) and Dr. Unni Karunakara (Medecins Sans Frontiere) were essential.
We also appreciate the assistance of Mercy Onyut from vivo Uganda and
Martie Hoogeven. We are grateful for the warm reception and support by
the refugee community of Nakivale camp and the full support granted by
the Government of Uganda. Work was supported by the Deutsche Forsc-
hungsgemeinschaft (to Prof. Dr. Thomas Elbert & Prof. Dr. Frank Neuner),
a grant from the German Bundesministerium für Zusammenarbeit (to Prof.
Dr. Thomas Elbert & Dr. Lamaro P. Onyut), the Deutsche Akademische
Austausch Dienst (to Dr. Lamaro P. Onyut) and vivo international.
References
1. Kessler RC, Sonnega A, Bromet E, Hughes M, Nelson CB: Posttrau-
matic stress disorder in the National Comorbidity Survey.
Arch Gen Psychiatry 1995, 52:1048-60.
2. Darves-Bornoz J-M, Alonso J, Girolamo de G, Graaf de R, Haro J-M,
Kovess-Masfety V, Lepine J-P, Nachbaur G, Negre-Pages L, Vilagut G,
Gasquet I: Main traumatic events in Europe: PTSD in the
European study of the epidemiology of mental disorders sur-
vey. Journal of Traumatic Stress 2008, 21:455-462.
3. Gabriel R, Ferrando L, Corton ES, Mingote C, Garcia-Camba E, Liria
AF, Galea S: Psychopathological consequences after a terror-
ist attack: An epidemiological study among victims, the gen-
eral population and police officers. European Psychiatry 2006,
22:339-346.
4. Vasconcelos P: Flooding in Europe: a brief review of the health
risks. Euro Surveill 2006, 11(4):E060420.2.
5. Perkonigg A, Kessler RC, Storz S, Wittchen HU: Traumatic events
and posttraumatic stress disorder in the community:preva-
lence, risk factors and comorbidity. Acta psychiatrica scandinavica
2000, 101:46-59.
6. Perkonigg A, Wittchen HU: Prevalence and Comorbidity of
Traumatic Events and Posttraumatic Stress Disorder in
Adolescents and Young Adults. In Post-Traumatic Stress Disorder:
A Lifespan Developmental Perspective Edited by: Maercker A, Schut-
zwohl M, Solomon Z. Seattle: Hogrefe & Huber Publishers; 1999.
7. Kinzie JD, Boehnlein JK, Leung PK, Moore LJ, Riley C, Smith D: The
prevalence of posttraumatic stress disorder and its clinical
significance among Southeast Asian refugees. Am J Psychiatry
1990, 147:913-7.
8. Ai AL, Peterson C, Ubelhor D: War-Related Trauma and Symp-
toms of Posttraumatic Stress Disorder Among Adult Koso-
var Refugees. J Trauma Stress 2002, 15:157-160.
9. Marshall GN, Schell TL, Elliott MN, Berthold SM, Chun C: Mental
Health of Cambodian Refugees 2 Decades After Resettle-
ment in the United States. JAMA 2005, 294(5):571-579.
10. Weine SM, Becker DF, McGlashan TH, Laub D, Lazrove S, Vojvoda
D, Hyman L: Psychiatric consequences of 'ethnic cleansing':
clinical assessments and trauma testimonies of newly reset-
tled Bosnian refugees. Am J Psychiatry 1995, 152:536-542.
11. Momartin S, Silove D, Manicavasagar V, Steel Z: Range and Dimen-
sions of Trauma Experienced by Bosnian Refugees Resettled
in Australia. Australian Psychologist 2002, 37:149-155.
12. Fazel M, Wheeler J, Danesh J: Prevalence of serious mental dis-
order in 7000 refugees resettled in western countries: a sys-
tematic review. Lancet 2005, 365:1309-14.
13. Mollica R, McInnes K, Sarajlic N, Lavelle J, Sarajlic I, Massagli MP: Dis-
ability Associated With Psychiatric Comorbidity and Health
Status in Bosnian Refugees Living in Croatia. JAMA 1999,
282:433-439.
14. Naeem F, Mufti KA, Aub M, Harioon A, Saifi F, Dagawal S, Kingdon D:
Psychiatric Morbidity among Afghan Refugess in Peshawar,
Pakistan. J Ayub Med Coll Abbottabad. 2005, 17(2):23-25.
15. Terheggen MA, Stroebe MS, Kleber RJ: Western Conceptualiza-
tions and Eastern Experience: A Cross-Cultural Study of
traumatic Stress Reactions Among Tibetan Refugees in
India. J Trauma Stress 2001, 14:391-403.
16. UNHCR: 2007 Global Trends: Refugees, Asylum-seekers,
Returnees, Internally Displaced and Stateless Persons. In
Book 2007 Global Trends: Refugees, Asylum-seekers, Returnees, Internally
Displaced and Stateless Persons (Editor ed.^eds.), vol. 2008 City:
UNHCR; 2007.
17. de Jong JT, Komproe IH, Van Ommeren M: Common mental dis-
orders in postconflict settings. Lancet 2003, 361:2128-30.
18. Pham PN, Weinstein HM, Longman T: Trauma and PTSD symp-
toms in Rwanda: implications for attitudes toward justice
and reconciliation. JAMA 2004, 292:602-12.
19. Dyregrov A, Gupta L, Gjestad R, Mukanoheli E: Trauma exposure
and psychological reactions to genocide among Rwandan
children. J Trauma Stress 2000, 13:3-21.
Additional file 1
Table showing independent t-test values across gender and nationality
for key indicators. The data provided represents the statistical analysis of
t-test values for various variables across gender and nationality.
Click here for file
[ />1505-3-6-S1.pdf]
Publish with BioMed Central and every
scientist can read your work free of charge
"BioMed Central will be the most significant development for
disseminating the results of biomedical research in our lifetime."
Sir Paul Nurse, Cancer Research UK
Your research papers will be:
available free of charge to the entire biomedical community
peer reviewed and published immediately upon acceptance
cited in PubMed and archived on PubMed Central
yours — you keep the copyright
Submit your manuscript here:
/>BioMedcentral
Conflict and Health 2009, 3:6 />Page 16 of 16
(page number not for citation purposes)
20. Schaal S, Elbert T: Ten years after the genocide: trauma con-
frontation and posttraumatic in Rwandan adolescents. J
Trauma Stress 2006, 19:95-105.
21. Neuner F, Schauer M, Karunakara U, Klaschik C, Robert C, Elbert T:
Psychological trauma and evidence for enhanced vulnerabil-
ity for posttraumatic stress disorder through previous
trauma among West Nile refugees. BMC Psychiatry 2004, 4:34.
22. Karunakara U, Neuner F, Schauer M, Singh K, Hill K, Elbert T, Burn-
han G: Experience of traumatic events and symptoms of post-
traumatic stress disorder in Sudanese forced migrant and
Ugandan populations of West Nile. African Health Sciences 2004,
4(2):83-93.
23. Mollica R, Caspi-Yavin Y, Bollini P, Truong T, Tor S, Lavelle J: The
Havard Trauma Questionnaire. Validating a cross-cultural
instrument for measuring torture, trauma and posttrau-
matic stress disorder in Indochinese refugees. Journal of Nerv-
ous and Mental Disorders 1992, 180:111-6.
24. Ali TM, Matthews RO: Civil Wars in Africa: Roots and Resolu-
tion. Montreal: McGill-Queen's University Press; 1999.
25. De Quervain DJF, Kolassa IT, Ertl V, Lamaro Onyut P, Neuner F,
Elbert T, Papassotiropoulos A: A deletion variant of the 2b-
adrenoceptor is related to emotional memory in Europeans
and Africans. Nature Neuroscience 2007, 10(9):1137-9. Epub 2007
Jul 29
26. Neuner F, Schauer M, Klaschik C, Karunakara U, Elbert T: A com-
parison of narrative exposure therapy, supportive coun-
seling, and psychoeducation for treating posttraumatic
stress disorder in an african refugee settlement. J Consult Clin
Psychol 2004, 72:579-87.
27. Foa EB: Posttraumatic Stress Diagnostic Scale (Manual). Min-
neapolis, MN: National Computer Systems; 1995.
28. Weathers FW, Keane TM: Psychological Assessment of Trau-
matized Adults. In Posttraumatic Stress Disorder: A Comprehensive
Text Edited by: Saigh PA, Bremner JD. Needham Heights: Allyn &
Bacon; 1999.
29. Ertl V: Reliabilität und Validät der Erfassung Posttrauma-
tischer Belastungsstörung in einer ostafrikanischen
Flüchtlingssiedlung. Diploma thesis published online by the Uni-
versitz of Konstanz; 2005.
30. WHO: Composite International Diagnostic Interview (CIDI).
Geneva: World Health Organisation; 1997.
31. Derogatis LR, Lipman RS, Rickels K, Uhlenhuth EH, Covi L: The
Hopkins Symptom Checklist (HSCL): A self-report Symp-
tom Inventory. Behavioural Science 1974:1-15.
32. Frojdh K, Hakansson A, Karlsson I: The Hopkins Symptom
Checklist-25 is a sensitive case-finder of clinically important
depressive states in elderly people in primary care. Int J Geriatr
Psychiatry 2004, 19:386-90.
33. Onyut LP, Neuner F, Schauer E, Ertl V, Odenwald M, Schauer M,
Elbert T: The Nakivale Camp Mental Health Project: Building
local competency for psychological assistance to trauma-
tised refugees. Intervention International Journal of Mental Health, Psy-
chosocial Work and Counselling in Areas of Armed Conflict 2004,
2:90-108.
34. Bolton P, Ndogoni L: Cross-Cultural Assessment of Trauma-
related mental Illness Phase II: A Report of research Con-
ducted by World Vision Uganda and The Johns Hopkins Uni-
versity. In Book Cross-Cultural Assessment of Trauma-related mental
Illness Phase II: A Report of research Conducted by World Vision Uganda
and The Johns Hopkins University (Editor ed.^eds.) City: The Johns Hop-
kins University; 2001.
35. Ertl V: Validierung westlicher Konzepte zur Erfassung psy-
chischen Leids in Afrika. Reliabilität und Validität der Erfas-
sung posttraumatischer Belastungsstörung in einer
ostafrikanischen Flüchtlingssiedlung. Saarbrücken: VDM Verlag
Dr. Müller; 2008.
36. Neuner F, Onyut LP, Ertl V, Odenwald M, Schauer E, Elbert T: Treat-
ment of Posttraumatic Stress Disorder by Trained Lay
Counselors in an African Refugee Settlement: A Rand-
omized Controlled Trial. Journal of Consulting and Clinical Psychol-
ogy 2008, 76:686-694.