Báo cáo y học: "On the threshold - evaluation of variability in effects of acupuncture in a gender perspective" doc
Bạn đang xem bản rút gọn của tài liệu. Xem và tải ngay bản đầy đủ của tài liệu tại đây (894.97 KB, 10 trang )
COMM E N T ARY Open Access
On the threshold - evaluation of variability in
effects of acupuncture in a gender perspective
Iréne Lund
1*
, Thomas Lundeberg
2
Abstract
Variable results of pain alleviation in response to acupuncture have been reported, complicating its interpretation.
Sources of variability are probably multi-factorial, including the contribution of gender related effects. Gender
related variation in perceived pain has been discussed frequently, but documented effects of acupuncture referring
to gender are sparse. Furthermore, factors such as operationa lisation of the outcome variable and the statistical
method for evaluation could also be sources of variability. When pain is regarded as subjective, the produced data
should be treated as ordinal. The rank-based method by Svensson, taking the non-metric qualities of the ordinal
data into account as well as the variability at the group and the individual level, is therefore an alternative. The
present commentary aims to (1) evaluate changes in electrical sensory thresholds and electrical pain thresholds
after low frequency electro-acupuncture separately in healthy women and men; (2) introduce and exemplify the
method by Svensson in a user-friendly approach. To analyze the systematic patterns of change in thresholds, indi-
cating evidence of treatment on a group level, the relative position (RP) and relative concentration (RC), were mea-
sured. The variation related to the individual, the relative rank variation (RV) was also measured. The results were
divergent between women (n = 23) and men (n = 22), i.e. unchanged sensory threshold after acupuncture at the
group level in women while changed in men. The assessed pain threshold after acupuncture on the other hand
was changed towards higher levels in women and unchanged in men. The individual variation was apparent in
both women and men but larger in women. For statistical analysis of the variability for both group and individual
related effects, the rank-based method by Svensson could be used. The present study indicates that evaluation of
sensory and pain threshold response should be analysed separately in women and men.
Introduction
Some clinical trials that compared acupuncture with no
treatment or other treatment modalities have been
reported [1-6]. However, variability in the study results
[7,8] makes the interpretation difficult [9-11]. Some posi-
tive results were mistakenly attributed to placebo [12].
Variability in acupuncture treatments of pain is multi-
factorial, such as clinical conditions, treatment strate-
gies, study designs, outcome variables, instrument used
and gender. Gender differences in pain evaluation have
been discussed [13] but documentation of gender
related responses to acupuncture is scarce. Possible gen-
der differences in response to transcutaneous electrical
nerve stimulation (TENS) and vibration have been
discussed [14,15].
The method used for statistical analysis, based on the
operationalisation o f the outcome variable like assessed
pain intensity and its indicators, is i mportant for the
interpretation of the final results [16]. Pain is a complex,
subjective and personal experience [17] with uncertain
proportionality to nociception. Therefore, evaluation of
perceived pain is based on self-reports using specific
scales, questionnaires or instruments based on the
psychophy sical methodologies such as perceived thresh-
olds for sensation and pain [18]. As pain is subjective,
the data of pain have non-metric ordinal properties. The
ordinal data do not indicat e the magnitude and distance
between categories of the assessment instrument
[19,20]. Hence, statements such as ‘twice as much’ on a
pain rating scale and percentage change are inappropri-
ate [16]. However, it is still co ntroversial whether sub-
jective variables such as pain are equi distant with linear
(metric) properties [21] and will have implications for
* Correspondence:
1
Department of Physiology and Pharmacology, Karolinska Institutet,
Stockholm, Sweden
Full list of author information is available at the end of the article
Lund and Lundeberg Chinese Medicine 2010, 5:32
/>© 2010 Lund and Lundeberg; licensee BioMed Central Ltd . This is an Open Access article distributed under the terms of the Creative
Commons Attribution License ( .0), which permits unrestricted use, distribution , and
reproduction in any medium, provided the original work is properly cited.
the evidence based decisions a nd choice o f recommen-
dations of pain treatment.
A quit e recently developed statistical method, suitable
for data from scale assessments with only the order
known, could be used be used to evaluate changes,
inter- and intra-observer agreements [22,23]. The
method takes the non-metric properties of the ordinal
data into account without pre-defined assumption of
distribution of the data other than the ordered structure,
and is applicable to the raw data as it does not matter if
they have linear, ordinal or dichotomy properties. Thus
the results are valid and reliable for all types of ordered
data even in small samples. Furthermore, the method
gives the possibility of evaluating individually related
changes separately from the systematic group related
changes. When the objective of a study is evaluation of
change, the interpretation of the systematic changes
linked to the group effects gives support for evidence of
the treatment, while the measure of individual variability
illustrates the range of individual response.
Threshold assessment study
In order to demonstrate how ordinal data can be ana-
lysed at both group and individual levels, we used an
example t o illustrate the changes of assessed thresholds
in response to electro-acupuncture in participants of
both genders.
Participants
Students at the Karolinska Institutet who reported to be
healthy participated in the study after their informed
consent. The stu dy protocol was approved by the Ethics
Committee of Karolinska Hospital (dnr 01-169).
Assessment
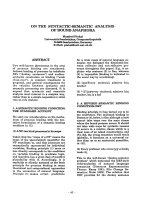
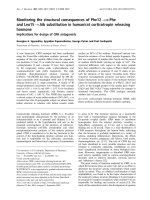
Pai nMatcher instrument (Pain-Matcher®, Cefa r Compex
AB, Sweden) [24,25] was used for threshold assessments
(Figure 1). The instrument produced electrocutaneous
sti mula tion with constant (15 mA) current through two
electrodes at a frequency of 10 Hz compensated for var-
iationsinskinresistanceupto13kΩ. The stimulation
intensity increased along with the increase of the pulse
duration in increments of 4 μs in a total of 99 steps
(4 μs-396 μs). The subject released the fingers from the
electrodes when the intended threshold was perceived.
The assessed e lectrical sensory threshold (EST, i.e. the
least perceived stimulation described as a paresthesia-
like sensation) and the electrical pain threshold (EPT,
i.e. the leas t stimulation leading to the first perception
of pain distinct from unpleasantn ess) were recorded.
The threshold assessments were guaranteed not to
causetissuedamageatanylevel.Theinstrumentwas
tested 3-4 times with all subjects sitting in a relaxed
position for 10 minutes before the actual experiment.
Electro-acupuncture
Low frequency electro-acupuncture, EA, (2 Hz) was used
(Acus 1, Cefar Compex AB, Sweden) with distributed
current in alternating pulses (180 μs, 0-12 mA). The elec-
trodes were applied to the sterile disposable needles
(30 mm×0.30 mm, Hegu Xeno, Hegu Svenska AB®,
Sweden) placed at the acupoints ST36 and ST38 after
deqi sensation was elicited. A cupoints ST36 and ST38
were selected because they are distant from the hand
with minimal ‘ spinal segmental effects’ . The current
amplitude was increased until muscle contractions were
seen and adjusted to below the level of perceived unplea-
santness throughout the stimulation period of 20 min-
utes. Four thresh old assessments were pe rformed: (1)
before EA, (2) during EA, (3) after EA for 20 minutes and
(4) 10 minutes after ended EA.
Statistical analysis
The age of the participants was presented as mean and
standard deviation (SD). The data of the assessed EST
and EPT were ordinal and hence presented as the med-
ian, range and interquartile range (IQR) of the PM
values.
The pat tern of changes in the paired data of EST and
EPT, before and ten minutes after EA, were shown in
square contingency tables, and in scatter plots respec-
tively. The main diagonals in the contingency tables,
consisting of grey-shaded cells, and of dotted lines in
the scatter plots, indicates no chan ge in the respective
threshold from the one occasion to the other. The pro-
portions of participants with increased, unchanged and
decreased thresholds values after versus before EA were
calculated, as were the 95% confidence intervals (95%
CI), in proportions of changed threshold levels between
the two independent groups of women and men. The
hypotheses of no change in assessed EST and EPT com-
paring values before and after EA were analyzed by the
non-parametric sign test. For a further and more
Figure 1 The PainMatcher instrument used for assessments of
EST and EPT.
Lund and Lundeberg Chinese Medicine 2010, 5:32
/>Page 2 of 10
detailed evaluation of the variability (both s ystematic
and individual change s) of EST and EPT levels, we used
the rank-based statistical analysis method by Svensson
[23,26,27]. Its principal formulae are given below and
are further on demonstrated within the calculations of
applied data from the women’s EST before versus after
EA P-values l ess than 0.0 5 were considered statistically
significant.
STATISTICA 8.0 (StatSoft® Scandinavia AB, Sweden)
was used for descriptive statistics and analysis with the
Sign test. For calculation of confidence interval of pro-
portional change in the two groups t he Computer soft-
ware for Confidence Interval Analysis (CIA) [28] was
used and for calculation of with the Svensson method
its free software [27] was used.
Description of rank-based statistical method by
Svensson
Systematic variability and heterogeneity
A systematic change, related to the group, appears as
different marginal frequency distributions, heterogeneity,
of the assessmen ts seen in the contingency tables and
plots (Figure 2a-b). Two types of systematic change in
position and concentration in the two sets of paired
data are calculated, the relative positio n (RP) and the
relative concentration (RC). The measure of RP is calcu-
lated as the difference between the estimated probabil-
ities of the marginal distributions before EA (X) being
shifted towards decreased and towards increased values
relative to the marginal frequency distributions after EA
(Y), P(X < Y)-P(Y < X).
In the formulae below the number of indi viduals is
denoted n and the number of categories of the scale is
denoted m, then
RP
where and
=−
=•
[]
=•
−
=
∑
pp
p
n
yCX p
n
xCY
xy yx
xy i
i
m
yx
1
2
1
2
11
1
1
() ())
i
i
m
−
=
[]
∑
1
1
(1)
The RC is calculated as the difference between the
probabilities of the assessed threshold values being more
concentrated to the central PM values between 1 to 99
than to the peripheral parts of the possible PM values
after EA than before EA and vice versa P (X
1
<Y
k
<X
0
)-
P(Y
1
<X
k
<Y
0
)
then
RC
i
=•−
[]
−• −
[]
{}
−
=
∑
1
3
1
1
Mn
yCX nCX xCYnCY
iii i
i
m
() () () ()
(2)
where M = minimum value of (p
xy
- p
xy
2
)and(p
yx
-
p
yx
2
) provided 0 < (p
xy
and p
yx
)<1
PossiblevaluesofRPandRCrangefrom-1to1.A
positive RP value indicates increased thresholds on the
second occasion and the contrary holds for a negative
RP value. A positive value of RC indicates that the
assessed values are more concentrated towards the cen-
tral parts of the scale on the second occasion than the
first, while negative RC values reflects an adjustment
towards the ends of the scale.
The presence of systematic change is graphically illu-
strated with plotting the two sets of cumulative relative
proportions of the marginal frequency distributions in
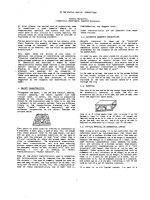
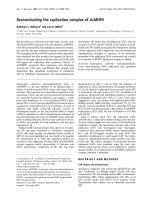
Figure 2 Contingency tables of paired EST assessments in a) healthy women (n = 22) and b) healthy men (n = 21), before EA, X, and
after EA, Y. Freq = Frequency of recorded PM values, marginal frequencies, before EA and after EA; CF = Cumulative frequency of the marginal
frequencies before and after EA (C(X)i; C(Y)i); CRF = Cumulative relative frequencies.
Lund and Lundeberg Chinese Medicine 2010, 5:32
/>Page 3 of 10
the contingency tables against each other in a sort of a
relative op erating characteristic (ROC) curve starting at
the (0,0) point with a main diagonal representing no
change (Figure 3a-b). A non-zero RP value means that
the ROC curve deviates from the diagonal indicating the
presence of a systematic change. In this case a positive
RP is evident by a ROC curve deviating below the main
diagonal. A systematic change of concentration is char-
acterized by an S-shaped ROC-curve indicating that one
set of the assessments is concentrated to a certain part,
central or peripheral, of the scale compared to the other
set. A lack of systematic change is indicated by the ROC
curve close to main diagonal. In this case, the evaluation
of the systematic changes reflects the treatment efficacy
on the entire group.
Individual variation
A presence of individual variation in the pattern of
change, not explained by a systemati c change, is evident
from pairs of observations in the contingency tables of
EST or in the scatter plots of the EPT data when dis-
persed from the expected pattern of change. To estimate
the contribution of the individual variation to the pat-
tern of change, firstly an augmented mean rank proce-
dure is used. The augmented ranking is defined b y the
observations in the (i, j)
th
cell of the contingency table
according to values before EA (X) as
Rxxx
ij
X
kl il ij
l
j
l
m
k
i
()
()=+++
=
−
==
−
∑∑∑
1
2
1
1
1
11
1
(3)
for 1 ≤ i, j≤ m where the x
ij
is the ij
th
cell frequency.
The corresponding augmented mean ranks according to
values after EA, Y,
R
ij
Y()
were similarly defined. The
squared augmented mean rank differences define the
measure of the individual part of in the pattern of
change and is denoted the relative rank variance,
RV =
==
∑∑
6
3
11
2
n
xR
ij
j
m
i
m
ij
Δ
(4)
The measure of RV ranges from 0 to 1. The higher
the values of RV, the more dispersed are the observa-
tions from t he expected pattern of change [23]. Strong
evidences of additional individual changes, high RV
values, indicate that individua lly designed interven tions
like acupuncture would be preferable.
Findings of the threshold assessment study
A total of 23 women aged 27.7 (6.4) years and 22 men
aged 28.6 (6.5) participated in the study. All subjects
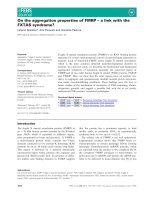
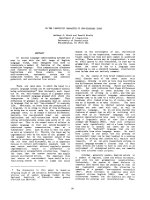
Figure 3 ROC curves demonstrating the cumulative relative frequencies of EST before and after EA in a) women, n = 22, EST ranging
from 1 to 7, and in b) men, n = 21, EST ranging from 1 to 8. From the ROC curve in Figure 3a it appears that the EST was assessed 4 in
86% of the women before EA and in 77% of the 22 women after EA. It is also obvious that the median EST was 3 (50% of the 22 women) both
before and after EA. The ROC is nearly close to the main diagonal indicating that there was no systematic change among the women in the
assessed EST before compared to after EA. The ROC curve in Figure 3b indicates systematic change both in position and concentration in
assessed EST among the men.
Lund and Lundeberg Chinese Medicine 2010, 5:32
/>Page 4 of 10
fulfilled the protocol with one women and one man fail-
ing to report the EST results.
Change of EST
The median EST was reported by the women as 3
(range 1-6; IQR 1) before and 3 (range 1-7; IQR 1) after
EA respectively. EST increase was reported by 5 (23%)
of t he 22 women, unchanged by 11 (50%) and a
decreased EST by the remaining 6 (27%) women.
The assessed median EST in the men were 5 (range 2-
7; IQR 2) before and 6 (range 3-8; IQR 2) after EA
respectively. EST increase was reported by 13 (62%) of
the 21 men, unchanged by 4 (19%) and decreased by 4
(19%). The difference in proportions in women and men
who reported EST increase was -39% (95%CI, -23% to
-62%), i.e. a greater EST increase was reporte d by the
men than the women after EA.
The pattern of change in EST, shown as the frequency
of the reported PM values in the contingency tables, is
denoted X before and denoted Y after EA (Figure 2a-b).
The grey shaded diagonal cells in the contingency tables
represent unchanged EST. Figure 2a shows that one
woman reported a PM value of 1 as her EST before and
after the EA. Similarly, five women reported PM value
as 3 before and after and another five women reported
their unchanged PM value as 4 before and after EA.
Applying the Svensson method
Systematic, group related, changes
The evaluation of possible sys tematic changes is b ased
on the heterogene ity of marginal frequency dis tributions
from the pairs of assessments before and after EA (X
i
,
Y
i
) respectively. Let x
i
and y
i
denote the frequencies of
the i
th
PM values of the individuals and C(X)i and C(Y)i
denote the cumulative frequencies of the i
th
PM value of
the two sets of marginal frequency distributions, X and
Y. First the measure of systematic change in position,
denoted relative position (RP) was calculated according
to the formula (1) in the statistical section
RP where
and
=−
=•
[]
=•
−
=
∑
pp
p
n
yCX p
n
xCY
xy yx
xy i
i
m
yx
1
2
1
2
11
1
1
() ())
i
i
m
−
=
[]
∑
1
1
Applied t o the distribution of marginal frequencies of
the EST data reported by the women in Figure 2a and
Table 1,
p
xy
=×+×+×+×+×+×
[]
=
1
22
2
1 1 9 1 6 11 4 19 0 21 1 22 0 360.;
and
p
yx
=×+×+×+×+×+×
[]
=
1
22
2
0 1 10 2 8 11 2 17 1 21 0 21 0 337.;
RP = 0.023.
Using the same pair of data the evaluation of the
othertypeofsystematicchangeinEST,wecalculated
relative concentration (RC) with formula (2), i.e.
RC
i
=ו−
[]
−• −
[]
{}
−
=
∑
1
3
1
1
Mn
yCX nCX xCYnCY
iii i
i
m
() () () ()
where M = minimum value of (p
xy
- p
xy
2
)and(p
yx
-
p
yx
2
) provided 0 < (p
xy
and p
yx
)<1
Correspondingly,
RC 1 1 21 9 1 11 6 11 3 4 19 1 21 1 22=
⋅
××× +×× +× ×+× ×+× ×+× ×−
1
0 223 22
3
00 0
0
.
(
××× + × × + × ×+ × ×+× ×+ × ×
=
−
12 1 211 8115 21711211 21
RC
00 0 0
394 715
022
);
.
3322
3
0 135
⋅
=− .
The RP value was small, 0.02 and c lose to zero while
there was a certain change in concentration, RC-0.14,
towards the peripheral ends of the scale categories used.
However, no evidence of significant systematic c hanges
in assessed EST was found in the applied example; RP
(95%CI, -0.24 to 0.29) and RC -0.14 (95%CI, -0.30 to
0.03) since the confidence interval in both cases did
cover the zero in the calculated systematic changes.
The corresponding results of assessed EST in the
group of men were RP 0.20 (95%CI, 0.02 to 0 .38) and
RC -0.31 (95%CI, -0.59 to -0.03), indicating a systematic
change towards higher EST and a spread of the PM
values towards the end o f the scale after EA as com-
paredwithbeforeEA.ThesystematicchangeofESTin
position among the men, RP 0.20, indicates a 20%
greater chance that t he EST is judged higher after EA
compared with before as t he opposite in a similar sam-
ple of healthy men. Correspondingly, the RC -31 indi-
cates a 31% greater chance that the PM values of
assessed EST among the men will be concentrated to
the peripheral part of the scale after EA.
The values of RP and RC close to zero indicate a lack
of systematic changes for the group and produced a
ROC curve close to the main diagonal as shown in
Figure 3a. A deviating ROC-curve indicates a systematic
change in position where the size of dev iation is related
Table 1 Distribution of marginal frequencies of PM
values of assessed EST according to Figure 2a
PM values 1 2 3 4 5 6 7
Frequencies before EA (x
i
) 1018210
Cumulative frequencies before EA, C(X)i 1 1 11 19 21 22 22
Frequencies after EA (x
i
) 1196401
Cumulative frequencies after EA, C(Y)i 12 117212122
Lund and Lundeberg Chinese Medicine 2010, 5:32
/>Page 5 of 10
to the systematic change measured by RP and the S
shape of the ROC c urve is a sign of systematic change
in concentration of the assessments (Figure 3b).
To evaluate the pattern of pure systematic change
without any source of individual variation in the paired
observations (i.e. the expected pattern of the systematic
change), we used the rank-transformable pattern of
change (RTPC) to pair off the two sets of marginal fre-
quencies where all individuals kept their ordering rela-
tive to ea ch other but may have changed the category
(Figure 4).
According to Figure 2a, the first observation in cate-
gory 1 (PM value 1) b efore EA is paired with the first
observation in category 1 (PM value 1) after EA and the
first following observation in category 3 (PM value 3)
before EA is paired with the observation in category 2
(PM value 2) after EA. Th e following nine observations
in category 3 (PM value 3) before EA is paired with the
nine observations in category 3 after EA and so on.
Hence, there will be one pair (1,1) and one pair (3,2),
nine pairs (3,3) and six pairs (4,4). According to the cal-
culated RTPC for the women in this study, the expected
EST after EA is unaffected by acupuncture stimulation
in the ST36 and ST38 except for four of the women.
According to t his pattern one were supposed to have
reduced EST, (from 3 to 2), and three of them that were
supposed to report increa sed EST, from 4 to 5 and 6 to
7 respectively, after EA as compared with before EA.
Individual variation
The existence of heterog eneity in th e marginal frequen-
cies in observed data, i.e. indications of systematic
changes related to the group, does not entirely explain
the pattern of change in paired assessments. Often there
is an individual source of heterogeneity in the results
additionally to the systematic changes in studies evaluat-
ing treat ment of pain or other subjective variabl es.
When observed values (Figure 2a) are dispersed from
the expected pattern of change at the group level, RTPC
(Figure 4), it is an indicat ion of individual variation. For
example four individuals (3+1) assessed their EST as 4
and 5 before EA that was shifted to 3 after EA (Figure
2a). The expected assessments based on the result of
the group were PM value 3 both before and after EA
(Figure 4).
The evaluation of individual changes in the applied
threshold assessments are based on a ranking proce-
dure in which the pairs of assessments are transformed
into ranks, tied on the cells ( Figure 5), the augmented
ranks. The augmented ranking procedure according to
formula (3)
Rxxx
ij
X
kl il ij
l
j
l
m
k
i
()
()=+++
=
−
==
−
∑∑∑
1
2
1
1
1
11
1
applied to the data
of the women’ s EST is for example, according to
Figure 2a, = 11+3+0.5(1+5) = 17 and
R
Y
44
11 1 0 5 1 5 15
,
()
.( )=++ +=
. Furthermore, the pairs
with EST level (1,1) and (3,2), but also the five pairs
with EST (3,3), share the same mean rank value
according to the distribution before and after EA (Fig-
ure 2a). The three pairs of data with the EST (3, 5)
share the ranks 9, 10, 11 at the first assessment with
the mean rank 10. At the second assessment these
Figure 4 The expected pattern of change in EST according to
the rank-transformable pattern of change (RTPC) referring to
the pure systematic change common to the group based on
data in contingency table, Figure 2a, where all individuals have
kept their ordering relative to each other.
Figure 5 Pair of augmented mean ranks for observations in
Figure 2a. Each cell shows above and R¯ij(Y) below.
Lund and Lundeberg Chinese Medicine 2010, 5:32
/>Page 6 of 10
three observations share the ranks 18, 19, 20 that is
the mean rank 19 (Figure 5) and so on. A further ana-
lysis of the joint distribution of the paired data (Figure
5) is required for taking account o f the individual var-
iation in the pain data.
Themeasureoftheindividualchanges,therelative
rank variance is then defined by the square of the mean
rank differences as in formula (4) where
RV =
==
∑∑
6
3
11
2
n
xR
ij
j
m
i
m
ij
Δ
Then, according to Figures 2a and 5
RV =−
()
+−
()
+−
()
+
−
()
+−
()
+
6
22
112 8 319 10 313 9
5 17 15 1 20 11 1 22
3
222
22
−−
()
+−
()
=
21 1 22 21
0 231
22
;
.RV
The pair of rank values for the four individual that
have the mean rank differences of 9 respectively, means
that these individuals contribute to a large extent to the
heterogeneity in the group regarding assessed EST
before and after EA as indicated by the significant mea-
sure of RV 0.23 (95%CI, 0.00 to 0.51). However, among
the men the individual variation was considered small
and negligible RV 0.03 (95%CI, 0.00 to 0.08) indicating
that the individuals among the men agreed in their opi-
nion of changed EST.
Systematic and individual changes in assessed EPT
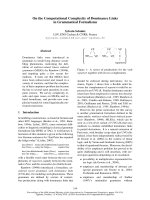
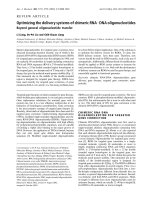
Among the women, the assessed median EPT was 12
(range 4-27; IQR 13) before and 18 (range 6-42; IQR
10) after EA. Twenty-one (21) of the 23 women (91%)
reported the EPT as increased while two of them (9%)
reported it as unchanged after EA . This change was
considered significant, P < 0.001 (Figure 6a).
The median EPT in the group of men was 19 (range
8-93; IQR18) before a nd 20 (range 7-99; IQR 10) after
EA respectively. Among the 22 men, 13 of them (59%)
reported an increase of the EPT and the remaining 9
(41%) a decrease (Figure 6b). The difference of p ropor-
tional changes between women and men in EPT was
33% (95% CI, 10% to 56%), i.e. the increase in assessed
EPTwasgreateramongthewomenthantheninthe
men after EA.
The findings of systematic changes in EPT were also
confirmed by the use of the Svensson method showing a
systematic change in position, RP 0.39 (95% CI, 0.23 to
0.56) in t he women but not in the men, RP 0.09 (-0.06
to 0.24). The measure of relative concentration was
similar in the both groups, RC 0.16 (95% CI, -0.06 to
0.38) indicating a change of the PM values towards
more central part of the scale, but without evidence of
significant change (Figure 7).
The change referred to the in dividual variation was
large with a wi de CI in the group of women, RV 0.24
(95%CI 0.00 to 0.49) while it was smaller but obvious
also among the men, RV 0.13 (95%CI 0.00 to 0.30).
Discussion
The exemplified study showed that changes of EST and
EPT after EA vary in the groups of healthy women and
men. In the female group, the EST was unchanged at
the group level and was s ystematically changed among
Figure 6 Scatterplots of individual paired assessments on EPT before and after EA in (a) women (n = 23) and (b) men (n = 22).
Lund and Lundeberg Chinese Medicine 2010, 5:32
/>Page 7 of 10
the men in both positions (incr eased) and in concentra-
tion (towards the p eripheral part of the scale) after EA.
On the other hand, the EPT results showed the opposite
pattern of change where the women responded with a
systematic change towards increased EPT after EA while
the men remained unchanged. The group related effect
among the women was supported by the fact that 21 of
the 23 responded with increased EPT after EA. Apart
from this group related change, the women were dissen-
tient on the number of categories when the threshold
was increased, i.e. the individual variability was obvious.
Among the men an individual variation was also appar-
ent. The responses to electro-acupuncture may differ
between healthy subjects and patients with different
pain conditions. However, the observed variability in the
reported findings indicates that effects of EA s hould be
evaluated s eparately in women and m en. Moreover, the
treatment effects of EA may lead to more trustworthy
results when the treatment is individually designed.
Threshold assessments have been used in various stu-
dies of acupuncture applying d ifferent types of physical
stimulation [29-31] with the objective of confirming
hypoalgesic effects where an increase is attributed to
activation of endogenous pain inhibitory systems [32].
The diff erences between women and men confirmed by
the use of PM, for threshold assessments and evaluated
with the Svensson method, are in line with our previous
results of TENS, [14] and vibration [15]. The mechan-
isms of the gender differences in respon se to sensory
stimulation such as acupuncture are unknown although
biological, psychological and social factors are all likely
to contribute to the differences [33,34]. Dif ferences in
sensitivity to electrical stimulation b etween women and
men have also been discussed [35,36] and the dosage of
acupuncture (e.g. stimulation intensity and duration)
must be taken into consideration [37]. The assessed
threshold levels are generally dependent on the status of
the nervous system and the interacti on between the sex
hormones and the endogenous pain modulating systems
[38].
The assessment of threshold s may be a valuable com-
plementary instrument, both in clinical and research
work, for the evaluation of pain as the pain threshold
levels are supposed to cha nge as a conseque nce of
neural plasticity in long-term pain conditions [39]. Pain
threshold assessments have also been suggested to act
as indicators of treatment dosage [40].
Though challenging and diff icult to assess and evalu-
ate, the statistical evaluation of pain is of great impor-
tance to take into consideration. Otherwise important
information could be missed, and the basic data for
decision-making could be misleading. In the present
study the applied statistical approach by Svensson
[22,23,26,27] was applied for a further evalu ation in
addition to the tested hypothesis of no change by sign
test and the proportional calculation of change of paired
threshold assessments before and after acupuncture.
The method was applied to ordinal data, but is also sui-
table for other types of data (e.g. equidistant and contin-
uous data with linear properties). The advantage of
statistical methods that do not require metric or other
distributional properties of data are that the results are
reliable and valid without restrictions and may also be
used for small samples. Furthermore, the possibility of
separating the pattern of change into both systematic
and individual components is important in clinical
work. The one component measuring the systematic
effect, the RP and RC, concern what is relevant change
on the group level and indicate evidence of treatment
effects. The other component measuring the variability
unex plained by the group concerns the indivi dual varia-
tion, the RV, of the results and indicate the need to con-
sid er individually modified treatments like, for instance,
the number of treatments, the “dosage” of treatment etc.
Conclusion
The present study indicates that evaluation of sensory
and pain threshold responses to acupuncture should be
analysed separately in women and men. For statistical
evaluation of the variability for both group and indivi-
dual related effects, the rank-based method by Svensso n
could be used.
Figure 7 TheROCcurveofsystematicchangesinEPTbased
on marginal frequencies of assessed EPT before and after EA
in women (n = 23) and men (n = 22).
Lund and Lundeberg Chinese Medicine 2010, 5:32
/>Page 8 of 10
Abbreviations
CI: confidence interval; CF: cumulative frequency; CRF: cumulative relative
frequency; EA: electro-acupuncture; EST: electrical sensory threshold; EPT:
electrical pain threshold; FREQ: frequency; IQR: interquartile range; PM:
PainMatcher; RC: relative concentration; RP: relative position; RV: relative rank
variance; RTPC: rank transformable pattern of change; ROC: relative operating
characteristic; SD: standard deviation; ST: stomach; TENS: transcutaneous
electrical nerve stimulation; Tot: total;
Acknowledgements
We are grateful for the constructive and critical comments on the
manuscript from the reviewers and the Chinese Medicine Editorial Team.
Author details
1
Department of Physiology and Pharmacology, Karolinska Institutet,
Stockholm, Sweden.
2
Foundation for Acupuncture and Alternative Biological
Treatment Methods, Sabbatsbergs Hospital, Stockholm, Sweden.
Authors’ contributions
TL conceived the idea of the manuscript. IL collected and analysed the data.
Both authors contributed equally to the writing and finalising of the
manuscript. Both authors read and approved the final version of the
manuscript.
Competing interests
The authors declare that the y have no competing interests.
Received: 3 February 2010 Accepted: 4 September 2010
Published: 4 September 2010
References
1. Streng A, Linde K, Hoppe A, Pfaffenrath V, Hammes M, Wagenpfeil S,
Weidenhammer W, Melchart D: Effectiveness and tolerability of
acupuncture compared with metoprolol in migraine prophylaxis.
Headache 2006, 46:1492-502.
2. Brinkhaus B, Witt CM, Jena S, Linde K, Streng A, Wagenpfeil S, Irnich D,
Walther HU, Melchart D, Willich SN: Acupuncture in patients with chronic
low back pain: a randomized controlled trial. Arch Intern Med 2006,
166:450-457.
3. Melchart D, Streng A, Hoppe A, Brinkhaus B, Witt C, Wagenpfeil S,
Pfaffenrath V, Hammes M, Hummelsberger J, Irnich D, Weidenhammer W,
Willich SN, Linde K: Acupuncture in patients with tension-type headache:
randomised controlled trial. BMJ 2005, 331:376-382.
4. Witt C, Brinkhaus B, Jena S, Linde K, Streng A, Wagenpfeil S,
Hummelsberger J, Walther HU, Melchart D, Willich SN: Acupuncture in
patients with osteoarthritis of the knee: a randomised trial. Lancet 2005,
366:136-143.
5. Vas J, Ortega C, Olmo V, Perez-Fernandez F, Hernandez L, Medina I,
Seminario JM, Herrera A, Luna F, Perea-Milla E, Mendez C, Madrazo F,
Jimenez C, Ruiz MA, Aguilar I: Single-point acupuncture and
physiotherapy for the treatment of painful shoulder: a multicentre
randomized controlled trial. Rheumatology 2008, 47:887-893.
6. Vas J, Méndez C, Perea-Milla E, Vega E, Panadero MD, León JM, Borge MA,
Gaspar O, Sánchez-Rodríguez F, Aguilar I, Jurado R: Acupuncture as a
complementary therapy to the pharmacological treatment of
osteoarthritis of the knee: randomised controlled trial. BMJ 2004,
329:1216.
7. Manheimer E, Linde K, Lao L, Bouter LM, Berman BM: Meta-analysis:
acupuncture for osteoarthritis of the knee. Ann Intern Med 2007,
146:868-877.
8. Linde K, Streng A, Hoppe A, Weidenhammer W, Wagenpfeil S, Melchart D:
Randomized trial vs. observational study of acupuncture for migraine
found that patient characteristics differed but outcomes were similar.
J Clin Epidemiol 2007, 60:280-287.
9. Vas J, White A: Evidence from RCTs on optimal acupuncture treatment
for knee osteoarthritis–an exploratory review. Acupunct Med 2007,
25:29-35.
10. White A, Foster NE, Cummings M, Barlas P: Acupuncture treatment for
chronic knee pain: a systematic review. Rheumatology 2007, 46:384-390.
11. Staud R: Mechanisms of acupuncture analgesia: effective therapy for
musculoskeletal pain? Curr Rheumatol Rep 2007, 9:473-481.
12. Ernst E, Lee MS: A trial design that generates only ‘’positive’’ results?
J Postgrad Med 2008, 54:214-216.
13. Collett BJ, Berkley K: Task force on fact sheets for the global year against
pain ‘Pain in Women
’ 2007/2008. The IASP Global Year against pain in
women. Pain 2007, 132:S1-2.
14. Lund I, Lundeberg T, Kowalski J, Svensson E: Gender differences in
electrical pain threshold responses to transcutaneous electrical nerve
stimulation (TENS). Neurosci Lett 2005, 375:75-80.
15. Dahlin L, Lund I, Lundeberg T, Molander C: Vibratory stimulation increase
the electro-cutaneous sensory detection and pain thresholds in women
but not in men. BMC Complement Altern Med 2006, 6:20.
16. Svensson E: Guidelines to statistical evaluation of data from rating scales
and questionnaires. J Rehabil Med 2001, 33:47-48.
17. Merskey H, Bogduk N: IASP task force on taxonomy. Classification of
Chronic Pain Seattle: IASP Press, 2 1994, 209-214.
18. Gracely RH: Studies of pain in normal man. In Textbook of Pain. Edited by:
Wall PD and Melzack R. London: Churchill Livingstone; , 4 1999:385-407.
19. Merbitz C, Morris J, Grip JC: Ordinal scales and foundations of
misinference. Arch Phys Med Rehabil 1989, 70:308-312.
20. Hand DJ: Statistics and the theory of measurement. J R Stat Soc Ser A
1996, 159:445-492.
21. Lund I, Lundeberg T: Aspects of pain, its assessment and evaluation from
an acupuncture perspective. Acupunct Med 2006, 24:109-117.
22. Svensson E: Analysis of Systematic and Random Differences Between Paired
Ordinal Categorical Data (Dissertation) Stockholm: Almqvist & Wiksell
International 1993.
23. Svensson E: Ordinal invariant measures for individual and group changes
in ordered categorical data. Stat Med 1998, 17:2923-2936.
24. Lund I, Lundeberg T, Kowalski J, Sandberg L, Budh CN, Svensson E:
Evaluation of variations in sensory and pain threshold assessments by
electrocutaneous stimulation. Physiother Theory Pract 2005, 21:81-92.
25. Lundeberg T, Lund I, Dahlin L, Borg E, Gustafsson C, Sandin L, Rosén A,
Kowalski J, Eriksson SV: Reliability and responsiveness of three different
pain assessments. J Rehabil Med 2001, 33:279-283.
26. Svensson E, Starmark JE: Evaluation of individual and group changes in
social outcome after aneurysmal subarachnoid haemorrhage: a long-
term follow-up study. J Rehabil Med 2002, 34:251-259.
27. Svensson E: Svensson’s method - freeware and documentation
Guidelines to calculation by the free software and interpretation of the
measures of disagreement applied to studies of change"2010-08-27.
[ />Personliga-sidor/Statistik/Elisabeth-Svensson/Svensoons-metod/Svenssons-
metod—
fri-programvara-och-dokumentation/Svenssons-method—english/.].
28. Bryant TN: Computer software for calculating confidence intervals (CIA).
In Statistics with Confidence. Edited by: Altman DG, Machin D, Bryant TN,
Gardner MJ. London: BMJ Publishing Group; , 2 2000:208.
29. Olausson B, Sagvik J: Pain threshold changes following acupuncture,
measured with cutaneous argon laser and electrical tooth pulp
stimulation, a comparative study. Prog Neuropsychopharmacol Biol
Psychiatry 2000, 24:385-395.
30. Barlas P, Ting SL, Chesterton LS, Jones PW, Sim J: Effects of intensity of
electroacupuncture upon experimental pain in healthy human
volunteers: a randomized, double-blind, placebo-controlled study. Pain
2006, 22:81-89.
31. Leung AY, Kim SJ, Schulteis G, Yaksh T: The effect of acupuncture duration
on analgesia and peripheral sensory thresholds. BMC Complement Altern
Med 2008, 8:18.
32. Andersson S, Lundeberg T: Acupuncture - from empiricism to science:
functional background to acupuncture effects in pain and disease. Med
Hypoth 1995, 45:271-281.
33. Keogh E: Sex and gender differences in pain: a selective review of
biological and psychosocial factors. JMHG 2006, 3:236-243.
34. Lund I, Lundeberg T: Is it all about sex? Acupuncture for the treatment of
Lund and Lundeberg Chinese Medicine 2010, 5:32
/>Page 9 of 10
pain from a biological and gender perspective. Acupunct Med 2008,
26:33-45.
35. Leitgeb N, Schröttner J, Cech R: Perception of elf electromagnetic fields:
Excitation thresholds and inter-individual variability. Health Phys 2007,
92:591-595.
36. Maffiuletti NA, Herrero AJ, Jubeau M, Impellizzeri FM, Bizzini M: Differences
in electrical stimulation thresholds between men and women. Ann
Neurol 2008, 63:507-512.
37. White A, Cummings M, Barlas P, Cardini F, Filshie J, Foster NE, Lundeberg T,
Stener-Victorin E, Witt C: Defining an adequate dose of acupuncture
using a neurophysiological approach - a narrative review of the
literature. Acupunct Med 2008, 26:111-120.
38. Aloisi AM, Bonifazi M: Sex hormones, central nervous system and pain.
Horm Behav 2006, 50:1-7.
39. Scholz J, Woolf CJ: Can we conquer pain? Nat Neurosci 2002, , Suppl 5:
1062-1067.
40. Nijs J, Van Houdenhove B: From acute musculoskeletal pain to chronic
widespread pain and fibromyalgia: Application of pain neurophysiology
in manual therapy practice. Man Ther 2009, 14:3-12.
doi:10.1186/1749-8546-5-32
Cite this article as: Lund and Lundeberg: On the threshold - evaluation
of variability in effects of acupuncture in a gender perspective. Chinese
Medicine 2010 5:32.
Submit your next manuscript to BioMed Central
and take full advantage of:
• Convenient online submission
• Thorough peer review
• No space constraints or color figure charges
• Immediate publication on acceptance
• Inclusion in PubMed, CAS, Scopus and Google Scholar
• Research which is freely available for redistribution
Submit your manuscript at
www.biomedcentral.com/submit
Lund and Lundeberg Chinese Medicine 2010, 5:32
/>Page 10 of 10