Báo cáo y học: "Are there any changes in burden and management of communicable diseases in areas affected by Cyclone Nargis" pptx
Bạn đang xem bản rút gọn của tài liệu. Xem và tải ngay bản đầy đủ của tài liệu tại đây (450.95 KB, 11 trang )
RESEARCH Open Access
Are there any changes in burden and
management of communicable diseases in areas
affected by Cyclone Nargis?
Nyan Win Myint
1,2
, Jaranit Kaewkungwal
2*
, Pratap Singhasivanon
2
, Kamron Chaisiri
3
, Pornpet Panjapiyakul
3
,
Pichit Siriwan
4
, Arun K Mallik
5
, Soe Lwin Nyein
6
and Thet Thet Mu
7
Abstract
Background: This study aims to assess the situation of communicable diseases under national surveillance in the
Cyclone Nargis-affected areas in Myanmar (Burma) before and after the incident.
Methods: Monthly data during 2007, 2008 and 2009 from the routine reporting system for disease surveillance of
the Myanmar Ministry of Health (MMOH) were reviewed and compared with weekly reporting from the Early
Warning and Rapid Response (EWAR) system. Data from some UN agencies, NGOs and Tri-Partite Core Group (TCG)
periodic reviews were also extracted for comparisons with indicators from Sphere and the Inter-Agency Standing
Committee.
Results: Compared to 2007 and 2009, large and atypical increases in diarrheal disease and especially dysentery
cases occurred in 2008 following Cyclone Nargis. A seasonal increase in ARI reached levels higher than usual in the
months of 2008 post-Nargis. The number of malaria cases post-Nargis also increased, but it was less clear if this
reflected normal seasonal patterns or was specifically associated with the disaster event. There was no significant
change in the occurrence of other communicable diseases in Nargis-affected areas. Except for a small decrease in
mortality for diarrheal diseases and ARI in 2008 in Nargis-affected areas, population-based mortality rates for all
other communicable diseases showed no significant change in 2008 in these areas, compared to 2007 and 2009.
Tuberculosis control programs reached their targets of 70% case detection and 85% treatment success rates in
2007 and 2008. Vaccination coverage rates for DPT 3
rd
dose and measles remained at high though measles
coverage still did not reach the Sphere target of 95% even by 2009. Sanitary latrine coverage in the Nargis-affected
area dropped sharply to 50% in the months of 2008 following the incident but then rose to 72% in 2009.
Conclusion: While the incidence of diarrhea, dysentery and ARI increased post-Nargis in areas affected by the
incident, the incidence rate for other diseases and mortality rates did not increase, and normal disease patterns
resumed by 2009. This suggests that health services as well as prevention and contr ol measures provided to the
Nargis-affected population mitigated what could have been a far more severe health impact.
Background
There are about 450 to 800 major natural disasters each
year around the world; the impact of such disasters is
exacerbated by a number of factors including global
warming, increased population movement, environmen-
tal damage, pov erty and inadequate or unde rfunded
public health systems [1]. The typical effects of such
disasters include injury, death, infectious diseases out-
breaks, large-scale population displacement, disruption
of essential services, destruction of property and infra-
structure, economic loss and psychological harm [2,3].
The burden of excess morbidity and mortality caused by
disasters may vary depending on the unde rlying charac-
teristics of the disaster-affected population [4]. During
disaster situations, communicable diseases can cause
high mortality and morbidity due to disruption of health
services, poor access to health care, malnutrition and
* Correspondence:
2
Faculty of Tropical Medicine, Mahidol University, Bangkok, Thailand
Full list of author information is available at the end of the article
Myint et al. Conflict and Health 2011, 5:9
/>© 2011 Myint et al; licensee BioMed Central Ltd. This is an Open Access article distributed under the terms of the Creative Commons
Attribution License ( nses/by/2.0), which permits unrestricted use, distribution, and reproduction in
any medium, provided the original work is properly cited.
inadequate supply of logistical necessities [5,6]. Disaster-
affected people are particularly vulnerable to communic-
able diseases due to malnutrition, stress, fatigue and
unsanitary living conditions [6].
Cyclone Nargis hit the delta area of Myanmar on 2
and 3 May, 2008, causing many deaths, destroying infra-
structure, and affecting economic and social activ ities
[7]. It was the most destructive natural disaster in recent
history of Myanmar and the most deadly cyclone in Asia
since 1991; 2.4 million people were severely affected by
Nargis [7]. The most common water- and food-borne
diseases in the affected area before Cyclone Nargis were
diarrheal diseases including cholera, typhoid, hepatitis A
and E and acute watery diarrhea and dysentery (shigello-
sis). Dengue and malaria had been the major vector-
borne diseases endemic in the affected area. Measle s,
acute respiratory infection (ARI), diphtheria, pertussis
and meningococcal diseases were reported as associated
with the overcrowd ing in the area. Other diseases ende-
mic in the region were tuberculosis, snake bites and
sexually transmitted infections (STIs) [8].
The Myanmar Ministry of Heal th (MMOH) set up the
Early Warning and Rapid Response (EWAR) surveillance
system after Cyclone Nargis with involvement of other
national and international agencies working in the Nar-
gis-aff ected area and impl emented it from the first week
of June 2008 until May 2009 [9]. It included rumor veri-
fication for disease monitoring and management, parti-
cular ly for early warning and rapid responses. It tracked
15 common diseases and conditions in the affected area:
acute diarrhea, suspected cholera (acute watery diar-
rhea), bloody diarrhea, acute jaundice, ARI/pneumonia,
suspected measles, suspected meningitis, malaria con-
firmed by rapid diagnostic test, suspected dengue, sus-
pected dengue hemorrhagic fever, trauma cases,
suspected tetanus, sexually transmitted infection, snake
bites, and unexplained cluster of health events [9]. The
United Nations, ASEAN and Myanmar governmen t also
set up a “Tripartite Core Group” (TCG) as the coordi-
nating body to manage the response to Cyclone Nargis
[10]. This study was carried out to examine communic-
able disease burden and the changes in morbidity and
mortality of the diseases under national surveillance in
the Cyclone Nargis-affected area. The study also
attempted to assess the effectiveness of control measures
for these diseases, employing health management infor-
mation system indicators of the Sphere and Inter-
Agency Standing Committee (IASC) for global health
cluster communicable diseases [11,12].
Materials and methods
Study sites
Cyclone Nargis significantly affected 37 townships in
Yangon and Ayeyarwaddy division [7]. The focus of data
collection in this study included 10 of those 37 town-
ships, all of which suffered the devastating effects of
Cyclone Nargis. The ten townships included seven in
Ayeyarwady division (Ngapudaw, Labutta, Bogale, Pya-
pon, Dedaye, Kyaiklat and Mawlamyinegyun towns hips)
and three in Yangon division (Twantay, Kawnmu and
Kungyangon townships). There were about 2.8 million
people living in these ten townships in 2007 [13].
Secondary data sources
To examine the communicable disease burden and
changes in mortality and morbidity of diseases under
national surveillance, system data were extracted for the
specific study sites from the MMOH Health Manage-
ment Information System (HMIS). The HMIS is the
routine reporting system for 17 diseases under national
surveillance in Myanmar, with monthly r eporting from
township to central level [13]. The official secondary
data during 2007-2009 from the Department of Health,
and Department of Health Planning regarding commu-
nicable diseases prevention and control programs such
as immunization and water-sanitation program were
also extracted for assessing the incidence of such com-
municable diseases at the t ownship level. In addition,
other related data such as distribution of relief items
from Myanmar Red Cross Society and Myanmar office s
(WHO, UNICEF, Save the Children, Merlin and MSF
(Holland)) were also requested for exploring the
strengths and weaknesses in communicable disease
management. The 2008 data from the ten study town-
ships are extracted and pres ented separately to compare
thefourmonthspre-Nargistotheeightmonthspost-
Nargis and for comparison with data from 2007 and
2009. Data from the periodic reviews released by Tri-
partite Core Group (TCG) are also used for supplemen-
tation of population data [10].
Primary data Sources
The study employed both quantitative and qualitative
primary data collection methods. A questionnaire
regarding public health emergency (PH E) preparedness,
part icularly relatin g to disease surveillance capacity, was
developed and sent to hospitals under the Department
of Health. The questionnaires were sent to 65 hospitals
(25% of t he total 252 hospitals in coastal Myanmar
which include all 5 states/divisions (i.e., Yangon, Ayeyar-
waddy, Mon, Tanintharyi and Rakhine). The study
selected hospitals in coastal area of Myanmar because of
the high risk for emergency and disaster in this area
such as the tsunami in 2004, Cyclone Mala in 2006 and
Cyclone Nargis in 2008. The que stio nnaires were devel-
oped based on questionnaires and guidelines from the
World Health Organization (WHO), the Association of
Professionals for Infection Control and Epidemiology
Myint et al. Conflict and Health 2011, 5:9
/>Page 2 of 11
(APIC) and the U.S. Centers for Disease Control and
Prevention. Stratified random sampling methods based
on referral level are used for the hospital survey on PHE
preparedness because it is found that the preparedness
level depends on the referral level [14]. Hospitals under
Department of Health are classified as primary referral
(station/sub-township hospitals), secondary referral
(township/district hospitals) and tertiary (state/division/
specialist hospitals) depending on the health services
provided to the public. The questionnaires were com-
pleted by hospital directors from t hose hospitals by
means of a self- administered method. Focus group dis-
cussion was used to learn more about community per-
ceptions of the health sector response to Cyclone
Nargis. A total of 6 focus group discussions were carried
out in 3 villages severely affected by Cyclone Nargis:
Amar and Kyan-ka-dune villages in Pyapone township
and Mangalake village in Kungyankone township. In
each village, two focus group discussions were con-
ducted: one for community members and one for gov-
ernment personnel and community leaders. Each focus
group included 6 to 9 persons, and the discussion time
ranged from 65 to 95 minutes. Two facilitators and two
note takers were used to carry out each focus group dis-
cussion. The det ailed analyses of hospital preparedness
and community perceptions will be reported elsewhere
and only issues related to communicable diseases were
presented in this paper.
Ethical Consideration
This study received ethical approvals from Myanmar
Ministry of Health and Faculty of Tropical Medicine,
Mahidol University.
Results
Disease surveillance in study areas
MMOH set up the coordinating health sectors for dis-
ease surveillance, outbreak detection and response. Dis-
easesurveillancedataforboththeroutineandthenew
EWAR systems were submitted from the local level to
the centralized national health management information
system (HMIS). The MMOH recognized that there were
still challenges regarding timeliness of notification and
complete data reporting in bo th HMIS and EWAR.
Underreporting of cases is still a challenging issue for
the regular reporting system because it relies on basic
health staff for reporting o f data; underutilization and
difficulties in accessing health services in some rural
areas are further reas ons for under-reporting of diseases
occurring in the population.
Hospital-based surveillance
The routine HMIS surveillance system includes report-
ing from hospitals at all levels throughout the country.
Table 1 shows the different kinds of surveillance report-
ing in 2009, one year after Cyclone Nargis, for primary,
secondary and tertiary hospitals i n cyclone-affected and
unaffected areas of the country. As shown in the table,
among the 40 out of 65 hospitals that responded to the
survey, about 90% of the hospitals had a surveillance
system for the 17 diseases under national surveillance
and about 90% also had survei llance for abnormal diag -
noses or deaths. More than 60% of the responding hos-
pitals had a syndromic surveillance system, and only
32% had microbiological surveillance system, (with espe-
cially low percentag e in primary referral hospitals, at
less than 10%).
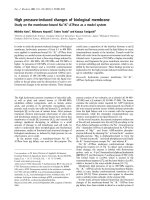
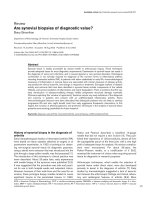
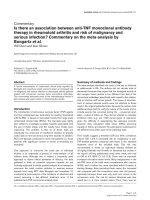
Diarrhea & Dysentery
Among the communicable diseases reported in the
HMIS, diarrhea, dysentery and acute respiratory infec-
tions (ARI) posed the highest post-Cyclone disease bur-
den in the communities within the Nargis- affected
areas, including the ten study townships (Figure 1, Table
2). The incidence rate for acute diarrhea before Cyclone
Nargis was 571.4 per 100,000 persons per year in 2007
and 683.44 per 100,000 persons per year in the four
pre-Nargis months of 2008; the rate increased to 798.81
in the post-Nargis months of 2008and declined in 2009
to 610.6 per 100,00 0 in the study area. As shown in the
figure, the seasonal peak for diarrhea cases in 2007 and
2009, the years before and after Cyclone Nargis, were
from March to May; in contrast, the 2008 peak for diar-
rhea cases was from May to July, immed iately follo wing
the Nargis incident. EWAR Weekly Reports also showed
that diarrhea cases were peaked during June and July
2008 after Cyclo ne Nargis. In contrast to the average of
less than 5 reported cases per month of severe acute
watery diarrhea (suspected cholera) cases per month,
the number of reported suspected cholera cases was
highest during June 2008 (21 cases) and surged again a
year after Nargis in March 2009 (15 cases); according to
EWAR reports following Cyclone Nargis. Increasing
incidence of diarrhea coincided with deterioration in
population sanitary latrine coverage in study townships
in Nargis-affected areas (75.5% pre-Nargis vs 50.5%
post-Nargis). The participants from focus group disc us-
sion also revealed that diarrhea diseases, ARI, influenza
and pneumoni a were prevalent immediately after
Cyclone Nargis. One participant mentioned that
“Villagers suffered mostly diarrhea and common cold.
Pneumonia was common especially among children.
Dengue and malaria were not common among villagers.”
(35 years old woman)
Despite increasing disease incidence, mortality rates
for diarrhea declined between 2007 (0.68 per 100,000
person year) and 2009 (0.06 in 2008 post- Nargis and
0.28 in 2009). This finding also corresponded to the
Myint et al. Conflict and Health 2011, 5:9
/>Page 3 of 11
high percentage of treatment with oral rehydration
therapy (ORT) among children with diarrhea (>95%) in
thehealthfacilitiesandadecreaseinseveredehydra-
tion among such children (2.31% in 2007 to <1% in
2008 and 2009) in study townships (Table 3). However,
as per TCG a periodic report [10], ORT treatment
among diarrhea patients in the community was around
50% after Cyclone Nargis. Overall, case fatality rate for
diarrhea diseases declined from 0.12% in 2007 to
0.04% in 2009.
HMIS data also show that dysentery was also one of
theleadingcausesofmorbidityinthestudytownships.
As shown in Figure 1, dyse ntery cases peaked sharply in
affected areas in 2008 following Cyclone Nargis.
Reported incidence of dysentery was 350.9 per 100,000
person-years in 2007; the rate increased to 502.27 in
2008 post-Nargis and fell back to 374.39 in 2009. How-
ever, the mortality and case fatality rates for dysentery
remained low at <1% reported during 2007-2009.
Acute respiratory infections (ARI)
Based on data from HMIS, ARI was reported to be the
major cause of morbidity and mortality among children
under 5 in the ten study townships in Nargis-affected
areas. ARI incidence in the Nargis-affected areas typi-
cally peaks in June and July (see Figure 1); in 2008, the
peak began somewhat earlier–immediately following
Cyclone Nargis– and reached higher levels in 2008
compared to 2007 and 2009. Reported ARI incidence
in 2007 was 4041.91 per 100,000 persons per year
among children under 5, increased greatly to 7279.70
in 2008 following Cyclone Na rgis, and dropped ba ck to
4661.59 in 2009. For morbidity among under 5 year-
old children, EWAR also reported high numbers of
ARI cases during June and August 2008 after Cyclone
Nargis incident. Interestingly, ARI mortality was lower
in 2008, at 2.76 per 100,000 person-years during the
months of 2008 post-Nargis, compared to 4.86 in 2007
and4.11in2009(Table2).Thecasefatalityratefor
ARI showed a similar declining pattern over the three
years: 0.12% in 2007, 0.04% in post-Nargis 2008 and
0.09% in 2009.
Malaria and dengue
Cases of vec tor-borne diseases such as malaria and den-
gue cases decreased significantly in 2009, compared to
2007 and 2008. As shown in Figure 1, t here was a sig-
nificant peak in malaria c ases in 2007 but more of a
typical seasonal pattern in 2008 following Cyclone Nar-
gis. Reported malaria incidence was 324.44 per 100,000
persons per year in 2007, increased slightly to 372.84
following Cyclone Nargis in 2008, and then dropped to
227.18 in 2009, based on routine HMIS reporting. Simi-
larly, the percen tage of malaria patients among general
clinic attendance fell from 3.17% in 2 007 to 1.63% in
2009. In contrast, the mortality percentage among
malaria inpatients (case fatality rate among malaria inpa-
tients) increased, rising from 1.16% in 2007 to 3.31% in
2009. It was shown, however, that malaria morbidity
and mortality varied among different townships. From
the EWAR report, confirmed malaria cases peaked in
July 2008 following Cyclone Nargis, but the monthly
pattern of m alaria cases shows no significant difference
from the seasonal pattern in the study area based on
EWAR reporting between June 2008 and May 2009.
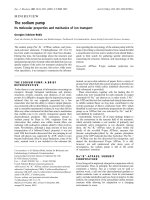
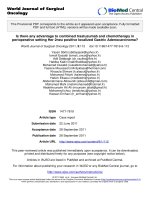
The i ncidence rates for reported dengue hemorrhagic
fever cases were 35.65 pe r 100,000 person-years in 2007
and then dropped to 13.03 in pre-Nargis 2008, slightly
increased to 15.80 following Cyclone Nargis, and then
dropped again to 12.40 in 2009 (Table 2). Dengue
hemorrhagic fever cases followed the seasonal patterns
during 2007 and 2009 as shown in Figure 2. Confirmed
dengue hemorrhagic fever cases reported by EWAR also
surged after Nargis, specifically during July 2008, in
which there were 273 cases or 0.14% of total consulta-
tions. Mortality rate and case fatality rate for dengue
hemorrhagic fever decreased between 2007 and 2009,
but increased sharply in July 2008 in association with
the increase in reported cases.
Tuberculosis and other diseases
HMIS data also show that morbidity and mo rtality rates
for tuberculosis decreased in the study area between
2007 and 2009 (67.11, 57.23, 57.15, and 47.54 per
100,000 persons per year in 2007, pre-Nargis 2008,
Table 1 Availability of different surveillance systems in Nargis and Non-Nargis areas in 2009
Variables Hospitals in Nargis affected Area Hospitals in Non-Nargis affected Area
Primary
n=12
Secondary
n=7
Tertiary
n=2
Total
N=21
Primary
n=11
Secondary
n=5
Tertiary
n=3
Total
N=19
n (%) n (%) n (%) n (%) n (%) n (%) n (%) n (%)
Diseases under national surveillance 10 (83%) 6 (86%) 2 (100%) 18(86%) 10 (91%) 4 (80%) 3(100%) 17(89%)
Microbiological surveillance 1 (8%) 3 (43%) 1(50%) 5 (24%) 1(9%) 3 (60%) 2 (67%) 6(32%)
Surveillance on abnormal diagnosis
and death
9 (75%) 6 (86%) 1 (50%) 16 (76%) 10 (91%) 4 (80%) 3 (100%) 17 (89%)
Syndrome surveillance 5 (42%) 5 (71%) 2 (100%) 12(57%) 7 (6%) 4 (80%) 2 (67%) 13(68%)
Myint et al. Conflict and Health 2011, 5:9
/>Page 4 of 11
post-Nargis 2008 and 2009, respectively; see Table 2).
For sexually transmitted infections, incidence rates for
genital ulcer (>2 per 100,000 person year) and male ure-
thral discharge (>1 per 100,000 person year) comparable
for 2007-2009; thus th e disease bu rden for the se STIs
was the same before and after the Cyclone Nar gis and
there were also not much monthly fluctuation cases
during 2007-2009. According to EWAR, STIs consti-
tuted less than 0.5% of total consultations from J une
2008 to May 2009.
Interestingly, as part of th e surveillance, we noted that
mortality rates for snake bite did not change much dur-
ing the period from 2007 to 2009, yet case fatality rates
for snake bite was quite high in t he study area after
Cyclone Nargis incident (25.64 in 2008 pre-Nargis vs
36.18 in 2008 post-Nargis). It was also found that vac-
cine-preventable diseases such as diphtheria, pertussis,
neonatal tetanus and measles were no t the major causes
of morbidity or mortality among the under-5 children
during 2007-200 9. Incidence rates for viral hepatitis and
(a) Reported number of diarrhea cases (b) Reported number of dysentery cases
(c) Reported number of ARI cases (d) Reported number of malaria cases
0
500
1000
1500
2000
2500
Cases
2007
2008
2009
0
200
400
600
800
1000
1200
1400
1600
1800
Cases
2007
2008
2009
0
500
1000
1500
2000
2500
Cases
2007
2008
2009
0
200
400
600
800
1000
1200
1400
1600
Cases
2007
2008
2009
Figure 1 Four leading communicable diseases before and after Cyclone Nargis in study townships. (White Star): Cyclone Nargis
Myint et al. Conflict and Health 2011, 5:9
/>Page 5 of 11
typhoid were <10 per 100,000 person-years during 2007
and 2009.
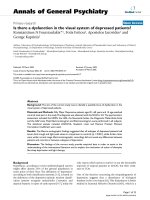
Health services utilization
Based on the data in HMIS, general clinic attendance
(total outpatient consultations in the ten study
townships divided by the total population of those town-
ships, expressed as a percentage) was 15.13, 26.15 and
21.33% in 2007, post-Nargis 2008 and 2009, respectively.
These figures indicate that general clinic attendance
increased significantly in post- Nargis 2008 compared to
2007 (see Table 3). General clinic attendance is an
Table 2 Morbidity, mortality and case fatality rates of diseases under national surveillance in Nargis-affected
townships, 2007 to 2009
Diseases Morbidity(case rate per 100,000/year) Mortality(case rate per 100,000/
year)
Case fatality rate
2007 2008 2009 2007 2008 2009 2007 2008 2009
Pre-
Nargis
Post-
Nargis
Pre-
Nargis
Post-
Nargis
Pre-
Nargis
Post-
Nargis
Diarrhea 571.40 683.44 798.81 610.56 0.68 0.99 0.06 0.28 0.12 0.15 0.01 0.04
Dysentery 350.90 430.21 502.27 374.39 0.04 0.00 0.00 0.00 0.01 0.00 0.00 0.00
Food poisoning 6.57 9.06 5.36 13.27 0.18 0.11 0.06 0.08 2.73 1.22 1.19 0.60
Typhoid 7.83 4.53 3.76 3.17 0.04 0.11 0.00 0.00 0.46 2.44 0.00 0.00
Measles 5.47 0.00 0.00 0.00 0.00 0.00 0.00 0.00 0.00 0.00 0.00 0.00
Diphtheria 0.00 0.00 0.55 0.00 0.00 0.00 0.00 0.00 0.00 0.00 0.00 0.00
Whooping cough 0.00 0.00 0.00 0.00 0.00 0.00 0.00 0.00 0.00 0.00 0.00 0.00
Neonatal tetanus 0.00 0.00 0.00 0.00 0.00 0.00 0.00 0.00 0.00 0.00 0.00 0.00
ARI 4041.91 3711.64 7229.7 4661.59 4.86 3.74 2.76 4.11 0.12 0.10 0.04 0.09
Tetanus 0.47 0.55 0.64 0.79 0.11 0.00 0.06 0.00 23.08 0.00 10.00 0.00
Meningitis 0.50 0.33 0.11 0.36 0.04 0.11 0.06 0.00 7.14 33.33 33.33 0.00
Viral hepatitis 9.08 12.26 8.42 8.24 0.11 0.00 0.00 0.12 1.19 0.00 0.00 1.44
Rabies 0.29 0.44 0.06 0.24 0.29 0.44 0.06 0.24 100.00 100.00 100.00 100.00
Malaria 324.44 318.10 372.84 227.18 0.50 0.66 0.26 0.36 0.15 0.21 0.07 0.16
DHF 35.65 13.03 15.80 12.40 0.36 0.08 0.06 0.04 1.01 0.85 0.52 0.32
Snake bite 7.11 4.31 7.21 6.97 2.12 1.10 2.87 2.38 29.80 25.64 39.82 34.09
Sputum(+)
tuberculosis
67.11 57.23 57.15 47.54 0.07 0.11 0.06 0.04 0.10 0.19 0.11 0.08
Table 3 Public health indicators of healthcare services and accessibility in 10 townships of Nargis affected area, 2007
to 2009
Indicators 2007
(Range)
ψ
2008 2009
(Range)
ψ
Pre-Nargis
(Range)
ψ
Post-Nargis
(Range)
ψ
Annual surveillance data from Myanmar (HMIS)
Percentage of general clinic attendance (target 50%) * 15.13
(8.73-26.77)
15.33
(6.26-28.51)
26.15
(13.58-41.92)
21.33
(12.56-36.55)
Percent of child diarrhea cases with severe dehydration 2.37
(0.59-5.45)
1.21
(0.00-4.33)
0.72
(0.00-2.06)
0.92
(0.15-2.43)
Percent child diarrhea cases treated with ORT 97.27
(93.01-100.00)
98.21
(82.40-100.00)
95.69
(59.15-100.00)
97.62
(90.12-100.00)
Periodic review surveys (Dec 2008, Jul 2009) by Tri-partite Core Group
Percentage of population accessing within one hour distance from a health facility 77.00 75.00
Percentage of health facilities with health personnel 91.00 91.00
Percentage of health facilities which have essential drugs for most of the time 76.00 85.00
Ψ Range = township which had lowest percentage/coverage to township which had highest perc entage/coverage
∗ General clinic attendance %
utilization of clinics by patients
=
Total numbers of outpatient visits at clinics
Po
p
ulation at Particular Townshi
p
×10
0
Myint et al. Conflict and Health 2011, 5:9
/>Page 6 of 11
HMIS indicator for health services utilization, The data
from EWAR, which includes statistics from international
NGOs, indicated that there were a total of 754,852 con-
sultations in 15 townships in the Nargis-affected area
one year af ter the Nargis incident, from June 2008 to
May 2009. (Comparable data for the year preceding
Nargis are not available.) I t was also estimated that the
average number of consultations per person d uring the
year following the Nargis incident was about 0.3 visits
per person per year, which mean that general clinic
attendance percent was 30% and not much different
from HMIS data of 26.15% in post-Nargis 2008. A s
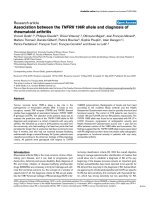
shown in Figure 3, monthly general clinic attendance
did increase from May 2008 to July 2008, the 3 months
following Cyclone Nargis. Subsequently attendance
slowly decreased starting from August 2008. During
2009, monthly attendance appeared to be stable without
much variation by month over the year analyzed.
In assessing accessibility to health facilities, TCG sur-
vey showed that about 75% of the population in Nargis-
affected areas lived wi thin one hour distance from health
facilit ies in post-Nargis 200 8 and 200 9. It was also found
that there was no significant change in presence of health
personnel at health facilities (91%) in 2008 to 2009. In
contrast, drug availability at health facilities for most of
that time dramatically increase d from 76% in Dece mber
2008 to 85% in July 2009. The drug availability figures
are drawn from a T CG survey that asked respondents
about drug availability when t hey went to health care
facilities; drug availability is defined as the proportion of
health care facilities which have essential drugs most of
the time. On the other hand, the average number of
clinic visits by household head was 1.9 in July 2009; this
falls short when comparing to the international standard
target of 2.0-4.0 (as set by Sphere).
Disease prevention and control measures
During the period from May 2008 to April 2009, there
were a total of 50,000 pamphlets, 2,945 posters, and
12,000 booklets about diarrheal diseases and childhood
infections distributed to the Nargis-affected areas by
National Health Programs and other organizations.
Interestingly, most of the participants in focus group
discussions pointed out that they were not inter ested in
health education and went to health education centers
only for receiving relief items.
“Health education was given on dengue, malaria, diar-
rhea diseases, and other communicable diseases. Most of
the villagers did not g o because they were busy with
activities such as building shelter.” (57 year-old farmer)
Rapid diagnostic test and artemesinin combination
the rapy (ACT) were available in about 70% of rural and
sub rural health centers [15]. One health worker men-
tioned that “During Cyclone Nargis, a lot of malaria
drug s were given to my health center, but malaria is n ot
prevalent in my area. I was afraid the malaria drugs
would expire.” The national health progr ams and other
organizations distributed a total of 282,532 insecticide
long-lasting nets (ILLN) for malaria prevention from
May 2008 to April 2009, covering about 10% of the
population in those a reas. Availability of inform ation,
education and communication (IEC) materials for den-
gue in health centers was high, with more than two-
thirds of the health centers having IEC materials for
dengue after Cyclone Nargis [15]. On the other hand,
IEC materials for malaria were present in only about
50% of health centers in Nargis-affected areas in 2009
[15]. The vector-borne diseases control program distrib-
uted 37,000 pamphlets on vector-borne diseases from
0
50
100
150
200
250
300
350
400
450
Cases
2007
2008
2009
Figure 2 Reported number of DHF cases.(WhiteStar):Cyclone
Nargis
0
5
10
15
20
25
30
percent
2007
2008
2009
Figure 3 Monthly general clinic attendance. (White Star): Cyclone
Nargis
Myint et al. Conflict and Health 2011, 5:9
/>Page 7 of 11
May2008toApril2009.Inonespecificareahighly
endemic area for malaria, Ngapudaw, the training pro-
gram for malaria case management was carried out for
80 hospital work ers. Insecticide residual spray had also
been used in highly endemic areas, covering 40,122 per-
sons, or about 15% of the population, in those areas.
Mass mosquito larviciding activities for dengue control
were carried out in areas with population coverage of
347,231, or slightly more than 10%, in the study area.
Tuberculosis control programs reached the targets of
70% case detection and 85% treatment success rate
before the Nargis incident in the ten study townships.
However, it still must be noted, case detection in the
Nargis-affected area (at 70%) was already slightly lower
than the national average of 77%. Cyclone Nargis nega-
tively affected tuberculosis case detection, which fell
from 78% in the months of 2008 before Cyclone Nargis
to 64% during the mo nths of 2008 following the i nci-
dent (see Table 4). The percentage of case detection was
quite different among townships, with detection rates
lower than 50% in some townships.
Coverage of prevention of mother-to-child transmis-
sion of HIV (PMTCT) services increased from 2 of the
ten study townships in 2007 to 7 such townships in
2009. Performance of PMTCT services improved
between 2007 and 2009, for example the percentage of
treatment taken by HIV (+) pregnant mothers (61% in
2007 to 80% in 2009) and the resulting percentage of
newborns who we re HIV (+) (14% in 2007 to <5% in
2009). Despite these improvements, less than 50% of
health centers in Nargis-affected areas were found to
have HIV IEC materials in 2009 [15]. However, the
majority of the surveyed organizations distributed con-
doms for prevention of STIs; the total number o f male
condoms distributed by National Health Programs and
other organizations was 430,390 following Cyclone Nar-
gis. However, this was still less than the target of 1 con-
dom/person/month recommended by Sphere.
In t erms of the Expanded Program on Immunization
(EPI), vaccination coverage reached highest levels in
2008 after Cyclone Nargis (see Table 4); coverage for
the DPT 3
rd
dose reached the immunization program
target of around 90%, as documented both by routine
reporting and TCG survey. However, measles coverage
remained lower than the 90% target, with the percentage
of12-23month-oldchildreninoculatedreportedat
around 84% in 2007 and 2009, but higher during 2008
(86% in the months before Nargis and 89% in the
months post-Nargis). The EPI IEC materials were pre-
sent in around two-thir ds of health facilities in Nargis-
affected areas as indicated in a survey done by UNICEF
during December 2008 [15]. One health professional
Table 4 Public health indicators of preventive and control measures in 10 townships of Nargis- affected area, 2007 to
2009
Indicators 2007
(Range)
ψ
2008 2009
(Range)
ψ
Pre-Nargis
(Range)
ψ
Post-Nargis
(Range)
ψ
Annual surveillance data from Myanmar (HMIS)
Average of sanitary latrine coverage (Urban population) 78.44
(43.65-106.40)
N/A 61.78
(29.10-95.65)
82.08
(30.4-107.00)
Average of sanitary latrine coverage (Rural population) 66.53
(12.10-93.46)
N/A 48.42
(20.42-89.35)
71.36
(53.70-93.60)
Average of sanitary latrine coverage (Total Population) 67.99
(22.20-93.20)
75.50
(43.16-95.90)
50.47
(23.05-78.20)
72.36
(56.00-94.80)
Treatment success rate for tuberculosis 90.49
(86.78-97.45)
76.77
(54.28-96.88)
88.59
(81.38-99.42)
N/A
Case detection rate for tuberculosis 69.25
(33.96-155.21)
78.37
(25.60-135.35)
64.64
(20.98-111.11)
N/A
DPT 3
rd
dose 90.53
(73.1-99.0)
91.8
(78.38-94.7)
90.05
(81.58-96.1)
88.01
(76.2-98.8)
Measles immunization 83.53
(61.4-95.4)
85.51
(68.90-94.77)
89.24
(73.31-95.57)
82.19
(70.8-90.9)
Periodic review surveys (Dec 2008, Jul 2009) by Tri-partite Core Group
Percentage of improved drinking water N/A 66.00
Percentage of improved sanitation facilities 40.00 43.00
DPT 3
rd
dose N/A 66.00
Measles immunization 91.00 88.00
Ψ Range = township which had lowest percentage/coverage to township which had highest perc entage/coverage
Myint et al. Conflict and Health 2011, 5:9
/>Page 8 of 11
also mentioned in a focus group discussion that immu-
nization services were successful after Cyclone Nargis.
The sanitary latrine coverage was increased from 78%
in 2007 t o 82% in 2009 in urban areas and from 67% to
71% in rural areas (see Table 4), however, coverage
declined to 62% in urban areas and to 4 8% in rural
areas in the months of 2008 following the Nargis inci-
dent. In urban and rural areas combined, the sanitary
latrine coverage for the Nargis-affected population dur-
ing 2008 was 76% in the months pre-Nargis and fell to
51% in the months post-Nargis. However, the sanitary
latrine coverage in 2009 was still low in certain rural
areas, e.g., in N gapudaw, Labutta and Bogale townships.
The TCG survey reported that the population receiving
improved drinking water was 66% in December 2008.
That same survey indicated approximately 43% for
improved sanitation facilities, which was significantly
lower than the MMOH data of 70% in 2009. The large
difference i n sanitary latrine coverage between the two
data sources may be becaus e HMIS is based on popula-
tion coverage and TCG survey is based on household
coverage. Participants in focus group discussions men-
tioned that sanitary latrine construction by villagers was
associated with the supply of both latrine pan and con-
struction cost. “Latrine pans were distributed. However,
I could not construct latrine because I had no money.”
(25 year-old man) and “In our village, most of the villa-
gers were able to construct sanitary l atrine because the
organization (———) provided not only gave la trine pans
but also provided the construction cost.” (18 year-old
student)
Discussion
MMOH established HMIS as a routine reporting disease
surveillance system several years ago, and the system
has been fully functioning in almost all levels of hospi-
tals. However, hospitals, especially at the secondary
referral level, should consider strengthening microbiolo-
gical surveillance because of weakness in laboratory
capacity at such hospitals. Microbiological surveillance
is important for early detection of public health emer-
gencies, especially with regard to communicable disease
outbreaks. Currently, there are only a bout 20-30% of
hospitals that have microbiological surveillance systems
important for investigation of public health emergencies,
compared to 64.5% of hospitals in China [14].
The World Health Organization recommends that
emergency surveillance should include bloody diarrhea,
acute watery diarrhea and suspected cholera, acute
respiratory tract infection (ARI), measles, meningitis,
HIV/AIDS, sexual ly transmitted infections, tuberculosis,
and neonatal tetanus [6]. Setting up of EWAR with par-
ticipation of national and international organizations
working in public health emergency response is a best
practice for public health emergency management and
should be set up as soon as pos sible as part of public
health emergency management. These diseases are com-
parable to those included in Myanmar’s routine surveil -
lance system, but there is room for improvement in
areas such as recording and calculation of timeliness for
surveillance and sensitivity for outbreak detection [13].
HMIS reporting i s a passive surveillance system, which
includes such limitations such as under-reporting;
potential unreliability because of dependence on basic
health staff f or data collection, and incompleteness of
data due to underutilization and difficulti es of accessing
health services in some rural areas. How ever, it is also
necessary to set up the database for logistic capacity and
drug supply within the health sector in cooperation with
other organizations working in public health emergen-
cies [16].
The national surveillance data taken together with the
EWAR reports suggested that morbidit y of diarrhea,
dysentery and ARI increased significantly for about 3
months after Cyclone Nargis, but the incidence of other
diseases did not deviate much from normal levels or
seasonal patterns, compared to 2007 and 2009. The
increases observed during the months after Cyclone
Nargis included some, but not all, of the outbreak-prone
diseases that have been documented to increase follow-
ing other disast er incidents elsewhere——ARI, diarrheal
diseases, measles, malaria in endemic areas, epidemic
meningococcal disease, dengue, tuberculosis, tetanus,
pneumonia, relapsing fever, yello w fever, and typhus
[6,17]. Early diagnosis and prompt treatment by trained
staff that use standard protocols at all health facilities
improves the management of communicable diseases
and mitigates the health impact of a natural disaster [5].
Thus, the relati vely high availability of drugs for com-
mon diseases in risk areas and the strengthened pre-
paration for disaster m anagement and health services
offered by governmental programs, international organi-
zationsandNGOsmighthelpexplainwhythemorbid-
ityandmortalityofcommon communicable diseases
were lower than might have been expected after the
Nargis incident.
The country still needs to reach its targets for routine
disease control programs. For example, the tuberculosis
program reached its overall targets of case detection and
treatment success rates, but these levels varied in di ffer-
ent townships. More efforts are needed in townships
that did not reach the national targets. While PMTCT
coverage improved during the study period, healthcare
providers noted that PMTCT services should be secured
at all townships by national health programs with finan-
cial and technical support. This involves many stake-
holders that manage PMTCT services in the country.
While measles vaccination coverage was slightly less
Myint et al. Conflict and Health 2011, 5:9
/>Page 9 of 11
than 90% in affected areas and disease incidence in
those areas did not increase post-Nargis, it has been
suggested that if measles vaccination coverage rates are
lower than 90%, measles vaccination should be given
priority to prevent an outbreak of measles in emergency
situations [5,6]. In all, it was found that coverage for all
immunizations was slightly lower after the Nargis inci-
dent in 20 09 compared to 2008. Immuniza tion services
should be restored and sustained as part of the routine
National Health Program w ith involvement of donor
agencies and township health departments.
Community awareness programs should be strength-
ened because community awareness of early treatment
and proper case management is essential to reducing
the impact of communicable diseases such as diarrheal
diseases, ARI, malaria and dengue [6]. Almost all of
the organizations surveyed for this study distributed
several IEC materials regarding communicable diseases;
however, most of the participants in the focus group
discussions reported not being interested in health
education programs. Evaluation of the effectiveness o f
these health education programs should be carried out
to identify ways to improve such efforts in future
emergencies.
Utilization of health services, marked b y indicators
such as general clinic attendance, improved between
2007 and 2009. However, rates were still quite low in
comparison with HMIS target achievement o f 50%.
Clinic attendance rates of some townships were less
than 15% while TCG survey also reported that health
services utilization did not reach the Sphere target of 4
visits per person per year [10,11]. It remains necessary
to research factors influencing the utilization of health
services. Sanitary latrine coverage in Nargis-affected
townships was slightly lower than the national sanitary
latrine coverage o f around 80% and fell sharply follow-
ing the incident. The distribution of water and sanita-
tion services was quite varied a cross the affected
communities. The water and sanitation program should
be strengthened in townships which are below the
national average, through cooperation among gove rn-
ment and non-government stakeholders and the respec-
tive communities.
Limitations
There are several limita tions to this study. First, validity
and reliability of secondary data (information bias) may
be limited, but these limitations were outside the pur-
view of the research team due t o the secondary nature
of the data. Population movement in Nargis-affected
areas may have resulted in unreliable denominators that
were used in the calculation of epidemiological measure-
ments such as incidence, mortality, and service utiliza-
tion rates. Information bias may be present in the self-
administered questionnaires completed by hospital offi-
cials. Participants in focus group discussions may not be
representative of their respective co mmunities (selection
bias). Recall bias may be another problem from the
focus groups because the study was carried out 2 years
after Cyclone Nargis.
Conclusion
Compared to what might have been expected, the health
impact in Nargis-affected areas was relatively modest.
Specifically, incidence rates increase d followi ng the inci-
dent for diarrhea, dysentery and ARI but not for other
diseases, and mortality was largely unchanged for all dis-
eases. Nonetheless, communicable diseases still pose a
high burden in these townships and all stakeholders
should strengthen the health services to improve service
coverage and quality and health outc omes. Water and
sanitation services in the study area were already well
below the national coverage and were adversely
impacted by Cyclone Nargis–these probably contributed
to the increases observed of diarrhea and dysentery
cases in the months immediately after the incident. Both
water a nd sanitary latrine coverage still need to be
improved in Nargis-affected areas to achieve national
Millennium Development Goals. Measles i mmunization
was improved immediately after Cyclone Nargis due to
the efforts from stakeholders and mass immunization
program in affected areas. These efforts may have
helped to prevent outbreaks of measles following the
incident. However, sustainability of the immunization
program is still a challenge in the study are a. The estab-
lishment of the EWAR surveillance system immediately
after the incident by participation of all organizati ons
working in public health emergency response is a best
practice for public health emergency management and it
is recommended as part of routine disaster manage-
ment. While health services utilization in the cyclone-
affected study area improved after the incident, more
effort will be needed for townships with low utilization
rates to determine the factors contributing to low utili-
zation such as supply side (e.g., accessibility of the
health services) or demand side (e.g., patient factors
such as financial difficulties). Especially in light of the
disinterest in health education voiced by most partici-
pants in the focus group discussions, the impact of risk
communication for PHE in Myanmar should also be
studied, to determine the effectiveness of IEC materials
and activities in the community and identify ways to
improve their effectiveness. Lessons learned in terms of
strengths and weaknesses for communicable disease pre-
vention control in response to Cyclone Nargis could be
applied to policy development, planning and p repared-
ness for management of f uture public health emergen-
cies in Myanmar.
Myint et al. Conflict and Health 2011, 5:9
/>Page 10 of 11
Acknowledgements
We would like to thank the Myanmar Ministry of Health for permission to
carry out the study. We give special thanks to the central epidemiological
unit, vector-borne diseases control program, tuberculosis control program,
HIV/STDs control program, environmental health program (Department of
Health) and health management information division (Department of Health
Planning) for their kind help to get the data in spite of busy with their work
schedules. Kind supports are also received with thanks from national and
international organizations in Myanmar including WHO, UNICEF, Merlin, MSF
(Holland), Save the Children, and Myanmar Red Cross Society. The valuable
data were also received from directors of all hospitals in the survey and the
community people in focus group discussion. Thank you DAAD and
SEAMEO-TROMED for their partial support in research grant. The authors
appreciate Dr. Melinda Moore, Associate Director for Global Public Health at
the RAND Corporation, for kind help in the extensive revision of the
manuscript to enhance clarity of presentation.
Author details
1
Medical Care Division, Department of Health, Ministry of Health, Nay Pyi
Taw, Myanmar.
2
Faculty of Tropical Medicine, Mahidol University, Bangkok,
Thailand.
3
Permanent Secretary Office, Ministry of Public Health, Nonthaburi,
Thailand.
4
Relief and Community Health Bureau, Red Cross Society, Bangkok,
Thailand.
5
Inter-agency Coordination and Emergency and Humanitrian
Action, WHO Office, Nonthaburi, Thailand.
6
Central Epidemiological Unit,
Department of Health, Ministry of Health, Nay Pyi Taw, Myanmar.
7
Health
Information Division, Department of Health Planning, Ministry of Health, Nay
pyi Taw, Myanmar.
Authors’ contributions
NWM, JK, PS were involved in the conceptualization and design of the
study. NWM prepared research instruments and other study logistics, and
collected data in Myanmar. SLN and TTM assisted in study management and
data support in Myanmar. KC, PS, AKM, PP provided conceptual framework
and technical support for the study. NWM and JK performed analyses and
drafted the manuscript. All authors read and approved the final manuscript.
Competing interests
The authors declare that they have no competing interests.
Received: 2 February 2011 Accepted: 28 June 2011
Published: 28 June 2011
References
1. Coppola DP: Introduction to international disaster management. Elsevier;
2007.
2. Cater WN: Disaster management: A disaster manager’s handbook: ADB.
1991.
3. Nishikiori N, Abe T, Costa DG, Dharmaratne SD, Kunii O, Moji K: Timing of
mortality among internally displaced persons due to the tsunami in Sri
Lanka: cross sectional household survey. BMJ 2006, 332(7537):334-5,
February 11, 2006.
4. Checchi F, Gayer M, Grais RF, Mills EJ: Public health in crisis-affected
populations: A practical guide for decision-makers: the Humanitarian
Practice Network. 2007.
5. World Health Organization: Technical guidelines for health action in crises
WHO. 2009 [ [updated 2009;
cited 4.7.2009].
6. Connolly MA: Communicable Disease Control in Emergencies: A Field
Manual: WHO. 2005.
7. Tripartite Core Group: Post-Nargis Joint Assessment (PONJA): A Summary of
Health-Related Issues. 2008.
8. World Health Organization: Communicable disease risk assessment and
interventions Cyclone Nargis: Myanmar: WHO. 2008.
9. UN Health Cluster: Strengthening Early Warning and Rapid Response in
Nargis Cyclone affected areas: Standards Operation Procedures,
Myanmar. 2008.
10. Tripartite Core Group: The Periodic Review I, II, III, IV on Cyclone Nargis,
2009-2010.
11. Sphere Project: Humanitarian Charter and Minimum Standards in
Disaster Response. 2004.
12. IASC: Global health cluster suggested set of core indicators and
benchmarks by category. 2009.
13. Department of Health Planning: Health Management Information System
(HMIS) Report, Myanmar. 2007.
14. Li X, Huang J, Zhang H: An analysis of hospital preparedness capacity for
public health emergency in four regions of China: Beijing, Shandong,
Guangxi, and Hainan. BMC Public Health 2008, 8(1):319.
15. UNICEF, Myanmar: Finding of Monitoring from Health Center NOV-DEC
2008 in Cyclone Nargis area
16. Pan American Health Organization: Humanitarian Supply Management
and Logistics in the Health Sector. Washington, D.C; 2001.
17. Bellos A, Mulholland K, O’Brien KL, Qazi SA, Gayer M, Checchi F: The
burden of acute respiratory infections in crisis-affected populations: a
systematic review. Conflict and Health 2010, 4:3.
doi:10.1186/1752-1505-5-9
Cite this article as: Myint et al.: Are there any changes in burden and
management of communicable disea ses in areas affected by Cyclone
Nargis? Conflict and Health 2011 5:9.
Submit your next manuscript to BioMed Central
and take full advantage of:
• Convenient online submission
• Thorough peer review
• No space constraints or color figure charges
• Immediate publication on acceptance
• Inclusion in PubMed, CAS, Scopus and Google Scholar
• Research which is freely available for redistribution
Submit your manuscript at
www.biomedcentral.com/submit
Myint et al. Conflict and Health 2011, 5:9
/>Page 11 of 11