Báo cáo y học: "Intra- and inter-individual variation of BIS-index® and during controlled sedation with midazolam/remifentanil and dexmedetomidine/remifentanil in healthy volunteers: an interventional study" pdf
Bạn đang xem bản rút gọn của tài liệu. Xem và tải ngay bản đầy đủ của tài liệu tại đây (2.77 MB, 10 trang )
Open Access
Available online />Page 1 of 10
(page number not for citation purposes)
Vol 13 No 1
Research
Intra- and inter-individual variation of BIS-index
®
and Entropy
®
during controlled sedation with midazolam/remifentanil and
dexmedetomidine/remifentanil in healthy volunteers: an
interventional study
Matthias Haenggi
1
, Heidi Ypparila-Wolters
2
, Kathrin Hauser
1
, Claudio Caviezel
1
, Jukka Takala
1
,
Ilkka Korhonen
2
and Stephan M Jakob
1
1
Department of Intensive Care Medicine, Bern University Hospital, Inselspital, and University of Bern, Freiburgstrasse, CH-3010 Bern, Switzerland
2
VTT Technical Research Centre of Finland, Tekniikankatu 1, Tampere P.O. Box 1300, FI-33101 Tampere, Finland
Corresponding author: Stephan M Jakob,
Received: 1 Dec 2008 Revisions requested: 6 Jan 2009 Revisions received: 19 Jan 2009 Accepted: 19 Feb 2009 Published: 19 Feb 2009
Critical Care 2009, 13:R20 (doi:10.1186/cc7723)
This article is online at: />© 2009 Haenggi et al.; licensee BioMed Central Ltd.
This is an open access article distributed under the terms of the Creative Commons Attribution License ( />),
which permits unrestricted use, distribution, and reproduction in any medium, provided the original work is properly cited.
Abstract
Introduction We studied intra-individual and inter-individual
variability of two online sedation monitors, BIS
®
and Entropy
®
, in
volunteers under sedation.
Methods Ten healthy volunteers were sedated in a stepwise
manner with doses of either midazolam and remifentanil or
dexmedetomidine and remifentanil. One week later the
procedure was repeated with the remaining drug combination.
The doses were adjusted to achieve three different sedation
levels (Ramsay Scores 2, 3 and 4) and controlled by a
computer-driven drug-delivery system to maintain stable plasma
concentrations of the drugs. At each level of sedation, BIS
®
and
Entropy
®
(response entropy and state entropy) values were
recorded for 20 minutes. Baseline recordings were obtained
before the sedative medications were administered.
Results Both inter-individual and intra-individual variability
increased as the sedation level deepened. Entropy
®
values
showed greater variability than BIS
®
values, and the variability
was greater during dexmedetomidine/remifentanil sedation than
during midazolam/remifentanil sedation.
Conclusions The large intra-individual and inter-individual
variability of BIS
®
and Entropy
®
values in sedated volunteers
makes the determination of sedation levels by processed
electroencephalogram (EEG) variables impossible. Reports in
the literature which draw conclusions based on processed EEG
variables obtained from sedated intensive care unit (ICU)
patients may be inaccurate due to this variability.
Trial registration clinicaltrials.gov Nr. NCT00641563.
Introduction
Pain and anxiety are highly prevalent in critically ill patients in
intensive care units (ICUs). Sedation, frequently necessary to
maintain patient comfort in ICUs, often has undesirable side
effects [1,2]. Strategies to reduce the amount of sedatives
used have been shown to improve outcomes [3,4]. To avoid
oversedation, sedation levels are assessed, usually by waking
the patient regularly and evaluating their responses using a val-
idated scoring system, such as the Ramsay Score (RS) [5],
the Sedation-Agitation Scale (SAS) [6] or the Richmond Agi-
tation Sedation Score (RASS) [7]. Although sedation guide-
lines recommend using a structured assessment system [8],
recent surveys demonstrate that less than 50% of ICUs do so
[9-11]. Why the tools are not used is unclear, but one reason
may be reluctance to awaken patients.
The use of simple, automated, objective, online sedation mon-
itors could help to overcome the shortcomings of the discon-
tinuous and cumbersome sedation scores. Online processed
electroencephalogram (EEG) monitors have been developed
in recent years, with six systems currently available for intraop-
erative monitoring. More and more often, these monitors are
EEG: electroencephalogram; EMG: electromyography; ERP: event-related potential; ICU: intensive care unit; IQR: interquartile range; OR: operating
room; RASS: Richmond Agitation Sedation Score; RE: response entropy; REM: rapid eye movement; RS: Ramsay Score; SAS: Sedation-Agitation
Scale; SE: state entropy; SQI: Signal Quality Index.
Critical Care Vol 13 No 1 Haenggi et al.
Page 2 of 10
(page number not for citation purposes)
being used outside of the operating room (OR), to monitor
sedation in ICUs, emergency rooms, and radiology and gastro-
enterology suites [12].
Data on the use of these monitors outside the OR are limited.
The most extensively studied device is the BIS
®
[12]. In the
ICU, BIS
®
has demonstrated mixed results for sedation
assessment [13-16]; data for Entropy
®
are scarce. Despite
the lack of validation, the BIS-Index
®
is routinely used as a
sedation goal in some ICUs [12], and its use is advocated by
the manufacturer.
The main problem of these devices is the wide inter-individual
variation and overlap of the indicated values in lightly sedated
patients [17]. Processed EEG values have been compared
with clinical sedation scores as the mean value recorded in a
definite time epoch, but these time epochs have varied widely
between studies, ranging from an average of 10 seconds [15]
to one minute before assessment [18], one minute during
assessment [14], 15 minutes before assessment [13] and up
to an average of two hours before assessment [19]. In other
studies, the time epoch is not mentioned at all [16]. If used
clinically, the change over time in the individual patient is more
relevant. Hence intra-individual variation at specific sedation
levels is important. This has not been addressed in previous
studies.
We assessed the intra-individual and inter-individual (or within-
and between-individual) variability over time of two online
sedation monitors – the BIS-Index
®
and Entropy
®
– in healthy
volunteers during controlled, clinically relevant light sedation
with two different sedation regimes.
Materials and methods
We used data recorded during a study of assessment of seda-
tion levels with long-latency acoustic evoked potentials, also
called 'event-related potentials' (ERPs) [20]. Data from the
Entropy
®
Module were not analysed in this previous publica-
tion. The study was approved by the ethics committee of the
Canton of Bern (KEK Bern), Switzerland, written informed con-
sent was obtained from each individual and the trial was reg-
istered at clinicaltrials.gov (Nr. NCT00641563).
In brief, 10 healthy volunteers were sedated in a stepwise
manner to achieve RS (Table 1) of 2, 3 and 4 on two occa-
sions separated by one week. In order to maintain constant
plasma concentrations, the drugs were given by computer-
controlled syringe drivers using the Rugloop II TCI program
(BVBA Demed, Temse, Belgium) and published pharmacoki-
netic and pharmacodynamic datasets [21-23]. Remifentanil
was targeted to reach a fixed plasma level of 2 ng/mL in both
sessions, and midazolam and dexmedetomidine were titrated
to attain the desired sedation levels of RS 2, 3 and 4. The Rug-
loop II TCI program adjusted the doses to keep the plasma
concentrations stable. The predicted mean plasma concentra-
tions based on the actual infusion rates needed to achieve the
target sedation levels for dexmedetomidine were 194 ± 17
pg/mL at RS 2, 544 ± 174 pg/mL at RS 3 and 1033 ± 235
pg/mL at RS 4. Those for midazolam were 16 ± 3.7 ng/mL at
RS 2, 31 ± 9.6 ng/mL at RS 3 and 56 ± 11.7 ng/mL at RS 4.
Assessments of RS were performed by two observers (MH,
KH, or CC) right before the recording period and at least 15
minutes after the last drug adjustment to obtain a steady state,
and right at the end of the sedation period. If the assessments
of the observers differed, consensus was sought.
At each sedation level, two sets of acoustic stimulation con-
taining short 800 Hz tones with different stimulation presenta-
tion were administered by headphones. The stimulation was
applied according to both a habituation and a single-tone par-
adigm. In the habituation paradigm, four equal auditory stimuli
were applied through earphones at intervals of one second,
followed by a pause of 12 seconds. Altogether, 40 sets of
stimuli were delivered at each measurement, corresponding to
a recording time of about 10 minutes. In the single-tone para-
digm, the same standard tone as described above was deliv-
ered 600 times with an interstimulus interval of one second,
which also corresponded to a recording time of 10 minutes.
The loudness was about 30 dB above the hearing level, but
not individually adjusted. During these ERP recording periods,
we also registered BIS-Index
®
(including frontal electromyo-
Table 1
The slightly modified Ramsay Score (RS), with a painful stimulus to discriminate between RS 4 and RS 5
Sedation score Clinical response
1 Fully awake
2 Drowsy, but awakens spontaneously
3 Asleep, but arouses and responds appropriately to simple verbal commands
4 Asleep, unresponsive to commands, but arouses to shoulder tap or loud verbal stimulus
5 Asleep and only responds to firm facial tap and loud verbal stimulus
6 Asleep and unresponsive to both firm facial tap and loud verbal stimulus
Available online />Page 3 of 10
(page number not for citation purposes)
gram in the 70 to 100 Hz band), state entropy (SE) and
response entropy (RE) with the standard BIS
®
-Module (XP-
Level, 30-second smoothing time, BIS
®
-Module; GE, Helsinki,
Finland) and M-Entropy
®
Module (GE, Helsinki, Finland) of a
Datex-Ohmeda S/5 monitor (GE, Helsinki, Finland), along with
other standard monitoring parameters (heart rate/echocardio-
gram, pulse oximetry, arterial blood pressure via intraarterial
catheter and end-tidal CO
2
-concentration via a nasal probe.
The processed EEG parameters were recorded online with S/
5-Collect software (WinCollect
®
, GE, Helsinki, Finland), and
saved on a laptop for further analysis. BIS
®
values recorded
with a Signal Quality Index (SQI) below 50% were not used,
as recommended by the manufacturer. Entropy
®
values were
used only when the M-Entropy
®
built-in data quality control
mechanism reported sufficient data quality.
The EEG parameter data were reduced to 10-second inter-
vals, so a maximum of 120 EEG values per patient per seda-
tion level and drug combination could be gathered. As BIS-
Index
®
and Entropy
®
are proprietary parameters, we assumed
they are on rank scales and, therefore, we applied non-para-
metric statistics for variation.
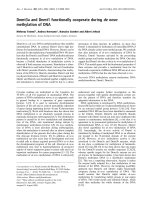
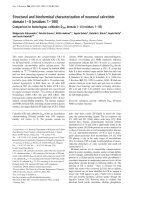
Figure 1
The individual time courses of RE during the 20-minute recordings of the 10 volunteers, at different Ramsay Scores, for the drug combination mida-zolam/remifentanilThe individual time courses of RE during the 20-minute recordings of the 10 volunteers, at different Ramsay Scores, for the drug combination mida-
zolam/remifentanil. Mida = midazolam/remifentanil; RE = response entropy; RS = Ramsay Score.
Critical Care Vol 13 No 1 Haenggi et al.
Page 4 of 10
(page number not for citation purposes)
Results
The individual time courses of BIS-Index
®
and RE are pre-
sented in Figures 1 to 4. In Table 2 we report the inter-individ-
ual values for medians and interquartile ranges (IQR) of BIS-
Index
®
, RE, SE and frontal electromyography (EMG) from
each 20-minute epoch in the 10 volunteers. In addition, we
report the range of individual (20-minute epochs) IQRs in
Table 2 and Figure 5.
As expected, the values of the processed EEG decreased as
the sedation level increased, with lower BIS
®
and Entropy
®
values in the dexmedetomidine/remifentanil group compared
with the midazolam/remifentanil group, despite the same
sedation levels. The IQRs of BIS
®
and Entropy
®
also increased
(absolute and relative to the median BIS
®
/Entropy
®
) as seda-
tion levels increased, with Entropy
®
showing higher variability.
The variability was also more pronounced in the dexmedetomi-
dine/remifentanil group than in the midazolam/remifentanil
group. Frontal muscle EMG and its variability decreased when
sedation increased (Table 2). In Figure 6 we show an example
of the variations of the processed EEG and the EMG during a
recording at RS 3 with dexmedetomidine/remifentanil.
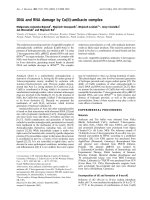
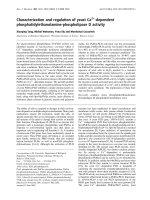
Figure 2
The individual time courses of BIS
®
during the 20-minute recordings of the 10 volunteers, at different Ramsay Scores, for the drug combination midazolam/remifentanilThe individual time courses of BIS
®
during the 20-minute recordings of the 10 volunteers, at different Ramsay Scores, for the drug combination
midazolam/remifentanil. Mida = midazolam/remifentanil; RS = Ramsay Score.
Available online />Page 5 of 10
(page number not for citation purposes)
Discussion
These data demonstrate wide variation and overlay of the
processed EEG data BIS-Index
®
, SE and RE, which increases
as the sedation levels decreases, and which also varies
depending on the drug combination used. The other concern
is high intra-individual variation, up to an IQR of more than 30
in individuals for SE/RE, independent of the drug combination
used.
The values of BIS-Index
®
, SE and RE in the midazolam/
remifentanil group were in the expected range. More surpris-
ing were the extremely low values of the dexmedetomidine/
remifentanil group, which have also been reported by other
authors [24]. Differences in processed EEG parameters with
the use of different drugs can be explained by the drug site of
action. Dexmedetomidine binds on α-2 receptors at the locus
ceruleus, promoting natural sleep pathways, whereas mida-
zolam (and propofol) potentiate the inhibitory action mediated
by the neurotransmitter gamma-aminobutyric acid at the
GABA A receptor [25]. It is well known that different drugs
induce different EEG patterns at the same anaesthetic point
[26], so the differences in the EEG pattern of the drug can
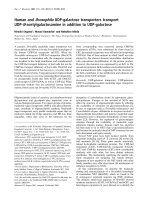
Figure 3
The individual time courses of RE during the 20-minute recordings of the 10 volunteers, at different Ramsay Scores, for the drug combination dexmedetomidine/remifentanilThe individual time courses of RE during the 20-minute recordings of the 10 volunteers, at different Ramsay Scores, for the drug combination
dexmedetomidine/remifentanil. Dex = dexmedetomidine/remifentanil; RE = response entropy; RS = Ramsay Score.
Critical Care Vol 13 No 1 Haenggi et al.
Page 6 of 10
(page number not for citation purposes)
simply be a drug effect, as described with other drugs such as
ketamine, which also fail to follow the usual pattern of the BIS
®
[12].
High variation of Entropy
®
has also been described in patients
in whom SE and RE followed an unpredictable on/off pattern
[18]. The authors attributed this to variation of EMG activity
and resulting EMG power, and also in frequency ranges which
are not affected by frontal muscle activation in deep anaesthe-
sia. Our results demonstrate that variability of EMG activity
does not explain the variability of processed EEG parameters.
We suggest another possible explanation: underlying oscilla-
tory systems [27], also known as 'sleep spindles' or 'propofol
spindles', with their regular patterns, are almost perfect sinus
curves, and therefore have low entropy, translating into a low
M-Entropy
®
value when they appear. We also intermittently
observed large, regular waves at 3 Hz frequency with resulting
low Entropy
®
values in volunteers receiving the dexmedetomi-
dine/remifentanil combination, which accounts in part for the
high intra-individual variation, particularly seen in the dexme-
detomidine/remifentanil groups.
A more general explanation for this high within-individual vari-
ability is offered in research performed by Lu and colleagues
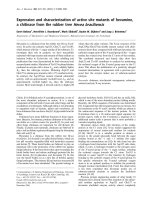
Figure 4
The individual time courses of BIS
®
during the 20-minute recordings of the 10 volunteers, at different Ramsay Scores, for the drug combination dexmedetomidine/remifentanilThe individual time courses of BIS
®
during the 20-minute recordings of the 10 volunteers, at different Ramsay Scores, for the drug combination
dexmedetomidine/remifentanil. Dex = dexmedetomidine/remifentanil; RE = response entropy; RS = Ramsay Score.
Available online />Page 7 of 10
(page number not for citation purposes)
[28]. These authors describe several positive feedback neuro-
nal mechanisms of the brain, tending to force the brain to be
either fully awake or fully asleep. These mechanisms are acti-
vated by both alpha-adrenergic pathways and GABAergic
inputs. The traces in Figures 1 to 4 seem to show several sub-
jects jumping between EEG states, presumably related to
internal or external stimuli. Furthermore, the traces seem to
track a subset of people who become sedated but retain high
frequencies in their EEG, and therefore a high RE (particularly)
or BIS
®
. This might be a state analogous to rapid eye move-
ment (REM) sleep.
Auditory stimuli applied during measurement of sedation may
theoretically influence the sedation level. Absalom and col-
leagues tested this hypothesis and did not find a clinically sig-
nificant effect of auditory stimuli on BIS-Index
®
[29]. Also, the
relatively long duration of the recordings (20 minutes) can be
criticised, because in those 20 minutes volunteers can both
fall asleep (causing slowing of EEG activity) and be aroused
by external stimuli (such as ICU alarms). In any case, some var-
iations in EEG parameters should be expected, particularly
when dexmedetomidine is used, because this drug is known
to produce arousable sedation which will naturally be accom-
panied by EEG activation [30].
Despite all these potential confounders, the clinical sedation
status of the volunteers as observed by the research person-
nel did not change during the recording time. We consider
these points to be a strength rather than a weakness of the
study because our approach represents real-life conditions
encountered by ICU patients. If low variability of processed
EEG was observed in a quiet laboratory, the 'unreal' surround-
ing would certainly have been criticised. Nevertheless, our
results cannot necessarily be extrapolated to ICU patients
because of the complex interactions between different drugs
and diminished organ functions, sometimes including enceph-
alopathy and delirium. These factors are likely to increase var-
iability even more.
Conclusion
When physiological variables are used to support clinical deci-
sion-making, trends rather than absolute individual values are
relevant. The overlap of values representing different clinically
relevant sedation levels, as well as the high intra-individual var-
iability, especially in Entropy
®
, calls into question even the use
of trends in these variables to support clinical decisions or as
therapeutic targets.
Competing interests
The study was funded by an unrestricted grant from Instrumen-
tarium/Datex-Ohmeda, now GE Healthcare, Helsinki, Finland.
The study design was approved, but not influenced by GE
Healthcare. Instrumentarium/Datex-Ohmeda was not involved
in any way in collection, analysis and interpretation of data, in
writing of the manuscript or in the decision to submit this man-
uscript.
MH, KH, CC, JT and SMJ: The Department of Intensive Care
Medicine has received research funding from GE Healthcare
to carry out research projects related to the depth of anaesthe-
Figure 5
Variation of EEG parameters during the 20-minute recordings in individual patientsVariation of EEG parameters during the 20-minute recordings in individual patients. Patients received either (a) midazolam/remifentanil (Midi/Rem)
or (b) dexmedetomidine/remifentanil (Dex/Remi). Data are presented as interquartile ranges (IQR), absolute values. EEG = electroencephalography;
RS = Ramsay Score.
Critical Care Vol 13 No 1 Haenggi et al.
Page 8 of 10
(page number not for citation purposes)
Table 2
Inter-individual medians and interquartile ranges and intra-individual ranges of interquartile ranges of each of the 10 patients'
individual 20-minute epochs. BIS
®
-Dex/Remi = dexmedetomidine and remifentanil; EMG = electromyogram from BIS
®
(absolute
power in dB (70 to 100 Hz)); IQR = interquartile ranges; Midi/Remi = midazolam and remifentanil; RE = response entropy; SE =
state entropy
Inter (between)-individual Intra
(within)-individual (range of all within variations)
Median IQR IQR range Median data points
Mida/Remi Baseline BIS
®
94.7 4.25 0 to 9 116.5
SE 79.9 5.75 2 to 15 115
RE 91.6 5.35 2 to 19.25 115
BIS
®
-EMG 44 3.5 2 to 9 116.5
RS 2 BIS
®
85.0 6.96 3 to 12 117
SE 73.0 13.35 3 to 36 116
RE 83.2 13.15 2 to 38.5 116
BIS
®
-EMG 39 6.0 3 to 10 117
RS 3 BIS
®
74.4 9.25 4 to 20 117
SE 57.6 13.35 5 to 26 118
RE 65.6 14.38 6.25 to 21 118
BIS
®
-EMG 35 2.1 0 to 5 117
RS 4 BIS
®
69.0 7.48 2.75 to 14.75 118
SE 53.9 14.38 6 to 24.75 118
RE 63.6 16.18 9 to 24.75 118
BIS
®
-EMG 31 1.6 0 to 4 118
Dex/Remi Baseline BIS
®
93.8 5.10 1 to 11 120
SE 79.9 8.00 2 to 23 118
RE 91.0 7.75 2 to 25.5 118
BIS
®
-EMG 51 5.5 2 to 12 120
RS 2 BIS
®
84.8 7.58 1 to 14 119
SE 69.8 15.47 4 to 29.75 118
RE 81.3 16.08 5 to 31 118
BIS
®
-EMG 34 3.9 2 to 7 119
RS 3 BIS
®
69.0 9.26 4 to 16 119
SE 42.9 12.80 5 to 37 118
RE 49.3 14.98 8 to 32.75 118
BIS
®
-EMG 32 3.2 0 to 8 119
RS 4 BIS
®
50.3 8.95 2 to 14 120
SE 27.3 7.03 2 to 20.25 118
RE 30.2 8.95 2 to 25.75 118
BIS
®
-EMG 30 1.6 0 to 5 120
Available online />Page 9 of 10
(page number not for citation purposes)
sia monitoring. A part of the work reported here has resulted
from these projects.
HY and IK: VTT Technical Research Centre of Finland has
received funding from GE Healthcare to carry out research
projects related to the depth of anaesthesia monitoring. Both
authors have been working in these research projects, and
part of the work reported here has resulted from these
projects.
Authors' contributions
MH conceived and designed the study, contributed to acqui-
sition, analysis and interpretation of data, performed the statis-
tical analysis and drafted the manuscript. HY made substantial
contributions to data acquisition and interpretation. KH and
CC planned the study and collected and analyzed the data. JT
contributed to study design, data interpretation and drafting
the manuscript. IK contributed to data analysis and revised the
manuscript. SMJ conceived the study, and contributed sub-
stantially in all parts of the study and manuscript preparation.
All authors have given final approval of the version to be pub-
lished.
Acknowledgements
The authors would like to thank the nurses in the ICU for their patience
and invaluable help. We also thank Jeannie Wurz (Department of Inten-
sive Care Medicine, Bern University Hospital) for editorial assistance.
Financial support was received from Instrumentarium/Datex-Ohmeda,
now GE Healthcare.
References
1. Gordon SM, Jackson JC, Ely EW, Burger C, Hopkins RO: Clinical
identification of cognitive impairment in ICU survivors:
insights for intensivists. Intensive Care Med 2004,
30:1997-2008.
2. Kollef MH, Levy NT, Ahrens TS, Schaiff R, Prentice D, Sherman G:
The use of continuous i.v. sedation is associated with prolon-
gation of mechanical ventilation. Chest 1998, 114:541-548.
3. Kress JP, Pohlman AS, O'Connor MF, Hall JB: Daily interruption
of sedative infusions in critically ill patients undergoing
mechanical ventilation. N Engl J Med 2000, 342:1471-1477.
4. Schweickert WD, Gehlbach BK, Pohlman AS, Hall JB, Kress JP:
Daily interruption of sedative infusions and complications of
critical illness in mechanically ventilated patients. Crit Care
Med 2004, 32:1272-1276.
Key messages
- BIS-Index
®
and Entropy
®
values in the dexmedetomidine/
remifentanil group are lower compared with the mida-
zolam/remifentanil group, despite the same sedation
levels.
- Variability of BIS-Index
®
and Entropy
®
increase (absolute
and relative to the median BIS
®
/Entropy
®
) as sedation
deepens.
- Entropy
®
shows a higher variability compared with BIS-
Index
®
.
- Variability is more pronounced in the dexmedetomidine/
remifentanil group than in the midazolam/remifentanil
group.
- BIS-Index
®
and Entropy
®
values in sedated volunteers are
not determined by sedation levels.
Figure 6
Example of individual variation within a 10-minute recordingExample of individual variation within a 10-minute recording. The variation is not consistently following frontal muscle electromyogram (EMG). RE =
response entropy; RS = Ramsay Score; SE = state entropy.
Critical Care Vol 13 No 1 Haenggi et al.
Page 10 of 10
(page number not for citation purposes)
5. Ramsay MA, Savege TM, Simpson BR, Goodwin R: Controlled
sedation with alphaxalone-alphadolone. Br Med J 1974,
2:656-659.
6. Riker RR, Picard JT, Fraser GL: Prospective evaluation of the
Sedation-Agitation Scale for adult critically ill patients. Crit
Care Med 1999, 27:1325-1329.
7. Sessler CN, Gosnell MS, Grap MJ, Brophy GM, O'Neal PV, Keane
KA, Tesoro EP, Elswick RK: The Richmond Agitation-Sedation
Scale: Validity and reliability in adult intensive care unit
patients. Am J Respir Crit Care Med 2002, 166:1338-1344.
8. Jacobi J, Fraser GL, Coursin DB, Riker RR, Fontaine D, Wittbrodt
ET, Chalfin DB, Masica MF, Bjerke HS, Coplin WM, Crippen DW,
Fuchs BD, Kelleher RM, Marik PE, Nasraway SA, Murray MJ,
Peruzzi WT, Lumb LD: Clinical practice guidelines for the sus-
tained use of sedatives and analgesics in the critically ill adult.
Crit Care Med 2002, 30:119-141.
9. Payen JF, Chanques G, Mantz J, Hercule C, Auriant I, Leguillou JL,
Binhas M, Genty C, Rolland C, Bosson JL: Current practices in
sedation and analgesia for mechanically ventilated critically ill
patients: a prospective multicenter patient-based study.
Anesthesiology 2007, 106:687-695.
10. Egerod I, Christensen BV, Johansen L: Trends in sedation prac-
tices in Danish intensive care units in 2003: a national survey.
Intensive Care Med 2006, 32:60-66.
11. Mehta S, Burry L, Fischer S, Martinez-Motta JC, Hallett D, Bowman
D, Wong C, Meade MO, Stewart TE, Cook DJ: Canadian survey
of the use of sedatives, analgesics, and neuromuscular block-
ing agents in critically ill patients. Crit Care Med 2006,
34:374-380.
12. Johansen JW: Update on Bispectral Index monitoring. Best
Pract Res Clin Anaesthesiol 2006, 20:81-99.
13. Simmons LE, Riker RR, Prato BS, Fraser GL: Assessing sedation
during intensive care unit mechanical ventilation with the Bis-
pectral Index and the Sedation-Agitation Scale. Crit Care Med
1999, 27:1499-1504.
14. Riker RR, Fraser GL, Simmons LE, Wilkins ML: Validating the
Sedation-Agitation Scale with the Bispectral Index and Visual
Analog Scale in adult ICU patients after cardiac surgery. Inten-
sive Care Med 2001, 27:853-858.
15. Walder B, Suter PM, Romand JA: Evaluation of two processed
EEG analyzers for assessment of sedation after coronary
artery bypass grafting. Intensive Care Med 2001, 27:107-114.
16. Ely EW, Truman B, Shintani A, Thomason JW, Wheeler AP, Gor-
don S, Francis J, Speroff T, Gautam S, Margolin R, Sessler CN, Dit-
tus RS, Bernard GR: Monitoring sedation status over time in
ICU patients: reliability and validity of the Richmond Agitation-
Sedation Scale (RASS). JAMA 2003, 289:2983-2991.
17. Tonner PH, Paris A, Scholz J: Monitoring consciousness in
intensive care medicine. Best Pract Res Clin Anaesthesiol
2006, 20:191-200.
18. Walsh TS, Ramsay P, Lapinlampi TP, Sarkela MO, Viertio-Oja HE,
Merilainen PT: An assessment of the validity of spectral entropy
as a measure of sedation state in mechanically ventilated crit-
ically ill patients. Intensive Care Med 2008, 34:308-315.
19. De Deyne C, Struys M, Decruyenaere J, Creupelandt J, Hoste E,
Colardyn F: Use of continuous bispectral EEG monitoring to
assess depth of sedation in ICU patients. Intensive Care Med
1998, 24:1294-1298.
20. Haenggi M, Ypparila H, Hauser K, Caviezel C, Korhonen I, Takala
J, Jakob SM: The Effects of dexmedetomidine/remifentanil and
midazolam/remifentanil on auditory-evoked potentials and
electroencephalogram at light-to-moderate sedation levels in
healthy subjects. Anesth Analg 2006, 103:1163-1169.
21. Greenblatt DJ, Ehrenberg BL, Gunderman J, Locniskar A, Scavone
JM, Harmatz JS, Shader RI: Pharmacokinetic and electroen-
cephalographic study of intravenous diazepam, midazolam,
and placebo. Clin Pharmacol Ther 1989, 45:356-365.
22. Minto CF, Schnider TW, Shafer SL: Pharmacokinetics and phar-
macodynamics of remifentanil. II. Model application. Anesthe-
siology 1997, 86:24-33.
23. Dyck JB, Maze M, Haack C, Azarnoff DL, Vuorilehto L, Shafer SL:
Computer-controlled infusion of intravenous dexmedetomi-
dine hydrochloride in adult human volunteers. Anesthesiology
1993, 78:821-828.
24. Maksimow A, Snapir A, Sarkela M, Kentala E, Koskenvuo J, Posti J,
Jaaskelainen SK, Hinkka-Yli-Salomaki S, Scheinin M, Scheinin H:
Assessing the depth of dexmedetomidine-induced sedation
with electroencephalogram (EEG)-based spectral entropy.
Acta Anaesthesiol Scand 2007, 51:22-30.
25. Nelson LE, Lu J, Guo T, Saper CB, Franks NP, Maze M: The
alpha2-adrenoceptor agonist dexmedetomidine converges on
an endogenous sleep-promoting pathway to exert its sedative
effects. Anesthesiology
2003, 98:428-436.
26. Billard V, Gambus PL, Chamoun N, Stanski DR, Shafer SL: A com-
parison of spectral edge, delta power, and bispectral index as
EEG measures of alfentanil, propofol, and midazolam drug
effect. Clin Pharmacol Ther 1997, 61:45-58.
27. Feshchenko VA, Veselis RA, Reinsel RA: Comparison of the EEG
effects of midazolam, thiopental, and propofol: the role of
underlying oscillatory systems. Neuropsychobiology 1997,
35:211-220.
28. Lu J, Sherman D, Devor M, Saper CB: A putative flip-flop switch
for control of REM sleep. Nature 2006, 441:589-594.
29. Absalom AR, Sutcliffe N, Kenny GNC: Effects of the auditory
stimuli of an auditory evoked potential system on levels of
consciousness, and on the bispectral index. Br J Anaesth
2001, 87:778-780.
30. Venn M, Newman J, Grounds M: A phase II study to evaluate the
efficacy of dexmedetomidine for sedation in the medical inten-
sive care unit. Intensive Care Med 2003, 29:201-207.