Báo cáo y học: "Using a human cardiovascular-respiratory model to characterize cardiac tamponade and pulsus paradoxus" pdf
Bạn đang xem bản rút gọn của tài liệu. Xem và tải ngay bản đầy đủ của tài liệu tại đây (961.48 KB, 28 trang )
BioMed Central
Page 1 of 28
(page number not for citation purposes)
Theoretical Biology and Medical
Modelling
Open Access
Research
Using a human cardiovascular-respiratory model to characterize
cardiac tamponade and pulsus paradoxus
Deepa Ramachandran
1
, Chuan Luo
1
, Tony S Ma
2,3
and John W Clark Jr*
1
Address:
1
Department of Electrical and Computer Engineering, Rice University, Houston, Texas 77005, USA,
2
Division of Cardiology, VA Medical
Center, Houston, Texas 77030, USA and
3
Baylor College of Medicine, One Baylor Plaza, Houston, Texas 77030, USA
Email: Deepa Ramachandran - ; Chuan Luo - ; Tony S Ma - ; John W Clark* -
* Corresponding author
Abstract
Background: Cardiac tamponade is a condition whereby fluid accumulation in the pericardial sac
surrounding the heart causes elevation and equilibration of pericardial and cardiac chamber pressures,
reduced cardiac output, changes in hemodynamics, partial chamber collapse, pulsus paradoxus, and
arterio-venous acid-base disparity. Our large-scale model of the human cardiovascular-respiratory system
(H-CRS) is employed to study mechanisms underlying cardiac tamponade and pulsus paradoxus. The
model integrates hemodynamics, whole-body gas exchange, and autonomic nervous system control to
simulate pressure, volume, and blood flow.
Methods: We integrate a new pericardial model into our previously developed H-CRS model based on
a fit to patient pressure data. Virtual experiments are designed to simulate pericardial effusion and study
mechanisms of pulsus paradoxus, focusing particularly on the role of the interventricular septum. Model
differential equations programmed in C are solved using a 5
th
-order Runge-Kutta numerical integration
scheme. MATLAB is employed for waveform analysis.
Results: The H-CRS model simulates hemodynamic and respiratory changes associated with tamponade
clinically. Our model predicts effects of effusion-generated pericardial constraint on chamber and septal
mechanics, such as altered right atrial filling, delayed leftward septal motion, and prolonged left ventricular
pre-ejection period, causing atrioventricular interaction and ventricular desynchronization. We
demonstrate pericardial constraint to markedly accentuate normal ventricular interactions associated with
respiratory effort, which we show to be the distinct mechanisms of pulsus paradoxus, namely, series and
parallel ventricular interaction. Series ventricular interaction represents respiratory variation in right
ventricular stroke volume carried over to the left ventricle via the pulmonary vasculature, whereas parallel
interaction (via the septum and pericardium) is a result of competition for fixed filling space. We find that
simulating active septal contraction is important in modeling ventricular interaction. The model predicts
increased arterio-venous CO
2
due to hypoperfusion, and we explore implications of respiratory pattern
in tamponade.
Conclusion: Our modeling study of cardiac tamponade dissects the roles played by septal motion,
atrioventricular and right-left ventricular interactions, pulmonary blood pooling, and the depth of
respiration. The study fully describes the physiological basis of pulsus paradoxus. Our detailed analysis
provides biophysically-based insights helpful for future experimental and clinical study of cardiac
tamponade and related pericardial diseases.
Published: 6 August 2009
Theoretical Biology and Medical Modelling 2009, 6:15 doi:10.1186/1742-4682-6-15
Received: 12 February 2009
Accepted: 6 August 2009
This article is available from: />© 2009 Ramachandran et al; licensee BioMed Central Ltd.
This is an Open Access article distributed under the terms of the Creative Commons Attribution License ( />),
which permits unrestricted use, distribution, and reproduction in any medium, provided the original work is properly cited.
Theoretical Biology and Medical Modelling 2009, 6:15 />Page 2 of 28
(page number not for citation purposes)
Background
Cardiac tamponade is a condition whereby the accumula-
tion of fluid in the pericardial sac causes a hemodynami-
cally significant in the intra-pericardial pressure (P
PERI
)
which is conventionally defined as a liquid pressure. In a
healthy subject, P
PERI
is approximately equal to the pleural
pressure (P
PL
). P
PERI
rises with increasing effusion and may
equalize to diastolic right atrial (RA) and right ventricular
(RV) pressures, and at higher levels of effusion to diastolic
left atrial (LA) and left ventricular (LV) pressures. Height-
ened pericardial pressure may lead to partial chamber col-
lapse for a portion of the cardiac cycle [1,2] wherein P
PERI
exceeds chamber pressure. Clinical cardiac tamponade
occurs when there is significant component of decreased
cardiac output, stroke volume, systemic blood pressure,
attendant tachycardia, and manifestation of pulsus para-
doxus (an exaggerated respiratory fluctuation of systolic
pressure by a greater amount than 10 mmHg or 10% [3]).
Cardiac tamponade may present as an acute clinical emer-
gency or in a less emergent fashion that requires timely
intervention [4]. Low-pressure tamponade has also been
described [5]. Here we demonstrate a case of virtual suba-
cute tamponade, modeled on the hemodynamic data
reported by Reddy et al. [3] concerning a case of tampon-
ade requiring pericardiocentesis.
Pericardial effusion leads to increased chamber interac-
tion. A parallel interaction occurs whereby expansion of
the RV during inspiration compresses the LV; likewise, a
smaller RV volume during expiration allows more blood
to be drawn into the LV [6-10]. The septum and pericar-
dium are involved in this interaction. The septum is
driven directionally by the prevailing pressure gradient
across it, but is not a passive interventricular partition; it
acts as a contractile pump in its own right [11-14]. Local-
ized chamber pressure changes are transferred throughout
the heart via the surrounding effusion-filled pericardium
[7,15] aiding chamber interaction. An exaggerated series
form of ventricular interaction occurs in tamponade when
an augmented right heart volume upon inspiration travels
to the left heart within two to three beats, contributing to
an increase in LV stroke volume (LVSV) at the expiratory
phase of respiration [16,17]. Parallel and series ventricular
interaction have been hypothesized to be the important
mechanisms involved in the generation of pulsus para-
doxus [3,9,16-18] but their individual contributions have
not been quantified. Additionally, atrioventricular (AV)
interaction [19] causes systole-dominant atrial filling in
the setting of elevated pericardial constraint and may
change the filling patterns of all four chambers. We show
that in severe tamponade this mechanism can lead to low-
ered filling volumes that changes septal motion and
affects ventricular ejection times. AV interaction thus plays
an important role in the generation of pulsus paradoxus.
Human Cardiovascular Respiratory System (H-CRS)
Model
Large-scale integrated cardiovascular-respiratory closed-
loop models provide informative analysis of normal and
diseased human physiology [11,12,20-27], since they can
capture the global aspects of cardiovascular-respiratory
interactions. Our group has developed a model of the
human cardiovascular respiratory system (H-CRS) that
integrates hemodynamics, whole-body and cerebral gas
exchange, and baro- and chemoreceptor reflexes. This
model accurately simulates the complex ventricular and
cardio-respiratory interactions that occur during the Val-
salva maneuver [24], apnea [25], left ventricular diastolic
dysfunction [11], and interventricular septal motion [12].
Here, we update our composite model of the human sub-
ject with an appropriate pericardial pressure-volume char-
acteristic to better simulate chronic cardiac tamponade.
Sun et al. [27] have modeled tamponade in a closed-loop,
baroreflex-controlled, circulatory model by incorporating
right-left heart interaction via a septal elastic compart-
ment. Their septum is limited to a passive coupling of the
ventricles via the ventricular pressure gradient. With a
completely passive septum, septal motion could not
oppose the established trans-septal pressure gradient. Our
H-CRS model contains a septal subsystem model that is
both active and passive in that it acts as a contractile pump
that assists left chamber ejection and the RV in filling. We
hold this to be a key distinction, in that biphasic septal
motion has been demonstrated experimentally in normal
hearts [13,14] and our simulations show that in tampon-
ade it can be an important contributing factor to systolic
operation. Additionally, their pulmonary component
does not model pulmonary mechanics or pulmonary cir-
culatory changes as a function of breathing movements,
but is limited to a specification of pleural pressure drive.
These circulatory changes mediated by respiration are
important in tamponade and especially in the production
of pulsus paradoxus, as will be shown. Finally, our model
demonstrates important physiological alterations of gas
exchange in the setting of cardiac tamponade.
In this work, we first examine the model-generated predic-
tions of cardiovascular pressures, volumes, and flows in
tamponade, with particular focus on the role of an active
septum. We then analyze the contributory role of breath-
ing pattern, and by introducing artificial isolation of the
right and left hearts, dissect the separate contributions of
serial and parallel ventricular interactions. Lastly, we ana-
lyze the important role of the septum as an active, tertiary
pump assisting both systolic ejection and diastolic filling,
and demonstrate the relevance of this previously
neglected component in the physiology of cardiac tam-
ponade.
Theoretical Biology and Medical Modelling 2009, 6:15 />Page 3 of 28
(page number not for citation purposes)
Methods
H-CRS Model
Our H-CRS model [11,12,24-26] has three major parts:
models of the cardiovascular, respiratory, and neural con-
trol systems. The cardiovascular component includes a
lumped pump-type model of the heart chambers, lumped
models of the inlet and outlet valves, as well as the sys-
temic and pulmonary circulations considered as pump
loads. Specifically, the walls of the heart chambers and
septum are described in terms of time-varying elastance
functions. The pericardium enveloping the heart is mod-
eled as a passive nonlinear elastic membrane enclosing
the pericardial fluid volume. Distributed models of the
systemic, pulmonary, and cerebral circulations are
included as previously described [11] and nonlinear pres-
sure-volume (P-V) relationships are used to describe the
peripheral venous system. The respiratory element in the
H-CRS model includes lumped models of lung mechanics
and gas transport, which are coupled with the pulmonary
circulation model. Specifically, the nonlinear resistive-
compliant properties of the airways are described as well
as the nonlinear P-V relationship of the lungs. In the pul-
monary circulation model, pulmonary capillary transmu-
ral pressure (hence volume) is dependent on alveolar
pressure, whereas pulmonary arterial and venous trans-
mural pressures are dependent on pleural pressure [28].
Whole-body gas transport is included in the respiratory
element with gas exchange equations given for each gase-
ous species (O
2
, CO
2
, and N
2
) at the lung and in major tis-
sues of the body at the capillary level (i.e., skeletal muscle
and brain). The neural control system model includes
baroreceptor control of heart rate, contractility, and vaso-
motor tone, and chemoreceptor control of heart rate and
vasomotor tone [24]. Parameters associated with the sys-
temic and pulmonary circulations have been adjusted to
fit typical input impedance data (systemic and pulmo-
nary) from normal human patients [11].
Differential equations for the H-CRS model were pro-
grammed in C and solved numerically using a 5
th
-order
Cash-Karp Runge-Kutta method [29]. Typically, a 50-sec-
ond simulation required a run time of five minutes on an
AMD Turion 1.6-GHz platform (Dell Inspiron 1501).
Specific modifications made to the H-CRS model for this
study of tamponade and pulsus paradoxus are described
in the subsections below.
Pericardial Model
The H-CRS model [11] is updated with a modified peri-
cardial element. Figure 1A shows our five-compartment
heart model, with the four chambers enclosed by the peri-
cardium and a separate septum. Figure 1B is a hydraulic
equivalent circuit of the heart model. The modification
consists in specification of a transmural pericardial pres-
sure (P
TPERI
) vs. pericardial effusion volume (V
PERI
) rela-
tionship, where P
TPERI
is defined as P
PERI
minus P
PL
. A
nonlinear least-squares parameter estimation method
[30] was used to obtain the the transmural pericardial
pressure – to – pericardial volume relationship by adopt-
ing the P
PERI
vs. V
PERI
data from a clinical case reported by
Reddy et al. [3]. Effusion levels up to 600 ml were
assumed to have no effect on the pericardium in chronic
tamponade, and a normal pressure-volume response was
modeled for this range. P
TPERI
was calculated from this
data under the assumption of a constant mean P
PL
of -3.0
mmHg. This new P
TPERI
-V
PERI
relationship is given by Eq.
1, where P
0
(= 4.24e-7 mmHg) is the P
PERI
coefficient, λ (=
0.0146 ml
-1
) the pericardial stiffness parameter, V
PERI
the
effusion volume, V
H
the total heart volume, and V
0
(=159.36 ml) the volume offset:
The new and old transmural pressure-volume characteris-
tics of the pericardial space differ in that their slopes in the
normal range of volumes are approximately the same,
however at high volumes, the new characteristic develops
significantly greater pressures.
Respiratory Model
Apart from gas exchange modeled in the lung and airways
[11], time-varying pleural pressure due to breathing is also
simulated in the respiratory section of the model. In order
to better characterize the cardio-respiratory interactions in
tamponade, we employed a spontaneous tidal breathing
waveform digitized from a canine study of tamponade
[17] and scaled it to human proportions of mean P
PL
-3.0
mmHg. This pseudo-human respiratory waveform has P
PL
range estimated from [3] and [31].
Septal Model
Three septal models were compared: two passive septa,
whose P-V relationship was fixed at either end-systolic or
end-diastolic behavior throughout the cardiac cycle, and
an active septum for which the P-V relationship is modu-
lated by a time-dependent activation function in syn-
chrony with free wall contraction, thereby undergoing
biphasic operation. The passive septum models are used
only for this comparison study – all simulations of control
and tamponade employ the active septum model detailed
previously [11,12].
Virtual Experiments
Cardiac Tamponade
Tamponade was simulated by graded increases in pericar-
dial volume. Following each step-increase, the model was
brought to steady-state and data was analyzed using MAT-
LAB [30]. Effusion levels from 15 ml to 1100 ml were
used. We consider effusion of 15 ml as control case, 900
PPVVVe PP
TPERI PERI H
VVV
PERI PL
PERI H
=+−
()
−
(
)
=−
+−
()
00
0
1
λ
λ
(1)
Theoretical Biology and Medical Modelling 2009, 6:15 />Page 4 of 28
(page number not for citation purposes)
ml as moderate tamponade, and 1000 ml as severe tam-
ponade.
Pulsus Paradoxus: Ventricular Interaction Studies
To analyze ventricular interaction, we tracked a fixed vol-
ume of blood as it was transported from the right atrium
to left ventricle. In Experiment 1 (see Results section), we
simulated an inspiratory increase in venous return to the
right heart by delivering a triangular pulse volume to the
vena cava within a period of two seconds at fixed P
PL
.
In Experiment 2, to dissect the relative importance of each
type of ventricular interaction, the model was modified to
eliminate one type of interaction at a time (see Experi-
ment 2 in Results section). To study series interaction, par-
allel interactions via the septum and pericardium were
respectively eliminated by increasing the septal stiffness
parameter λ by 100× from 0.05 to 5.0, and holding P
PERI
constant. To study parallel interaction, the pulmonary
venous volume was held constant thus creating an inde-
pendent left heart venous return, thereby eliminating
series interaction. Parallel and series ventricular interac-
tions were analyzed and compared based on a triangular
pulse of venous return to the right atrium such as in Exper-
iment 1, and P
PL
was held constant.
Results
Effects of Pericardial Effusion
Equilibration of Diastolic Pressures and Chamber Collapse
To simulate tamponade, we modeled graded increases in
pericardial fluid (i.e., the reverse of the pericardiocentesis
procedure in which fluid is removed in measured aliq-
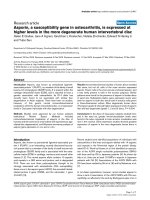
uots). Figure 2 is a plot of the steady-state diastolic cham-
ber pressures and P
PERI
in response to increases of effusion
volume. At V
PERI
of 800 ml, there is > 2 mmHg increase in
P
PERI
. At 950 ml fluid accumulation, pulsus paradoxus is
seen with an 11% variation in systolic blood pressure with
respiration. At 1050 ml, all chamber pressures equilibrate
within 2 mmHg of each other. We define a "chamber col-
lapse index" as the mean percentage of a cardiac cycle in
which P
PERI
exceeds chamber pressure, averaged over sev-
eral cardiac cycles covering both the inspiratory and expir-
atory phases of respiration. At 1100 ml, RA collapse
occurs over 34% of the cardiac cycle and LA over 20%.
Above 700 ml, progressive increases in V
PERI
is accompa-
nied by decreases in cardiac output (CO), mean arterial
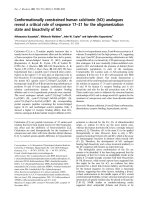
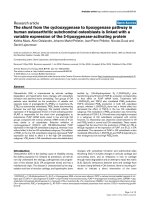
Five-Compartment Heart ModelFigure 1
Five-Compartment Heart Model. Panel A shows the five-compartment heart model. An elastic pericardium encloses all
four heart chambers. The dotted lines represent septal position when relaxed. Panel B is the equivalent hydraulic circuit model.
Anatomical components of the equivalent circuit (LV = left ventricle, RV = right ventricle, LA = left atrium, RA = right atrium,
SPT = interventricular septum, PERI = pericardium, TCV = tricuspid valve, MV = mitral valve, AOV = aortic valve, PAV = pul-
monary valve). Specific pressures (P
PL
= pleural pressure, P
PA
= pulmonary arterial pressure, P
AO
= aortic pressure, P
PERI
= peri-
cardial pressure, P
RA
= right atrial pressure, P
LA
= left atrial pressure, P
RV
= right ventricular pressure, P
LV
= left ventricular
pressure).
AB
W
W>
W
WZ/
Theoretical Biology and Medical Modelling 2009, 6:15 />Page 5 of 28
(page number not for citation purposes)
pressure (MAP), and associated activation of the barore-
ceptor reflex manifested as an increase in heart rate (HR).
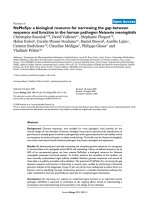
Figure 3 shows the percent change in these circulatory
indices from the control state as a function of V
PERI
. Meas-
ured data points from the patient whose pericardium we
have modeled [3] are shown for comparison. Figure 3
shows that the model provides good qualitative agree-
ment with the measured hemodynamic indices HR and
CO, however, the model is limited by a less satisfactory fit
to MAP data. For all other model parameters to be operat-
ing in normal ranges, MAP behavior is compromised with
a lesser drop with effusion than seen in data. The dotted
line in Figure 3 indicates the point of significant percent
change from control in all three indices which aligns well
with data. As can be observed, MAP data at low effusion
levels below the dotted line shows an unlikely drop that is
different from the point of deviation in other indices,
indicating the possibility of measurement error in the data
of Reddy et al. Nonetheless, even with a correction in pres-
sure offset, the model-generated rate of decline in MAP
with increased pericardial effusion volume is lower than
that seen in the data. Hence, the model provides only a
qualitative fit to the patient data.
Right Heart Relationships in Tamponade
To examine the right heart hemodynamics in tamponade
without overlying respiratory variations, P
PL
is set to the
mean, thus simulating breath-holding. The atrium may be
envisioned as a contractile storage chamber with an
inflow from the vena cava compartment and an outflow
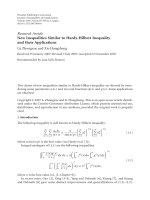
Pressure-Volume RelationshipFigure 2
Pressure-Volume Relationship. Various pressures as a function of pericardial effusion volume V
PERI
. These pressures
include pericardial pressure (P
PERI
), mean diastolic atrial (P
RA
and P
LA
) and ventricular (P
RV
and P
LV
) pressures. At 800 ml, there
is a 2 mmHg increase in pericardial pressure and equalization to right diastolic chamber pressures. At 950 ml, pulsus paradoxus
first appears. At 1050 ml, chamber pressures equalize to within 2 mmHg of each other and chamber collapse is observed at
1100 ml, with 34% of the mean cardiac cycle marked by collapse of the right atrium. The figure insert plot (top left) shows the
transmural pericardial pressure vs. pericardial volume for data points derived from Reddy et al. [3] in which a fixed mean pleu-
ral pressure is assumed, and a nonlinear least-squares fit to the data (see text for details).
≥ 2mm Hg P
PERI
Increase
34% RA Collapse
Pulsus Paradoxus
V
PERI
(ml)
Pressure (mmHg)
Pressure Equilibration
P
PERI
Model
P
RV
P
RA
P
LA
P
LV
V
PERI
(ml)
P
TPERI
(ml)
- Nonlinear least-squares fit
o Data (adjusted to transmural pressures)
Theoretical Biology and Medical Modelling 2009, 6:15 />Page 6 of 28
(page number not for citation purposes)
through the tricuspid valve to the RV chamber. Diastole is
defined as the interval between tricuspid valve opening
and closure [19].
Figure 4 shows that for the control case, RV systole begins
after tricuspid valve closure and the RA continues to relax
causing a reduction in RA pressure (P
RA
), i.e., the x-
descent. Systolic filling of the RA consists of a fast and
slow component as is seen in the RA volume (V
RA
) curve
(Figure 4C) and in P
RA
v-wave (Figure 4A). The fast com-
ponent of systolic RA filling is associated with the brisk
systolic component (S) of vena caval volume flow Q
VC
(Figure 4I). In early diastole, the characteristic two-peak
volume flow through the tricuspid valve (Q
TC
) (Figure
4G) equivalent to the more familiar Doppler transvalvular
flow velocity measurements, corresponds to the onset of
the y-descent in P
RA
(Figure 4A). In this communication,
we describe features of transvalvular volume flow with the
same terminology used in describing velocity measure-
ments (i.e., E- and A-waves). Early diastole is marked by
the prominent E-wave in Q
TC
(Figure 4G) and the begin-
ning of diastolic (D) Q
VC
(Figure 4I). This is followed by a
slow filling period (diastasis), and late in RV diastole, the
RA chamber contracts contributing flow in both the for-
ward direction (A-wave component of Q
TC
in Figure 4G)
and the reverse direction (A
R
component of Q
VC
in Figure
4I). V
RA
reflects three diastolic flow stages that correspond
to E-wave, diastasis, and A-wave of the Q
TC
(Figure 4C and
4G), with V
RA
reduction seen in the first and third stages.
The relatively smaller first reduction reveals that Q
TC
>
Q
VC
. The third stage reflects RA contraction reducing V
RA
(Figure 4C) and increasing P
RA
(a-wave in Figure 4A) to
the extent that Q
VC
is reversed (A
R
component in Figure
4I), producing RA outflow in both directions. RV volume
(V
RV
) in Figure 4E reflects the three-stage process of ven-
tricular filling.
Examination of the P
PERI
waveform reveals key alterations
during the cardiac cycle which may actively participate in
the clinically observed features of tamponade. Under con-
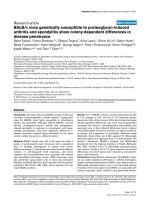
Circulatory Indices as a Function of Pericardial VolumeFigure 3
Circulatory Indices as a Function of Pericardial Volume. Percent change in circulatory indices as a function of pericar-
dial volume (V
PERI
) for the model (diamonds) and patient data (squares) from [3]. Heart rate increases with V
PERI
up to 1000 ml
(A), whereas cardiac output (B), and mean arterial pressure (C) decrease. Dotted line indicates point of significant deviation
from control.
Heart Rate
Cardiac Output
Mean Arterial Pressure
V
PERI
(ml)
A
B
C
Percent Difference from Control
Theoretical Biology and Medical Modelling 2009, 6:15 />Page 7 of 28
(page number not for citation purposes)
trol conditions, P
PERI
is low relative to P
RA
and tracks the
P
PL
(Figure 4A). It is important to recognize that when the
total heart volume is constrained by the pericardial effu-
sion, P
PERI
is now affected by changes in heart chamber
volumes and becomes positive; it now tracks the diastolic
RA pressure (Figure 4B) serving as the reference pressure
for all heart chambers. Additionally, whereas P
PERI
is nor-
mally treated as a dependent variable at a given volume of
pericardial effusion, as dictated by the P-V relationship of
the pericardial space, because of the pressure transmission
nature of the pericardial effusion, P
PERI
in tamponade
assumes the role of an independent variable that actively
modulates flows and pressures of other cardiac chambers.
Specifically, changes in ventricular and atrial volumes are
reflected in the P
PERI
waveform as two pressure dips attrib-
uted to ventricular and atrial ejection (systolic dip and
diastolic dip, respectively) as observed in canine measure-
ments [18,19]. We begin analysis of the pericardial con-
straint from the x-descent in P
RA
occurring in RV systole
(Figure 4B). With tamponade, the x-descent is no longer
related directly to relaxation of the RA. Rather, P
RA
is ele-
vated and remains nearly constant by the pericardial con-
straint and the x-descent feature is delayed, decreased in
magnitude and substantially slowed in its time course. At
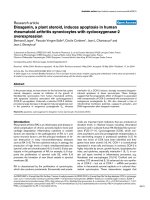
Right Heart HemodynamicsFigure 4
Right Heart Hemodynamics. Right heart hemodynamic waveforms for the control and 1000-ml effusion cases during apnea
at mean pleural pressure (-3 mmHg). The systolic and diastolic intervals are indicated, with relatively shorter intervals in the
1000-ml effusion case due to higher heart rate. The left column shows normal pericardial pressure and right atrial pressure
(Panel A), right atrial volume (Panel C), right ventricular volume (Panel E), tricuspid flow (Panel G), and inferior vena caval flow
(Panel I), respectively. With 1000-ml effusion (right column), the right atrial pressure waveform is elevated to equalize pericar-
dial pressure (Panel B) and the y-descent in particular is reduced (Panel B). Pericardial pressure displays two dips in pressure,
corresponding to ventricular ejection (labeled systolic dip) and atrial ejection (labeled diastolic dip). Systolic atrial filling is
slowed as shown by the gradual increase in right atrial volume (Panel D) and slower vena caval flow (Panel J). The reduced
diastolic venous return (Panel J) is associated with a lower right atrial volume at end diastole (Panel D). Right ventricular vol-
ume variation exhibits reduction due to both filling and stroke output changes, with volume labels (ml) shown (Panels E-F). The
E-wave is reduced and the A-wave is more prominent (Panel H). The reversed component of vena caval flow (A
R
) is no longer
present (Panel J). The diastolic-to-systolic (D/S) venous volume ratio is shown below each case, which decreases with tampon-
ade. See text for details.
Time (s)
Q
TC
(ml/s)
V
RA
(ml)
Q
VC
(ml/s)
a
x
v
y
D
S
A
R
A
E
Dias.Sys.
a
x
v
y
D
S
A
E
Sys. Dias.
Control 1000ml Effusion
A
C
E
B
D
F
Pressure
(mmHg)
GH
ͬ^sĞŶŽƵƐsŽůƵŵĞZĂƚŝŽсϮ͘ϰϯ ͬ^sĞŶŽƵƐsŽůƵŵĞZĂƚŝŽсϬ͘Ϯϳ
Systolic
Dip
Diastolic
Dip
IJ
V
RV
(ml)
30
95
52
40
Theoretical Biology and Medical Modelling 2009, 6:15 />Page 8 of 28
(page number not for citation purposes)
this point a prominent systolic dip in P
PERI
is seen, coinci-
dent with right and left ventricular ejection, which relieves
the pericardial constraint on RA and allows venous return
to refill the atrium (Figure 4B and 4J). P
RA
follows this
decline in P
PERI
creating the delayed and slowed x-descent,
and as the RA is allowed to slowly refill (Figure 4D), P
RA
separates from P
PERI
forming the v-wave. Thus, in contrast
to the control condition, in which the x-descent precedes
the RV ejection occurring during the isovolumic RV con-
traction and RA relaxation, the x-descent in tamponade is
delayed and diminished in amplitude and occurs follow-
ing the onset of RV ejection. Termination of the v-wave
corresponds to maximum V
RA
and the minimum point in
the systolic dip in the P
PERI
waveform. At tricuspid valve
opening, there is a reduced RA-RV pressure gradient
(reduced E-wave in Figure 4H) and a severely curtailed
venous return flow (D component of Q
VC
in Figure 4J) as
P
RA
is at its peak. V
RA
change results from a balance of Q
VC
(inflow to RA) and Q
TC
(outflow from RA) and the large
decline in the D component of Q
VC
in tamponade is
responsible for the smaller decrease in V
RA
during the early
diastole phase. As the tricuspid E-wave declines, V
RA
con-
tinues to decline at a slower rate. When the RA contracts
(a-wave feature in P
RA
), it produces a strong tricuspid flow
(enhanced A-wave in Figure 4H) that reduces V
RA
to very
low levels. Unlike control, there is no reversal in Q
VC
in
severe tamponade. A comparison of the change in V
RA
and
V
RV
during diastole can be made to infer the amount of
vena cava inflow during diastole. For the control case,
while V
RV
increases by 95 ml, V
RA
decreases only by 30 ml,
indicating a significant simultaneous refilling of the RA
during diastole (Figure 4C and 4E). In tamponade, the
ventricular volume increases by 52 ml, while the atrial
volume decreases by 40 ml, indicating little inflow from
the vena cava (Figure 4D and 4F). Thus, most of the blood
in the RA is transferred to the RV, with little refilling of the
RA from the venous side in diastole. The pattern of diasto-
lic increase in V
RV
also changes with tamponade, with
smaller early filling, a period of very slow increase during
diastasis, and a stronger increase coinciding with atrial
ejection (compare Figure 4E and 4F). During these diasto-
lic events, the y-descent feature is decreased substantially,
reflected by a decreased E-wave, and P
RA
continues as an
elevated, slowly increasing pressure (Figure 4B). In late
ventricular diastole, a second smaller decline occurs in the
P
PERI
waveform due to atrial ejection (diastolic dip), pro-
viding some relief from pericardial constraint. Subse-
quently, P
PERI
increases slowly due to a very limited
diastolic venous return continuing into the systolic inter-
val. This slow return delays the occurrence of the x-
descent. Model measurements of common clinical indices
are given in Table 1. With effusion, these clinical indices
fall outside of normal range [11] signifying abnormal
functionality.
Left Heart Relationships in Tamponade
The left heart hemodynamics also reflects the compressive
effects of pericardial effusion on LA volume (V
LA
) (com-
pare Figure 5C and 5D) and diastolic LV volume (V
LV
)
(compare Figure 5E and 5F). Here, diastole is defined as
the interval between mitral valve opening and closure.
Left atrial pressure (P
LA
) is elevated in tamponade (Figure
5B) compared to control (Figure 5A), with limited atrial
relaxation (x-descent). The pericardial constraint slows
systolic LA filling (compare Figure 5C and 5D), and the
volume constraint imposed by P
PERI
limits diastolic pul-
monary venous return shown in the distal venous flow
waveform (compare Figure 5I and 5J). As in the right
heart, transvalvular flow is altered with reduced early LV
filling (compare Figure 5G and 5H). The corresponding
diastolic y-descent in P
LA
is diminished (Figure 5B). Over-
all, the compressive effects of pericardial constraint are
manifested to a lesser degree in the relatively thick-walled
left heart with its slightly higher diastolic pressures.
The pre-ejection period for the LV (LPEP) is normally
slightly longer than that for the RV (RPEP) as noted in
[32] (compare Figure 4E and Figure 5E). This asynchrony
in ventricular ejection times becomes much more pro-
nounced in tamponade (discussed later) and plays a role
in modifying the shape of the x-descent feature of the P
RA
waveform. The x-descent waveform is shaped by P
PERI
which has two components, the first corresponding to RV
ejection and the second LV ejection. Figure 4F and Figure
5F indicate that the ventricles each eject 52 ml, however
the end-diastolic filling volumes are quite different (68 ml
Table 1: Model-Generated Common Clinical Indices
V
PERI
(ml) E/A Ratio DT (sec) IVRT (sec)
Right Left Right Left Right Left
15 (control) 1.2 1.2 0.235 0.190 1.110 0.082
1000 (severe tamponade) 0.6 0.5 0.120 0.089 0.198 0.082
Model measurements of common clinical indices in the right and left hearts for control (15 ml) and severe tamponade (1000 ml) effusion levels: E/A
ratio, deceleration time (DT), and isovolumic relaxation time (IVRT).
Theoretical Biology and Medical Modelling 2009, 6:15 />Page 9 of 28
(page number not for citation purposes)
V
RV
and 80 ml V
LV
) indicating that the RV is compressed to
a much higher degree than the LV.
Atrioventricular Interaction
Examination of Figure 4J and Figure 5J shows that in
severe tamponade, diastolic venous return is particularly
decreased when compared to systolic venous return. The-
oretically if diastolic venous return reaches zero, the only
time the atrium can fill is during systole. At this stage,
atrial filling is entirely conditional upon ventricular ejec-
tion, a term called maximum atrioventricular (AV) inter-
action [19]. Beloucif et al. [19] have quantified AV
interaction in terms of a diastolic-to-systolic (D/S) venous
return volume ratio. We obtained systolic and diastolic
inflow volumes per beat by integrating venous volume
over the systolic and diastolic time intervals, respectively.
These intervals are denoted in Figure 4 and Figure 5, in
which diastole is determined as the duration of ventricu-
lar filling, and systole the remainder of the cardiac cycle as
in [19]. Calculation of venous return volumes indicated
that in severe tamponade of 1000 ml effusion, diastolic
vena cava return volume is reduced by 85% whereas the
systolic volume actually increases by 40%. Thus, the right
heart D/S ratio in venous return volume drops from 2.43
in control to 0.27 in tamponade (Table 2). In the left
heart, diastolic pulmonary venous return volume is
Left Heart HemodynamicsFigure 5
Left Heart Hemodynamics. Left heart hemodynamic waveforms for the control and 1000-ml effusion cases during apnea at
mean pleural pressure (-3 mmHg). The systolic and diastolic intervals are indicated, with relatively shorter intervals in the
1000-ml effusion case due to higher heart rate. The left column shows normal pericardial pressure and left atrial pressure
(Panel A), left atrial volume (Panel C), left ventricular volume (Panel E), mitral flow (Panel G), and distal pulmonary venous flow
(Panel I), respectively. With 1000-ml effusion (right column), the left atrial pressure waveform is elevated (Panel B) with dimin-
ished atrial relaxation (x-descent) and diastolic ventricular filling (y-descent) (Panel B). Pericardial pressure displays two dips in
pressure, corresponding to ventricular ejection (labeled systolic dip) and atrial ejection (labeled diastolic dip). Systolic atrial fill-
ing is slowed as shown by the gradual increase in left atrial volume (Panel D). Ventricular volume variation is reduced as a result
of both reduced LV filing and ejection, as shown by the volume labels in Panels E-F. The E-wave is reduced and the A-wave is
more prominent (Panel H). The diastolic (D) and reversed (A
R
) components of venous flow are diminished (Panel I). The
diastolic-to-systolic (D/S) venous volume ratio is shown below each case, which decreases with tamponade. See text for
details.
Time (s)
Q
M
(ml/s)
V
LA
(ml)
Q
PV
(ml/s)
a
x
v
y
D
S
A
R
A
E
Dias.Sys.
a
x
v
y
D
S
A
E
Sys. Dias.
Control 1000ml Effusion
A
C
E
B
D
F
Pressure
(mmHg)
GH
ͬ^sĞŶŽƵƐsŽůƵŵĞZĂƚŝŽсϬ͘ϲϴ ͬ^sĞŶŽƵƐsŽůƵŵĞZĂƚŝŽсϬ͘Ϯϱ
Systolic
Dip
Diastolic
Dip
IJ
V
LV
(ml)
48
95
52
48
A
R
Theoretical Biology and Medical Modelling 2009, 6:15 />Page 10 of 28
(page number not for citation purposes)
reduced by 73% and the systolic volume drops by 24%.
The ratio of D/S pulmonary venous inflow volume also
indicates a shift in the LA filling pattern in severe tampon-
ade (1000 ml effusion) with a change in D/S ratio from
0.68 to 0.25 (Figure 5). The distal pulmonary venous flow
waveform was used in this case analogous to the report by
Beloucif et al. [19]. Table 2 shows diastolic and systolic
venous return volumes for increasing levels of effusion.
The shift toward systolic venous filling is apparent in the
right heart (Figure 4I and 4J) with little change in maxi-
mum V
RA
at the end of the systolic interval, but a substan-
tially decreased V
RA
at end-diastole related to a reduction
in diastolic venous return. Diastolic left heart venous
return volume has both reduced influx and a significantly
reduced reversal flow (Figure 5J), which leaves V
LA
unaf-
fected at end-diastole (compare Figure 5C and 5D). This
dominant systolic atrial filling pattern is indicative of
enhanced AV interaction primarily affecting the right
heart consistent with the findings of Beloucif et al. [19].
Chamber Pressure-Volume Relationships
Figure 6 shows the P-V relationships for the four heart
chambers at control, 900 ml effusion (mild tamponade),
and 1000 ml effusion (severe tamponade). Breath-hold-
ing is simulated with P
PL
held at mean. In the control case
for the RA, filling of the RA is coincident with RV systole,
beginning at minimum V
RA
with the x-descent in P
RA
(see
labeling on Figure 6A) and continuing smoothly into the
v-wave of increasing P
RA
as V
RA
rises to a peak at the end of
the RV systolic period (Figure 4A and 4C and Figure 6A).
The RV diastolic period has three components, beginning
with a sharp decline in P
RA
(y-descent; Figure 4A and Fig-
ure 6A) with a modest decline in V
RA
. This is followed by
a period of diastasis, where pressure increases slightly as
does V
RA
due to Q
VC
. Finally, atrial contraction ensues
with increasing P
RA
and a relatively strong decrease in V
RA
(Figure 4A and 4C and Figure 6A). This completes the
upper RV diastolic portion of the RA P-V loop, where dias-
tole and systole are defined relative to the RV mechanical
cycle. Time is implicit on these atrial P-V loops, increasing
in a counterclockwise fashion over the cardiac cycle.
Atrial P-V loops show general movement upward and to
the left, toward higher atrial pressures and lower mini-
mum volumes (Figure 6A and 6B). This is especially true
for the RA, where with progression of tamponade there is
a steady decline in the minimum volume point on the
loop. The maximum RA volume point also declines
slightly with higher level of tamponade (compare maxi-
mum volume in Figure 4C and 4D). The flattened appear-
ance of the RA loops of Figure 6A with minimum chamber
volume reaching very low levels convey a powerful image
of the constrictive effect of pericardial effusion on thin-
walled heart chambers. The slope of the y-descent declines
in the RA P-V domain (Figure 6A) with increasing tam-
ponade, and the y-descent is followed by a slowly increas-
ing pressure for the remainder of the RV diastolic interval
(upper portion of the loop). A slow v-wave follows a
delayed and reduced x-descent feature in the systolic por-
tion of the RA P-V loop. P
RA
remains relatively constant
over the latter portion of the RV systolic interval. V
RA
excursion is increased in tamponade relative to control.
Progressive pericardial constraint is associated with eleva-
tion of P
LA
and flattening of atrial P-V loops (Figure 6B).
With increasing effusion (Figure 6C and Figure 6D), the
ventricles exhibit a rise in diastolic pressure and a reduc-
tion in volume and pressure excursion. In tamponade and
during the ventricular filling phase, the complex changes
in the P
PERI
waveform sculpt the diastolic P-V relationship
including the notching effect observed in Figure 6C.
Section Summary
Graded increases in pericardial volume simulate tampon-
ade hemodynamic changes both at the right and left heart.
The right heart hemodynamic changes can be summa-
rized as follows: 1) the pericardial pressure tracks the
chamber pressures and not the pleural pressure; 2) RA fill-
ing is delayed and diminished such that the x-descent
occurs after the onset of RV ejection, rather than at the
onset of RV isovolumic contraction; 3) the early diastolic
filling (E-wave) is diminished and the late filling (A-wave)
assumes greater proportion, due to a markedly decreased
vena cava D-component; 4) atrial filling is restricted sig-
nificantly to ventricular systole, in contrast to the normal
filling during both ventricular systole and diastole, lead-
ing to a diminished or absent y-descent. The left heart
hymodynamics are altered in parallel. Informative find-
ings of these changes in tamponade are well visualized
with atrial and ventricular P-V loops. There is evidence
Table 2: Diastolic and Systolic Venous Return Volumes with
Pericardial Effusion
V
PERI
(ml) Right Left
V
VC,D
V
VC,S
D/S Vol. Ratio V
PV,D
V
PV,S
D/S Vol. Ratio
15 (control) 55.0 22.6 2.43 37.5 55.4 0.68
700 48.8 24.4 2.00 33.5 54.7 0.61
800 37.0 27.4 1.35 26.0 53.0 0.49
900 20.7 30.7 0.67 16.6 48.5 0.34
1000 8.5 31.5 0.27 10.4 42.1 0.25
Venous return volumes during diastole and systole and the diastolic-
to-systolic (D/S) volume ratios for increasing levels of effusion. For
the right heart, vena caval return volume is given by V
VC,D
for diastole
and V
VC,S
for systole. Similarly for the left heart, pulmonary venous
return volume is given by V
PV,D
for diastole and V
PV,S
for systole. The
D/S volume ratio decreases with increasing effusion.
Theoretical Biology and Medical Modelling 2009, 6:15 />Page 11 of 28
(page number not for citation purposes)
>11% pulsus paradoxus and atrial collapse (34% RA, 20%
LA). The CO and MAP are compromised and there is dem-
onstration of baroreflex activation and tachycardia.
Importantly, the pericardial pressure waveform in tam-
ponade reflects local volumetric changes in the heart
chambers, in particular the diastolic and systolic dips in
pressure, which in turn influence the filling capability of
the chambers. As a result of this pericardial constraint,
venous return to the atria is progressively higher in systole
rather than in diastole, as the ventricles are contracted and
the heart occupies less volume, producing atrioventricular
interaction that largely determines the heart's filling vol-
ume.
Effects of Respiration
During inspiration, there is an increase in venous return to
the right atrium. Lowered intrathoracic pressure on inspi-
ration lowers pressure in intrathoracic systemic veins,
pericardium, and cardiac chambers. Consequently, flow
from extrathoracic systemic veins is increased and more
blood flows to the right heart. This augmented blood flow
appears in the left heart two to three beats later (during
expiration for a person at rest), i.e., the "transit time" for
blood to travel through the pulmonary vasculature
[16,17]. In severe tamponade, the high P
PERI
due to effu-
sion creates a competition for filling space, which
increases interaction between the ventricles. During the
inspiratory increase in systemic venous return, filling of
the left heart is compromised, lowering LVSV and aortic
pressure [3,6,17,33]. Alternately, during expiration, left
heart filling is favored over the right heart. The resulting
variation in LVSV can cause more than a 10% variation in
arterial pressure with inspiration, or pulsus paradoxus [3].
In our model, the critical pericardial effusion volume for
production of pulsus paradoxus at normal breathing lev-
els is 950 ml.
Chamber Pressure-Volume RelationshipsFigure 6
Chamber Pressure-Volume Relationships. Pressure-volume (P-V) relationships in the four chambers for control (no effu-
sion), 900 ml effusion, and 1000 ml effusion. The RA pressure-volume loop is particularly altered with effusion, with a delayed
and reduced x-descent, flattened y-descent, elevated pressure, and greater emptying. The left atrium displays similar character-
istics to a lesser degree. P-V ventricular loops demonstrate chamber compression and show increasingly reduced stroke out-
put and higher diastolic pressures. Atrial contraction causes a dip in pericardial pressure, drawing down RV pressure as well
which causes a notching effect in the diastolic portion of the RV loop.
Right Heart Left Heart
P
LV
(mmHg)
P
RV
(mmHg) P
RA
(mmHg)
P
LA
(mmHg)
V
LV
(ml)V
RV
(ml)
V
RA
(ml) V
LA
(ml)A
C
B
D
a
v
y
x
Dias.
Sys.
Theoretical Biology and Medical Modelling 2009, 6:15 />Page 12 of 28
(page number not for citation purposes)
To analyze the effect of respiration on hemodynamics,
three sinusoidal breathing patterns (with modulation of
depth and excursion) were used in the model and the per-
centage variation between expiration and inspiration for
inlet, outlet, and transvalvular flows was calculated. Fig-
ure 7 shows the different levels of respiration and associ-
ated percent variation. With greater excursion and lower
P
PL
on inspiration, overall respiratory variations increase.
In the control case (Figure 7A), right heart flows (Q
VC
,
Q
TC
, Q
PA
) have much greater respiratory variation than
the left (Q
PV
, Q
M
, Q
AO
). For example, at different levels of
respiratory effort, the flow variations at the tricuspid valve
(Q
TC
) range from 23–43%, whereas the flow variations at
the mitral valve (Q
M
) range from 5–13%. With severe
tamponade, the flow variations at the tricuspid valve
range from 21–40%, but the flow variations at the mitral
valve increase its range to 12–37% (Figure 7B). The
increased flow variation at the left heart has been used as
a clinical index for hemodynamic important pericardial
effusion or cardiac tamponade [1,34]. These comparable
levels of respiratory variation on the right and left sides are
strong indicators of increased ventricular interaction, as
discussed later.
Pulsus Paradoxus
Figure 8 shows the presence of pulsus paradoxus with
effusion. The control case demonstrates 7.3% distal aortic
pressure variation with respiration level -1 to -10 mmHg
(Figure 8G). Effusion increases pulse pressure variation to
11.8% (Figure 8H), but the depth of breathing influences
the level of variation, as shown by an increased variation
of 16.3% with deeper inspiration to -15 mmHg (Figure
8I). With severe tamponade (1000 ml effusion), pulmo-
nary arterial pressure (P
PA
) is increased and shows less
pressure excursion due to the increase in pulmonary
blood pooling (discussed below), but P
AO
is decreased
due to the decline in cardiac output and the respiratory
variation increases. Hence, there are opposing effects with
pericardial constraint on the pulmonary and aortic pres-
sures. However, increased respiratory variation increases
pressure variation at both sides (Figure 8F and 8I).
Interventricular Septum
Septal motion in tamponade has been studied in an effort
to suggest mechanisms underlying abnormal hemody-
namics and respiratory variation [18]. We first present the
septal model followed by our model results with regard to
septal contribution in tamponade.
Septal Model
The septal model we have employed encompasses septal
motion for the complete cardiac cycle, mimicking bipha-
sic motion as noted by others [13,14]. As detailed in our
own studies [12,35], a storage compartment of volume
V
SPT
is defined as the volume bound by the current septal
position and its unstressed position (Figure 1A), where
positive and negative V
SPT
indicate rightward and leftward
septal curvature, respectively. LV volume is therefore
Flow Variation with Different Respiratory ExcursionsFigure 7
Flow Variation with Different Respiratory Excursions. Percent variation between inspiratory and expiratory flows for
different breathing waveform excursions (e.g., -2 to -6 mmHg) for control (Panel A) and tamponade (Panel B). As respiratory
excursion increases, respiratory variation increases for all flows. Under control conditions, respiratory variation is significantly
higher in the right heart than in the left. However, with severe tamponade, the level of respiratory variation in the left heart
increases, becoming more comparable to that of the right heart. (QVC = vena cava flow; QTC = tricuspid flow; QPA = pulmo-
nary artery flow; QM = mitral flow; QAO = aortic flow).
Respiratory Excursion (mmHg)
%Respiratory Variation
Control 1000ml Effusion
Theoretical Biology and Medical Modelling 2009, 6:15 />Page 13 of 28
(page number not for citation purposes)
defined as the volume bound by the LV free wall and the
unstressed septum plus V
SPT
, and RV volume is defined as
the volume bound by the RV free wall and the unstressed
septum minus V
SPT
. The transmural pressure P
SPT
is
defined as the difference between P
LV
and P
RV
. There is a
systolic and diastolic phase in the pressure-volume (P-V)
relationship for the septal compliant compartment, linear
in systole, nonlinear in diastole. Secondly, the septum
undergoes active contraction synchronized with RV and
LV free wall contraction in systole, behaving as a third
pump. Septal activation and the trans-septal pressure gra-
dient both shape septal motion.
We find that a biphasic definition of the septal P-V rela-
tionship controlled by a septal activation function in a
cardiac cycle is essential to accurately model a normal LV
and RV pressure profile. Three septal models were simu-
lated: a) a linear P-V relationship as observed in end-sys-
tole [36] and held throughout cardiac cycle – this models
a stiff septum such as an akinetic septum b) a nonlinear P-
V relationship applicable to end-diastole [35] and held
throughout cardiac cycle – this models a compliant mem-
brane such as a septal aneurysm c) a linear P-V relation-
ship in end-systole and nonlinear P-V relationship in end-
diastole and a combination of the two for the remaining
cardiac cycle determined by a time-dependent activation
function [35] – the current active septal model. Cases a
and b are passive septal models, with V
SPT
independent of
time, whereas case c treats the septum as an active pump
synchronous to the active RV and LV free wall pumps. Fig-
ure 9 shows ventricular pressures and V
SPT
for the three
cases. With passive septum case a, the septum is highly
non-compliant and approximately fixed at neutral posi-
tion (Figure 9G). Systolic behavior in P
RV
and P
LV
is diver-
gent to that observed experimentally [11,33], with an
upward slope in P
RV
(Figure 9A) and a distorted P
LV
(Fig-
Arterial Pressure Respiratory VariationFigure 8
Arterial Pressure Respiratory Variation. Model-generated distal arterial pressure for the right (pulmonary arterial pres-
sure (P
PA
)) and left (aortic pressure (P
AO
)) heart. In the control case for the left heart with respiratory excursion of -1 to -10
mmHg, 7.3% variation exists (Panel G). With the same breathing pattern, aortic pressure drops and an 11.8% pressure varia-
tion exists (Panel H), indicating pulsus paradoxus. For the right heart, pressure elevates and variation decreases with effusion
(compare Panels D-E). With a deeper breathing pattern (-1 to -15 mmHg), variation increases in both cases (Panels F and I).
Control
P
PL
(mmHg)
1000ml Effusion
'
Time (s)
P
AO
(mmHg)
ϯϳ͘ϴй
ϳ͘ϯй
džƉ͘
/ŶƐƉ͘
džƉ͘
/ŶƐƉ͘
džƉ͘
/ŶƐƉ͘
Ϯϴ͘ϲй
ϭϭ͘ϴй
ϯϵ͘ϱй
ϭϲ͘ϯй
P
PA
(mmHg)
1000ml Effusion
(Deeper Respiration)
,
&
/
Theoretical Biology and Medical Modelling 2009, 6:15 />Page 14 of 28
(page number not for citation purposes)
ure 9D). Similarly with the passive septum of case b, the
septum is strongly bowed right, and its movement is
shaped by the left-to-right trans-septal gradient, thereby
mirroring the shape of P
LV
(Figure 9H). Systolic P
RV
is
sloped upward, higher than normal (Figure 9B), systolic
P
LV
is flattened and diastolic P
LV
is heightened (Figure 9E).
The active septum of case c displays the opposing slopes
in systolic ventricular pressures as seen in canine [37] and
clinical data [11] (Figure 9C and 9F), and a large septal
leftward thrust as observed experimentally [13,14] to the
near-neutral position is seen in systole (Figure 9I). The
septum moves slowly rightward in diastole, coincident
with increasing left-to-right pressure gradient, and when
free wall contraction commences, the septum also begins
to contract pushing further into the right ventricle before
the leftward thrust. "Septal priming" prior to LV ejection
initiates RV outflow movement and a lengthened RV ejec-
tion is observed. At the end of systole, the septum recoils
toward the RV giving an extra boost to RV stroke output,
before pulmonic valve closure. Thus pulmonic valve clo-
sure is delayed by an active septum and septal assistance
to RV systolic function [37] can be pinpointed to these
two occurrences, both of which are not present in cases a
and b, which may be hemodynamically significant.
P-V loops of the four cardiac chambers are given in Figure
10 for all three cases. For case a, the stiff septum in the
neutral position reduces the size of LV (Figure 10D),
Comparison of Septal ModelsFigure 9
Comparison of Septal Models. Ventricular and arterial pressures and septal volume for three septal models – case a: pas-
sive septum with linear end-systolic pressure-volume relationship (ESPVR) held throughout cardiac cycle (Panels A, D, G); case
b: passive septum with nonlinear end-diastolic pressure-volume relationship (EDPVR) held throughout cardiac cycle (Panels B,
E, H); case c: active septum with linear ESPVR and nonlinear EDPVR modulated by a septal activation function in the cardiac
cycle (Panels C, F, I) (see text for details). For case a, the septum is highly noncompliant and nearly fixed at neutral position.
This curtails systolic P
LV
and creates an abnormal upward slope in systolic P
RV
. Case b severely bows the septum rightward and
the relatively stiff septum, whose movement is subject only to left-to-right trans-septal gradient, mirrors P
LV
. Systolic P
RV
is high
due to rightward septal position during systole. With the active septum of case c, systolic ventricular pressures have opposing
slopes as seen in clinical data [11]. The septum is activated at systole to produce a strong leftward thrust (D = Diastole, S =
Systole).
Passive Septum
(ESPVR Only)
Pressure
(mmHg)
Passive Septum
(EDPVR Only)
Time (s)
V
SPT
(ml)
&
Active Septum
(Control)
DS
DS
DS
Pressure
(mmHg)
'
,
/
P
RV
P
PA
P
RV
P
PA
P
RV
P
PA
P
LV
P
AO
P
LV
P
AO
P
LV
P
AO
Theoretical Biology and Medical Modelling 2009, 6:15 />Page 15 of 28
(page number not for citation purposes)
increasing end-diastolic P
LV
and restricting LV filling,
while increasing systolic P
RV
due to no leftward move-
ment, and providing no aid to RV ejection (Figure 10C).
Alternately in case b, the relatively stiff and severely right-
ward-bowed septum expands V
LV
and reduces V
RV
overall,
greatly increasing systolic P
RV
and playing a limited role in
ventricular ejection (Figure 10C–D). In both cases, the
reduced cardiac output decreases P
RA
(Figure 10A) and
end-diastolic P
RV
(Figure 10C). On the other hand, uncir-
culated blood accumulates in the pulmonary vasculature
increasing P
LA
(Figure 10B). Increased RV stroke volume
of case c over cases a and b is clearly demonstrated by the
P-V loops analysis.
Septal Motion in Tamponade
As mentioned previously, the active septum (case c in the
previous section) has been employed consistently in this
modeling study. To better analyze septal contribution to
tamponade, plots of septal volume (V
SPT
) can be used to
track septal movement, where septal volume is defined as
the volume offset from the neutral septal position (see
Figure 1B), in which positive V
SPT
indicates a rightward-
shifted septum, and negative V
SPT
indicates a leftward
shift. Due to the overall left-to-right trans-septal pressure
gradient, the healthy septum is bowed rightward and V
SPT
is always positive. Septal volume is shown in Figure 11K–
L for control and 1000-ml effusion cases, respectively. In
early systole, the left-to-right pressure gradient produces
an initial rightward septal movement (Figure 11K). Septal
activation synchronous with ventricular free wall activa-
tion and subsequent isovolumic contraction during the
pre-ejection period (PEP) produces leftward movement
against the gradient which continues when the aortic
valve opens (see label on Figure 11A). With aortic valve
Chamber Pressure-Volume Relationships using Different Septal ModelsFigure 10
Chamber Pressure-Volume Relationships using Different Septal Models. P-V relationships for the four cardiac cham-
bers shown for three septal model cases – case a: passive septum with ESPVR only (red); case b: passive septum with EDPVR
only (blue); case c: active septum with ESPVR and EDPVR modulated by an activation function (see text for details). For case a,
the stiff, unstressed septum reduces V
LV
, increasing end-diastolic P
LV
and restricting LV filling, while increasing systolic P
RV
due
to no leftward movement, and not contributing to RV ejection. In case b, the less-compliant, rightward-shifted septum expands
V
LV
and reduces V
RV
overall, increasing systolic P
RV
and contributing little to ventricular ejection (Panels C-D). In both cases,
the reduced cardiac output decreases P
RA
(Panel A) and end-diastolic P
RV
(Panel C). Reduced stroke volume causes blood to
accumulate in the pulmonary bed, increasing P
LA
(Panel B).
Right Heart Left Heart
P
LV
(mmHg)
P
RV
(mmHg) P
RA
(mmHg)
P
LA
(mmHg)
V
LV
(ml)V
RV
(ml)
V
RA
(ml) V
LA
(ml)A
C
B
D
Theoretical Biology and Medical Modelling 2009, 6:15 />Page 16 of 28
(page number not for citation purposes)
closure and septal deactivation synchronous with free
wall deactivation, there is a left-to-right trans-septal pres-
sure gradient producing the characteristic opposing slopes
in systolic P
RV
and P
LV
(see Figure 11C and 11E), moving
the septum rightward. This movement serves to enhance
RV stroke volume [37] and consequently improve LV fill-
ing through greater LV filling space. The onset of diastole
is signaled by the opening of the tricuspid and mitral
valves (Figure 11G and 11H) and the septum remains pas-
sive throughout diastole moved by the much smaller
trans-septal pressure gradients set up by the early and late
inlet flows to both ventricles [12]. P
PERI
(Figure 11A),
tracking the low-amplitude intrathoracic pressure, has no
significant influence in shaping cardiac pressures within
the cardiac cycle. In severe tamponade however, P
PERI
bears a cardiac variation (Figure 11B) controlling cham-
ber pressures, particularly those of the more compliant
right heart. P
PERI
undergoes a systolic dip in pressure (see
label on Figure 4B) drawing down P
RV
prematurely and
closing the pulmonic valve (Figure 11F). Meanwhile, P
LV
displays a prolonged PEP that is associated with a delayed
aortic valve opening (Figure 11D). Systolic ejection is fur-
ther desynchronized in the two ventricles as compared to
the control. The septum moves rightward due to the initial
Relation of Septal Motion to HemodynamicsFigure 11
Relation of Septal Motion to Hemodynamics. Septal movement is tracked by plotting septal volume V
SPT
vs. time, in
which positive V
SPT
is rightward septal position, zero V
SPT
is the unstressed or neutral septal position, and negative V
SPT
is left-
ward septal position. Pericardial pressure shown in control (Panel A) and 1000 ml effusion cases (Panel B) during inspiration.
Remaining panels show LV pressure (Panels C-D), RV pressure (Panels E-F), tricuspid flow (Panels G-H), mitral flow (Panels I-
J), and septal volume (Panels K-L). LV systolic and diastolic intervals are indicated by dashed vertical lines, coincident with
mitral valve opening and closure. The ejection times are offset in the two ventricles, with late aortic valve opening (AO) coin-
cident with delayed septal leftward thrust and early pulmonic valve closure (PC) with premature reduction in P
RV
due to P
PERI
systolic dip. The septum remains left-shifted at the start of right ventricular filling. With rightward septal movement upon deac-
tivation (bold arrows in Panels E-F and K-L) flow is interrupted and a split E-wave is produced (see text for details). (AO = aor-
tic valve opening, AC = aortic valve closure, PO = pulmonic valve opening, PC = pulmonic valve closure)
P
LV
(mmHg)
Q
TC
(ml/s)
V
SPT
(ml)
Time (s)
Control 1000ml Effusion
&
',
P
RV
(mmHg)
/:
Q
M
(ml/s)
Dias. Sys.
Dias. Sys.
AO
AO
AC
PO
PC
AC
PO
PC
<>
P
PERI
(mmHg)
Theoretical Biology and Medical Modelling 2009, 6:15 />Page 17 of 28
(page number not for citation purposes)
systolic left-to-right trans-septal gradient (Figure 11L).
This is followed by PEP with associated leftward septal
movement. There movement shows a reduced downward
slope in concert with an increased isovolumic period
(compare Figure 5E with F, and Figure 11C with D). On
ejection, the septum actively supports the LV stroke out-
put with a leftward movement. The mid-systolic decline in
P
RV
is associated with an early positive atrioventricular
gradient across the tricuspid valve with resultant early
inlet flow (Figure 11H), while the septum still remains
left-shifted (Figure 11L). Therefore the tricuspid and
mitral transvalvular flow initiations are also desynchro-
nized. Comparing the late systolic ejection period, the
right septal movement under normal situation occurs
before the pulmonic valve closure, thus the septal move-
ment has a functional component in assisting RV output
(arrows in Figure 11E and 11K) [37]. In contrast, in tam-
ponade, the right septal movement (Figure 11L) in late
systolic cycle occurs at a time when the pulmonic valve
has already been closed. Thus the septal movement con-
tributes nothing to RV outflow in tamponade. Rather, it
causes a brief increase in P
RV
(arrows in Figure 11F and
11L), which reduces the AV gradient and interrupts RV fill-
ing. This interruption of early diastolic Q
TC
is observed as
a split E-wave (Figure 11H). Comparing Figure 11K and
11L, diastolic septal volume is reduced, indicating an
overall leftward shift in septal position.
In severe tamponade, the abnormal prolongation of PEP
in P
LV
bears a respiratory variation that can be observed in
both canine [18] and clinical data [33,38]. Figure 12
shows digitized record of analog data reported in a cardiac
tamponade case by Murgo et al. [33], where plots of P
LV
and aortic root pressure (P
AO
) during expiration (solid
line) and inspiration (dashed line) are overlaid for the
two cases post-pericardiocentesis (control) and pre-peri-
cardiocentesis (1000 ml effusion). We note from this data
that the isovolumic relaxation phase remains unchanged
throughout the respiratory cycle; hence we have aligned
single cycles of P
LV
in inspiration and expiration relative to
this phase and in particular with aortic valve (AOV) clo-
sure. In control, respiratory effects are minor as reported
in [38]. With tamponade (Figure 12B) pressures fall sig-
nificantly in systole, PEP is slowed, and ejection time is
reduced (see Table 3).
Model-generated results reveal a similar respiratory effect
on P
LV
with tamponade (Figure 13). Figure 13 relates P
LV
,
V
LV
and septal volume under conditions of control and
severe tamponade. The influence of respiration on these
waveforms is shown in terms of single cycles of overlaid
tracings during expiration, inspiration and breath-holding
at mean P
PL
. Minor respiratory variations in LV end-
diastolic volume (LVEDV) and diastolic V
SPT
are apparent
in Figure 13C and 13E, with maximum V
LV
and septal
rightward shift during expiration. Systolic respiratory var-
iation is negligible. For the tamponade case, with inspira-
tion, PEP is prolonged (Figure 13B) and aortic valve
opening (AO) is delayed. Reduction in magnitude of
LVEDV and its increased respiratory variation is evident
(compare Figure 13C and 13D). The upstroke phase in P
LV
is correspondingly marked by a delayed leftward septal
movement (Figure 13F), as V
SPT
bears a reduced down-
ward slope until AO, when septal movement can once
again support ejection with strong leftward movement.
With pericardial effusion, the combined effect of pro-
longed PEP and increase in heart rate shortens the LV ejec-
tion time (LVET) as noted in [38]. LVET is greatest in
expiration and lowest in inspiration as evident in Figure
11, with a respiratory variation of 3% in control and 28%
in severe tamponade (Table 3). Prior to ejection, LV filling
volume varies as shown by respiratory variation in LVEDV
of 6% in control and 19% in tamponade. As a result of
both of these effects, LV stroke volume (LVSV) on inspira-
tion is reduced by 5% in control and 26% in tamponade
compared to expiration.
Respiratory variation occurs in RV ejection time (RVET) as
well, but with an increase in RVET of 3% for control and
13% for tamponade on inspiration compared to expira-
tion. RV end-diastolic volume (RVEDV) varies by 26% for
control and 49% for tamponade. RV stroke volume
(RVSV) also varies by 39% for control and 59% for tam-
ponade with maximum RVSV at inspiration. As can be
noted to occur with tamponade, ejection time is more var-
ied in the LV than the RV [32], but end-diastolic volume
varies more in the right. The combined effect of both gives
a variation in stroke volume that is greater in the right.
Results are tabulated in Table 3.
With tamponade, septal motion reflects abnormal hemo-
dynamics associated with the pericardial constraint, i.e.,
the asynchrony and shortening of RV and LV ejection
times which is exacerbated with inspiration. It should be
noted that the use of term asynchrony to describe differ-
ent ejection intervals should not be confused with asyn-
chrony of electrical conduction through ventricles, as
ventricular activation functions in the model are synchro-
nized in time.
Pulmonary Vasculature
The pulmonary vasculature serves as a blood reservoir
connecting the left and right hearts. In severe tamponade,
pulmonary blood pooling is observed by a 20% increase
in mean pulmonary vascular volume (compare Figure
14C and 14D). In the control scenario (Figure 14C), pul-
monary volume displays two peaks in a cardiac cycle, the
upward stroke in the major peak associated with RV systo-
lic ejection, followed by a second upward stroke and
Theoretical Biology and Medical Modelling 2009, 6:15 />Page 18 of 28
(page number not for citation purposes)
minor peak associated with pulmonary venous reversal
flow from the left atrium at the end of diastole [39]. In
tamponade, this pattern is seen with reduced excursion in
volume (Figure 14D), as a result of reduced RV stroke vol-
ume and elevated left heart pressures due to pericardial
constraint. Left heart compression prevents normal
venous return, possibly correlated with the accumulation
of blood in the pulmonary vasculature. This is particularly
true in inspiration as seen with the corresponding P
PL
waveforms (Figure 14A–B). Pulmonary venous return
occurring during the downward stroke of the major peak
exhibits a distinct two-phase return, i.e., systolic and
diastolic return. Left heart AV interaction is evident with
this feature, with increasingly prominent systolic return
and diminished diastolic return.
Gas Exchange
Model-generated acid-base balance in the lungs and alve-
oli, peripheral tissue, and brain were monitored for
changes due to tamponade. For increasing levels of effu-
sion, cardiac output was plotted against O
2
and CO
2
par-
tial pressures, percent saturation, and arterio-venous (A-
V) percent concentration differences (Figure 15), averaged
over a respiratory cycle, modeled after a canine study [40].
Partial pressures were taken at the exit end of the tissue,
i.e., venous pressures in peripheral tissue and brain, and
arterial end of lung. Table 4 shows numerical values for
key indices for control and severe tamponade. With tam-
ponade, peripheral tissue reflects reduced blood oxygena-
tion with lowered venous PO
2
, increased venous PCO
2
,
and reduced SO
2
(Figure 15B and 15E). Furthermore there
is increased A-V difference in CO
2
. Situations of lowered
Digitized Recordings of Left Ventricular Variation in Respiratory CycleFigure 12
Digitized Recordings of Left Ventricular Variation in Respiratory Cycle. High-fidelity micromanometer recordings of
left ventricular (P
LV
and aortic pressure (P
AO
) before and after pericardiocentesis, digitized from clinical data published in [33].
Control (Panel A) is assumed to be post-pericardiocentesis. In both panels, a single cardiac cycle during expiration has been
overlaid with a single cardiac cycle during inspiration, aligned at aortic valve closure for comparison. In the control case (Panel
A), pressures drop slightly on inspiration. With tamponade (Panel B) pressures fall significantly in systole, pre-ejection period is
delayed in cardiac cycle, and ejection time is reduced. Data from Murgo et al. [33], specifically, Figs. 2–3, pp. 193–4.
Control
Tamponade
Pressure (mmHg) Pressure (mmHg)
Time (sec)
P
AO
P
LV
P
AO
P
LV
Theoretical Biology and Medical Modelling 2009, 6:15 />Page 19 of 28
(page number not for citation purposes)
cardiac output have been shown to exhibit increased A-V
difference in CO
2
[41-43] as well as increased venous
PCO
2
[41,42] due to a combination of arterial hypocapnia
and venous hypercapnia. This is a result of slower blood
flow causing accumulation of CO
2
[44]. Reduced cardiac
output causes a state of hypoperfusion, lowering O
2
deliv-
ery to tissue demonstrated by PO
2
and SO
2
reduction. The
lung tissue reflects these changes to a lesser extent. The cer-
ebral circuit model on the other hand is autoregulated to
maintain cerebral blood flow [26]. With hypercapnia, cer-
ebral blood flow increases to improve oxygenation and
increase CO
2
washout, as shown by the maintenance of A-
V difference in CO
2
as well as PO
2
, SO
2
, and O
2
A-V differ-
ence. Control values for partial pressure (Table 4) vary
from previously reported values [11] as a different respira-
tory pattern has been used in this study. The lower inspir-
atory P
PL
causes more gas intake and the relatively longer
expiratory phase releases higher levels of CO
2
. The simu-
lation results suggest that in severe tamponade a deeper
respiratory pattern would tend to counteract the hypoxic
effect of lowered cardiac output with greater oxygenation
and CO
2
removal. Further investigation of breathing pat-
terns seen in tamponade patients is suggested by these
model observations.
Section Summary
Respiration produces variation in cardiac pressures and
flows. While in the control case respiration predomi-
nantly affects the right heart, with pericardial effusion, left
heart respiratory variation becomes more significant and
comparable to right heart respiratory variation. Pulsus
paradoxus is present with 1000 ml effusion, with systolic
blood pressure variation increasing further with deeper
inspiration.
Modeling the biphasic motion of the septum, in which
the septum actively recoils rightward and thrusts leftward
during systole, is possible only with an active septal
model, as demonstrated by comparison to two passive
septum models. Motion of the active septum demon-
strates the mechanisms for prolonged LPEP, shortened
ejection times, and right-left asynchrony of filling and
ejection periods.
The pulmonary vasculature demonstrates blood volume
congestion in tamponade, in association with the elevated
chamber pressures, and decreased equilibrium cardiac
output.
Demonstration of gas exchange variation with pericardial
effusion yields observations consistent with literature on
cardiac failure revealing the state of hypoperfusion in tam-
ponade.
Mechanism of Pulsus Paradoxus
Shabetai, et al. [6,17] concluded that the mechanistic
explanation for the inspiratory LV stroke volume (LVSV)
drop in pulsus paradoxus is the increase in right heart
venous return. We conducted two virtual experiments
using the H-CRS model to examine this hypothesis,
namely that right heart venous return is the primary cause
for a change in LVSV. Two possible types of right-left inter-
action (parallel and series ventricular interaction) are
demonstrated and their relative contributions to pulsus
paradoxus are assessed.
Experiment 1: Effect of Increased Right Heart Venous Return
A virtual experiment based on the canine study of Sha-
betai et al. [17] was performed to observe the effect of
increased right heart venous return on the hemodynamics
of the left heart independent of respiration. Specifically, at
Table 3: Model-Generated Ejection Time and Volume Indices During Various Phases of the Respiratory Cycle
P
PL
(mmHg)
Control
(Cardiac Period = 0.96 sec)
1000 ml Effusion
(Cardiac Period = 0.84 sec)
RVET
(sec)
RVED
V (ml)
RVSV
(ml)
RPEP
(sec)
LVET
(sec)
LVED
V (ml)
LVSV
(ml)
LPEP
(sec)
RVET
(sec)
RVED
V (ml)
RVSV
(ml)
RPEP
(sec)
LVET
(sec)
LVED
V (ml)
LVSV
(ml)
LPEP
(sec)
Exp.
(-1)
0.37 133.2 77.7 0.12 0.29 134.1 98.3 0.21 0.23 54.3 42.0 0.11 0.25 92.9 64.6 0.20
Insp.
(-10)
0.38 168.4 108.3 0.08 0.28 126.5 90.8 0.23 0.26 80.7 66.6 0.04 0.18 75.3 48.0 0.28
% Diff. 2.7 26.4 39.4 -33.3 -3.5 -6.0 -7.6 9.5 13.0 48.6 58.6 -63.6 -28.0 -19.0 -25.7 40.0
RV and LV ejection time (RVET and LVET), RV and LV end-diastolic volume (RVEDV and LVEDV), RV and LV stroke volume (RVSV and LVSV), and
RV and LV pre-ejection period (RPEP and LPEP) for expiration and inspiration. Percent difference with respect to expiration is given. Respiratory
variation is increased with tamponade, with reduced ejection time, end-diastolic volume, and stroke volume and increased pre-ejection period on
inspiration seen in the left heart, but opposite effects in the right heart.
Theoretical Biology and Medical Modelling 2009, 6:15 />Page 20 of 28
(page number not for citation purposes)
a constant P
PL
of -3 mmHg, a triangular volume pulse of
venous return to the right atrium mimicking a single
inspiratory increase in venous return was introduced in
the model and tracked over several heart cycles. In the
control case, the volume pulse caused a 4-mmHg increase
in pulmonary arterial pressure followed three beats later
by a 10-mmHg increase in aortic pressure. However,
under conditions of severe tamponade, the same volume
pulse caused a 5-mmHg increase in pulmonary arterial
pressure and a simultaneous 5-mmHg drop in aortic pres-
sure, followed by a 9-mmHg increase from baseline in
aortic pressure three beats later. The stroke volume varia-
tion demonstrated takes place over a period of roughly 7
seconds, or the duration of a single breathing cycle, and
the arterial pressure excursion matches that seen in a sin-
gle breath. This experiment demonstrates two effects of
increased venous return that are exaggerated in tampon-
ade: the immediate drop in LVSV as well as an increase in
LVSV occurring three beats later.
Experiment 2: Isolated Series and Parallel Ventricular Interactions
The second experiment involved isolation of the two ven-
tricular interaction mechanisms for analysis of their rela-
tive contributions to LVSV variation. To study series
interaction alone, the septum was stiffened 100× from
control to eliminate parallel ventricular interaction via the
septum. Secondly, P
PERI
was held at mean pressure to
eliminate parallel interaction via the pericardium. Nor-
mally in series interaction, inspiration increases RVSV that
is carried over with a two-three heartbeat delay to the LV
[16,17]. The inspiratory increase in right heart venous
return was simulated with a triangular, vena caval volume
pulse as described in Experiment 1. The stiffened septum
and fixed P
PERI
served to eliminate the immediate effects
Left Ventricular Performance Variation in Respiratory CycleFigure 13
Left Ventricular Performance Variation in Respiratory Cycle. An in-depth look at respiratory variation in left ven-
tricular performance with tamponade. Model results are given for the control case and the severe tamponade case (1000 ml
effusion) in the first and second columns, respectively. One cardiac cycle displaying P
LV
and P
AO
during expiration (red), inspira-
tion (blue), and fixed mean P
PL
(black) are overlaid with alignment of aortic valve closure (Panels A-B). Panels C-D show left
ventricular volume, and Panels E-F show septal movement. In the control case, aortic valve opening (AO) and pre-ejection
period (PEP) varies with respiration; specifically, during inspiration, PEP is slowed, delaying AO, and reducing the ejection time
(Panel A). With tamponade, PEP on the whole is slowed compared to control, and the respiratory variation is exaggerated
(Panel B). The elongated PEP is also evident in V
LV
(Panel D). During the PEP, the septum hangs in the neutral position, delaying
the leftward thrust which can only start at AO (Panel F). (AO = aortic valve opening, AC = aortic valve closure, MO = mitral
valve opening, MC = mitral valve closure)
Control 1000ml Effusion
V
SPT
(ml)
V
LV
(ml)
Pressure
(mmHg)
&
Time (s)
P
LV
P
AO
P
LV
P
AO
AO
AC
AC
AO
MO
MC
MC
MO
Theoretical Biology and Medical Modelling 2009, 6:15 />Page 21 of 28
(page number not for citation purposes)
of V
RV
increase on the LV, allowing for quantification of
the series effect on LVSV. With control effusion level, the
volume pulse delivered to the right heart caused a 30.4%
perturbational increase in RVSV. After 1.5 seconds, or
roughly two heartbeats, LVSV increased by 3.3%. With
1000 ml effusion, RVSV increased by 87.8% due to the
volume pulse, followed by 25.3% increase in LVSV 1.5
seconds later (see Table 5). Thus, through the series mech-
anism alone, there was a significant increase in LVSV var-
iation during tamponade. However, the initial decrease of
LVSV is not seen when parallel ventricular (septal) inter-
action is removed.
To isolate parallel ventricular interaction, control and
severe tamponade simulations were run under conditions
of constant pulmonary venous pressure with an inde-
pendent constant pressure pump placed at the input to
the LA. This virtual setup eliminates right heart serial
influence on the left heart (i.e., venous filling conditions
for the LV are constant). The triangular venous return
pulse technique described earlier in Experiment 1 was
again employed under conditions of normal septal stiff-
ness and breath-holding at mean P
PL
. In order for a fair
comparison of the LVSV percent variation in both isolated
ventricular interaction setups, the chamber volumes in
this experiment were scaled down to match the steady-
state control stroke volume with that of the isolated series
interaction control case. The percent change from steady-
state in RVSV and LVSV was calculated for both the con-
trol and severe tamponade cases. With the perturbational
venous volume increase under normal effusion level,
RVSV increased by 41.1% and LVSV simultaneously
decreased by 2.6%. With 1000 ml effusion, RVSV
increased by 40.0% while LVSV decreased by 28.9% (see
Table 5). The percent change in LVSV is greatly increased
with tamponade. Comparing the isolated series interac-
tion experiment with that of the isolated parallel interac-
tion experiment, the percent variation caused by parallel
interaction in severe tamponade is roughly the same as
that for series interaction.
In severe tamponade, ventricular end-diastolic volumes
tend to be 180° out of phase over the respiratory cycle
[45]. Such a phasic relationship occurs as the result of par-
allel ventricular interaction and is due to the strong com-
petition for filling space in tamponade. A sinusoidal
breathing pattern was introduced for a clear calculation of
the phasic relationship between ventricular end-diastolic
Pulmonary Vascular VolumeFigure 14
Pulmonary Vascular Volume. Pulmonary vascular volume for control (Panel B) and tamponade (Panel D) cases. With 1000
ml effusion, the mean pulmonary vascular volume increases by 20.8% due to compressed ventricles. Two increases in pulmo-
nary volume take place in a cardiac cycle, namely, one due to RV ejection in systole (labeled S) and the other due to pulmonary
venous reversal flow at end of diastole (labeled D) from the left atrium. Effusion limits pulmonary venous return, resulting in
lower volume excursion per cardiac cycle and accumulation of blood in the pulmonary vasculature. Left heart atrioventricular
interaction is observed with distinct systolic and diastolic venous return phases, the diastolic/systolic volume ratio smaller than
in control. With respiration shown in Panels A-B, mean pulmonary blood is maximum on inspiration due to higher RV inflow
and lower LA outflow.
Pulmonary Vascular
Volume (ml)
Time (s)
P
PL
(mmHg)
DS
Control 1000ml Effusion
DS
Reversal Flow
RV Ejection
Reversal
Flow
RV Ejection
Theoretical Biology and Medical Modelling 2009, 6:15 />Page 22 of 28
(page number not for citation purposes)
volumes. The control case showed a phase difference
between peak RVEDV and peak LVEDV of 138°. With
heightened parallel interaction in severe tamponade, this
phase difference increased to 167°. In a virtual experi-
ment where P
LA
was controlled by a constant pressure
source, thus eliminating the series effect, the phase differ-
ence increased further to 178°.
Section Summary
The involvement of ventricular interaction in pulsus para-
doxus is examined by way of tracking the effect on both
ventricles of a vena caval volume pulse equivalent to a sin-
gle inspiratory venous return increase. Parallel and series
type ventricular interactions are isolated to compare the
contributions of each to respiratory variation in LVSV.
Model results reveal equally significant contributions to
variation in LVSV.
Discussion
We have used our large-scale model of the H-CRS to sim-
ulate the compressive effects of cardiac tamponade on
atrial and ventricular hemodynamics under conditions of
normal and elevated tidal breathing. At levels of breathing
consistent with observed breathing waveforms in severe
tamponade [17], our modeling correctly simulates a wide
range of hemodynamic waveform changes including
chamber pressure equalization, partial RA chamber col-
lapse and AV interaction (Figure 4), abnormal septal
motion, abnormal and highly varying flows (Figure 7),
and pulsus paradoxus (Figure 8). The ability to character-
ize the hemodynamic waveforms in some detail greatly
facilitates biophysical interpretation and yields insight
into mechanisms underlying cardiac tamponade. This is
particularly true of the subtle components of the right
atrial and pericardial pressure waveforms that change dra-
matically in tamponade.
Gas ExchangeFigure 15
Gas Exchange. Gas exchange indices for lung, peripheral tissue and brain for graded levels of effusion. Panels A-C show car-
diac output (CO) vs. partial pressures, Panels D-F show CO vs. percent saturation, and Panels G-I show CO vs. arterio-venous
(A-V) percent concentration difference for O
2
and CO
2
. With decreasing CO, peripheral tissue shows hypercapnia and
decrease in oxygenation with lowering PCO2, percent saturation and increased CO
2
A-V difference; opposite trends are
present for O
2
. Lung displays similar characteristics to a lesser extent. The cerebral tissue shows signs of hypercapnia but
autoregulation of cerebral blood flow limits hypercapnia and increases oxygenation, shown by minimal CO
2
A-V difference,
PO
2
and SO
2
.
Lung Peripheral Tissue Brain
Cardiac Output (L/min)
Partial Pressure (mmHg)
Partial Pressure (mmHg) Partial Pressure (mmHg)
Saturation (%)
Saturation (%) Saturation (%)
A-V Concentration Difference (%)
A-V Concentration Difference (%) A-V Concentration Difference (%)
&
',/
Theoretical Biology and Medical Modelling 2009, 6:15 />Page 23 of 28
(page number not for citation purposes)
Table 4: Model Parameters of Gas Exchange Function
Tissue Type Gas Exchange Parameter 15 ml effusion
(control)
1000 ml effusion
Lung PO
2
(mmHg) 123.4 122.0
PCO
2
(mmHg) 33.9 32.4
SO
2
(%) 98.9 99.0
A-V O
2
concentration difference (%) -4.0 -6.3
A-V CO
2
concentration difference (%) 3.9 7.1
Peripheral Tissue PO
2
(mmHg) 46.1 37.3
PCO
2
(mmHg) 40.6 44.3
SO
2
(%) 81.1 68.6
A-V O
2
concentration difference (%) 3.7 6.2
A-V CO
2
concentration difference (%) -4.5 -7.2
Brain PO
2
(mmHg) 35.4 35.4
PCO
2
(mmHg) 43.2 41.5
SO
2
(%) 65.5 66.2
A-V O
2
concentration difference (%) 6.7 6.3
A-V CO
2
concentration difference (%) -6.5 -5.8
Model parameters indicating gas exchange function in lung, peripheral tissue, and brain. The breathing pattern is the pseudo-human respiratory
waveform used in this study. With tamponade, peripheral tissue reflects effusion-induced oxygenation reduction with fall in O
2
partial pressure
(PO
2
), rise in CO
2
partial pressure (PCO
2
), and reduced O
2
percent saturation (SO
2
). There is little change in PO
2
, PCO
2
and SO
2
in the lung and
brain. A-V O
2
/CO
2
concentration difference measures the percent gas concentration difference in the arterio-venous (A-V) path. This O
2
and CO
2
concentration difference increases in lung and peripheral tissue with slower blood flow allowing more time for oxygen intake and increase in CO
2
.
A-V differences remain largely unchanged in the brain due to the built-in autoregulation mechanism of the cerebral circuit. Using the pseudo-human
respiratory waveform, control PO
2
is higher and PCO
2
is lower than previously reported model results [11] due to deeper inspiration and relatively
longer expiration. SO
2
is also slightly increased.
Table 5: Percent Changes in Stroke Volume in Isolated Ventricular Interactions
V
PERI
(ml) Series Ventricular Interaction Parallel Ventricular Interaction
% Change in RVSV % Change in LVSV % Change in RVSV % Change in LVSV
15 (control) 30.4 3.3 41.1 2.6
1000 (severe tamponade) 87.8 25.3 40.0 28.9
Percent changes in RVSV and LVSV as a result of a triangular volume pulse delivered to the vena cava under breath-holding at mean P
PL
. The results
for two experimental setups are shown, the first with isolated series ventricular interaction, the second with isolated parallel ventricular interaction
for both control (15 ml) and severe tamponade (1000 ml) effusion levels (see text for details). The percent change in LVSV increases with
tamponade. Furthermore, for the two effusion levels, the percent change in LVSV is of comparable magnitude for both types of interactions,
demonstrating that both are equally significant interactions.
Theoretical Biology and Medical Modelling 2009, 6:15 />Page 24 of 28
(page number not for citation purposes)
It should be noted that our composite model represents a
patient whose heart has normal characteristics based on
various data sources but is encased in an abnormal peri-
cardium of the patient described by Reddy et al. [3].
Therefore, qualitative and not quantitative correlation
(i.e., Figure 3) is expected.
Our modeling study presents a unique view of tamponade
ranging from the dynamics occurring in a single cardiac
cycle and how they come to play over a cycle of respira-
tion, including analysis of septal motion, valve flows,
chamber volumes, and pressures. This is largely due to our
characterization of the septum as a third contractile
pump. This premise provides the platform for atrioven-
tricular as well as right-left ventricular interactions. Our
heart model thus yields accurate representations of ven-
tricular pressures [11,12,37], including the specific septal
contribution to RV systolic ejection, unlike the case when
a passive septal model is used (see Figure 9). Moreover
our work shows that with pericardial effusion, septal
motion influences AV interaction, asynchrony of right and
left heart ejection, and reduced ejection times, which are
phenomena not demonstrated by the Sun et al. model
[27]. In addition, the respiratory section of the model is
used to provide predictions of gas exchange with pericar-
dial effusion, yielding additional insights consistent with
clinical observations on hypoperfusion. The deeper respi-
ratory pattern used in this study with asymmetric empha-
sis on expiration aids in the oxygenation of peripheral
tissue, reducing the hypoxic and hypercapnic effects of
severe tamponade. These elementary observations point
out the need for in-depth observation of spontaneous
breathing patterns in tamponade patients as well as labo-
ratory experiments that examine ventilation patterns and
effectiveness of gas transport in tamponade.
Atrioventricular Interaction
In the thin-walled right heart, clinically observed features
such as an elevated P
RA
and lack of the y-descent feature
[6] have been shown to be sensitive indicators of the effect
of pericardial constraint and increased AV interaction
[19]. The display of model-generated hemodynamic vari-
ables shown in Figure 4 and Figure 5 allow us to interpret
AV interaction and its enhancement by septal motion and
the production of pulsus paradoxus at normal levels of
breathing. With pericardial constraint, the pattern of atrial
filling is largely dependent on ventricular size, and hence
the septal position. Systolic ventricular emptying allows
for maximum atrial filling. The systolic interval has two
parts: PEP and ejection. In tamponade, LPEP increases
due to reduced preload [38] whereas RPEP is relatively
unaffected. Since the start of systole is the same for both
ventricles, this produces a disparity in the start of ventricu-
lar ejection times, slowing aortic valve opening and delay-
ing septal motion. This produces a largely labored systolic
atrial filling, with maximum atrial volume when the sep-
tum is maximally leftward. Hence, the pericardial con-
straint that produces the lock-step atrial filling with the
systolic dip of the P
PERI
waveform and ventricular filling
with the diastolic dip is further impacted by septal
motion. Elevated P
PERI
steers chamber pressures to
undergo similar variations, particularly in the relatively
more compliant right heart. In systole, the pericardial
systolic dip draws P
RV
down as well, causing a premature
pulmonic valve closure and early tricuspid flow. Nor-
mally, septal rightward motion upon deactivation admin-
isters a final aid to RV stroke output; however, due to the
premature cessation of RV systole and commencement of
tricuspid flow, this septal rightward thrust does no more
than briefly interrupt RV filling. Therefore, pericardial
constraint introduces asynchrony of outlet and AV valves,
altering the nature and stroke volume impact of septal
motion, respectively. Our simulation studies also show
that pericardial constraint alone produces abnormality in
septal mechanics regardless of the level of respiration (Fig-
ure 13), but to even greater degrees with deeper levels of
breathing.
Flow Abnormalities
Changes in flow due to tamponade were demonstrated
with the H-CRS model. Flow respiratory variation
becomes equally significant in both sides of the heart (Fig-
ure 7). Venous flows exhibit lower D/S ratios with
increased AV interaction. In transvalvular flows, there is a
clinically observed reduction [1,34] in the E-wave magni-
tude due to impaired filling in early diastole and there is
a more dominant A-wave in late diastole. In severe tam-
ponade (1000 ml), our simulations predict the existence
of a split E-wave. We have explained the genesis of the
early component of the split E wave in connection with
Figure 11, implicating early relaxation of the RV pressure
waveform and septal movement. The split E-wave occurs
only in the tricuspid flow waveform, only at high levels of
effusion (1000 ml and greater), and at low P
PL
. To our
knowledge, the split E-wave phenomenon has not been
documented in the clinical literature, and therefore it
remains a model prediction that should be examined
more closely in future studies.
Signs of Pulsus Paradoxus
With tamponade, respiratory-associated hemodynamic
fluctuation is exaggerated in the left heart, and is increas-
ingly out of phase with the right heart, signaling pulsus
paradoxus. It has been noted that deep tidal levels of
inspiration exaggerate pulsus paradoxus [8,18,31,34,46].
Elevated venous pressures in tamponade, combined with
lowered pleural pressures during inspiration, causes a rel-
atively larger atrioventricular pressure gradient in early
diastole, and hence greater fluctuations in ventricular fill-
ing with respiration compared with control. Our simula-
Theoretical Biology and Medical Modelling 2009, 6:15 />Page 25 of 28
(page number not for citation purposes)
tions confirm this with exaggerated flow and pulse
pressure variations.
Pulsus paradoxus is also a common occurrence in asthma
patients, who tend to exhibit wide respiratory excursion
and low pleural pressures on inspiration [31]. Respiratory
pattern changes are often associated with tamponade, i.e.,
dyspnea (shortness of breath) [6]. Deeper spontaneous
respiration has been observed in dog experiments with
induced pericardial effusion [17,34]. The influence of res-
piratory pattern on the level of pulsus paradoxus leads to
possible future model investigation of the respiratory-
related onset of pulsus paradoxus in cases such as asthma.
Mechanisms of Pulsus Paradoxus
Historically, pulsus paradoxus has been explained in sev-
eral ways including: (a) diaphragmatic descent on inspira-
tion causing an increase in pericardial pressure which
impedes LV filling [47]; (b) failure to transmit pleural
pressure changes to the left heart by a taut pericardium
that results in lowered pulmonary venous return
[46,48,49]; (c) increased ventricular interdependence due
to competition for filling space which increases respira-
tory variation [45]; (d) increased trans-pericardial pres-
sure on inspiration which lowers LV filling [17,45]; and
(e) inspiratory leftward septal bulge which decreases LV
ejection [18].
It is generally agreed that in tamponade with a normal
breathing pattern, inspiration produces an increase in
right heart venous return and subsequently the left heart
phenomenon of LVSV reduction [7,10,17]. This statement
describes the phenomenon of pulsus paradoxus, but not
the underlying mechanisms. Our modeling studies dig
deeper to explore putative mechanisms and we propose
that pulsus paradoxus in tamponade is the result of two
types of exaggerated ventricular interaction (series and
parallel), as well as AV interaction for each heart that
changes the operating characteristics of the ventricles. In
particular, series interaction plays a dominant role in pro-
ducing pulsus paradoxus as the normal respiratory varia-
tion in filling volumes becomes significant with overall
lowered stroke volume in tamponade. Parallel interaction
is a result of space limitations imposed by pericardial con-
straint, increasing ventricular interaction both via the sep-
tum and via the pericardium. The manifestation of this
dominant pericardial constraint as it affects chamber
mechanics is AV interaction. Pericardial constraint
increases AV interaction and results in lowered filling,
decreasing LV preload and delaying leftward septal move-
ment on systole; this shortens LVET and further reduces
stroke volume, while the abnormal septal motion
enhances AV interaction. RVET is also shortened with pre-
mature RV relaxation causing early pulmonic valve clo-
sure, and a reduction in RVSV. Thus, AV interaction in
tamponade affects chamber mechanics during diastole
directly, which carries through to affect ejection dynamics
and the septal pathway by which the ventricles interact.
The second aspect of parallel interaction is ventricular
interaction via the pericardium. Localized, respiratory fill-
ing variation in one ventricle is transmitted to the pericar-
dium as a pressure change, and hence transmitted to the
other ventricle via the pericardium. Respiration-induced
venous filling also has an important additional effect on
septal position and consequently the swing of septal
pumping. In tamponade, the leftward thrust during sys-
tole is delayed further on inspiration, bringing LVSV to a
minimum, whereas RVSV is maximum at this point with
greatest end-diastolic volume and RVET. The parallel ven-
tricular interaction mechanism alone causes a near 180°
phase difference between the RV and LV volumes in tam-
ponade.
Experiment 2 (Results section) on Isolated Series and Paral-
lel Ventricular Interactions shows that these two mecha-
nisms for ventricular interaction cause a significant
respiratory variation in LVSV with tamponade. By virtue
of the matched stroke volumes in control cases for the iso-
lated series and isolated parallel interaction experimental
setups, the contribution of each mechanism to LVSV vari-
ation could be evaluated. This comparison shows that the
contribution by the parallel mechanism (28.9% varia-
tion) is roughly the same as that of the series mechanism
(25.3% variation) (Table 5).
Theories Regarding Other Mechanisms
Other mechanisms for production of pulsus paradoxus
are quoted in various studies. Golinko, et al. [48] and
Ruskin, et al. [46] support the theory that LV filling is
impeded by a lowered and/or reversed pulmonary venous
to LA pressure gradient on inspiration, which is accompa-
nied by pulmonary blood pooling. Our simulations pre-
dict that pulmonary blood pooling is due to constriction
of the cardiac chambers. As seen in Figure 5, our virtual
experiments show that pulmonary venous reversal flow
actually decreases with effusion. Furthermore, an experi-
ment not detailed in this paper shows that the phasic rela-
tionship between RVEDV and LVEDV changes for various
breathing frequencies indicating LV volume fluctuation is
independent of pleural pressure, and dependent rather on
RV volume fluctuation. Shabetai, et al. [17] demonstrates
that LVSV decrease in pulsus paradoxus is a right-sided
phenomenon that is manifested in the left heart. Our
model results show right-sided contributions to the left
heart respiratory variation via the pulmonary vascular
pathway, via the pericardium, and via the septum. How-
ever, left heart AV interaction is also observed in our
model, in which pericardial constraint independently
alters LA and LV mechanics, thus contributing to the