Báo cáo y học: "Homeostatic mechanisms in dopamine synthesis and release: a mathematical model" pptx
Bạn đang xem bản rút gọn của tài liệu. Xem và tải ngay bản đầy đủ của tài liệu tại đây (3.11 MB, 20 trang )
BioMed Central
Page 1 of 20
(page number not for citation purposes)
Theoretical Biology and Medical
Modelling
Open Access
Research
Homeostatic mechanisms in dopamine synthesis and release: a
mathematical model
Janet A Best*
†1
, H Frederik Nijhout
†2
and Michael C Reed
†3
Address:
1
Department of Mathematics, The Ohio State University, Columbus, OH 43210, USA,
2
Department of Biology, Duke University,
Durham, NC 27708, USA and
3
Department of Mathematics, Duke University, Durham, NC 27708, USA
Email: Janet A Best* - ; H Frederik Nijhout - ; Michael C Reed -
* Corresponding author †Equal contributors
Abstract
Background: Dopamine is a catecholamine that is used as a neurotransmitter both in the
periphery and in the central nervous system. Dysfunction in various dopaminergic systems is
known to be associated with various disorders, including schizophrenia, Parkinson's disease, and
Tourette's syndrome. Furthermore, microdialysis studies have shown that addictive drugs increase
extracellular dopamine and brain imaging has shown a correlation between euphoria and psycho-
stimulant-induced increases in extracellular dopamine [1]. These consequences of dopamine
dysfunction indicate the importance of maintaining dopamine functionality through homeostatic
mechanisms that have been attributed to the delicate balance between synthesis, storage, release,
metabolism, and reuptake.
Methods: We construct a mathematical model of dopamine synthesis, release, and reuptake and
use it to study homeostasis in single dopaminergic neuron terminals. We investigate the substrate
inhibition of tyrosine hydroxylase by tyrosine, the consequences of the rapid uptake of extracellular
dopamine by the dopamine transporters, and the effects of the autoreceoptors on dopaminergic
function. The main focus is to understand the regulation and control of synthesis and release and
to explicate and interpret experimental findings.
Results: We show that the substrate inhibition of tyrosine hydroxylase by tyrosine stabilizes
cytosolic and vesicular dopamine against changes in tyrosine availability due to meals. We find that
the autoreceptors dampen the fluctuations in extracellular dopamine caused by changes in tyrosine
hydroxylase expression and changes in the rate of firing. We show that short bursts of action
potentials create significant dopamine signals against the background of tonic firing. We explain the
observed time courses of extracellular dopamine responses to stimulation in wild type mice and
mice that have genetically altered dopamine transporter densities and the observed half-lives of
extracellular dopamine under various treatment protocols.
Conclusion: Dopaminergic systems must respond robustly to important biological signals such as
bursts, while at the same time maintaining homeostasis in the face of normal biological fluctuations
in inputs, expression levels, and firing rates. This is accomplished through the cooperative effect of
many different homeostatic mechanisms including special properties of tyrosine hydroxylase, the
dopamine transporters, and the dopamine autoreceptors.
Published: 10 September 2009
Theoretical Biology and Medical Modelling 2009, 6:21 doi:10.1186/1742-4682-6-21
Received: 23 April 2009
Accepted: 10 September 2009
This article is available from: />© 2009 Best et al; licensee BioMed Central Ltd.
This is an Open Access article distributed under the terms of the Creative Commons Attribution License ( />),
which permits unrestricted use, distribution, and reproduction in any medium, provided the original work is properly cited.
Theoretical Biology and Medical Modelling 2009, 6:21 />Page 2 of 20
(page number not for citation purposes)
Background
Dopamine is a catecholamine that is used as a neurotrans-
mitter both in the periphery and in the central nervous
system (CNS)[2-4]. Important nuclei that contain
dopaminergic neurons include the substantia nigra pars
compacta and the ventral tegmental area [5]. These nuclei
send projections to the neostriatum, the limbic cortex,
and other limbic structures [3].
Dopamine is known to play an important role in many
brain functions. Dopamine affects the sleep-wake cycle
[6], it is critical for goal-directed behaviors [7] and reward-
learning [8], and modulates the control of movement via
the basal ganglia [9,10]. Cognitive processing, such as
executive function and other pre-frontal cortex activities,
are known to involve dopamine [11]. Finally, dopamine
contributes to synaptic plasticity in brain regions such as
the striatum and the pre-frontal cortex [12-14].
Dysfunction in various dopaminergic systems is known to
be associated with various disorders. Reduced dopamine
in the pre-frontal cortex and disinhibited striatal
dopamine release is seen in schizophrenic patients [15].
Loss of dopamine in the striatum is a cause of the loss of
motor control seen in Parkinson's patients [16]. Studies
have indicated that there is abnormal regulation of
dopamine release and reuptake in Tourette's syndrome
[17]. Dopamine appears to be essential in mediating sex-
ual responses [18]. Furthermore, microdialysis studies
have shown that addictive drugs increase extracellular
dopamine and brain imaging has shown a correlation
between euphoria and psycho-stimulant-induced
increases in extracellular dopamine [1]. These conse-
quences of dopamine dysfunction indicate the impor-
tance of maintaining dopamine functionality through
homeostatic mechanisms that have been attributed to the
delicate balance between synthesis, storage, release,
metabolism, and reuptake [19,20]. It is likely that these
mechanisms exist both at the level of cell populations
[21,22] and at the level of individual neurons.
In this paper we construct a mathematical model of
dopamine synthesis, release, and reuptake and use it to
study homeostasis in single dopaminergic neuron termi-
nals. It is known that the enzyme tyrosine hydroxylase
(TH), the rate limiting enzyme in dopamine synthesis, has
the unusual property of being inhibited by its own sub-
strate, tyrosine [23]. Cytosolic dopamine concentrations
are normally quite low because most dopamine resides in
vesicles from which it is released on the arrival of action
potentials. After release, dopamine is rapidly taken up by
dopamine transporters (DATs) on the terminal and it is
thought that the DATs play an important role in extracel-
lular dopamine homeostasis [24,25]. Autoreceptors are
found on most parts of dopaminergic neurons, in partic-
ular the neuron terminal. It was first proposed in the
1970's [26,27] that the binding of dopamine to presynap-
tic autoreceptors affects TH and therefore the synthesis of
dopamine. It is now known that increased extracellular
dopamine can inhibit TH by at least 50% [28,29] and the
data in [30], [31], and [32] suggest that when extracellular
dopamine drops, synthesis can be increased by a factor of
4 to 5. The purpose of our modeling is to tease apart the
contributions of these various mechanisms to the home-
ostasis of dopamine synthesis, release, and reuptake.
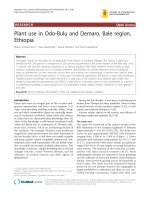
A schematic diagram of the model is indicated in Figure 1.
The pink boxes contain the acronyms of substrates and
the blue ellipses the acronyms of enzymes and transport-
ers; full names are give in the Methods. Dopamine is syn-
thesized in the nerve terminal from tyrosine which is
transported across the blood brain barrier. We include
Dopamine synthesis, release, and reuptakeFigure 1
Dopamine synthesis, release, and reuptake. The figure
shows the reactions in the model. Rectangular boxes indicate
substrates and blue ellipses contain the acronyms of enzymes
or transporters. The numbers indicate the steady state con-
centrations (
μ
M) and reaction velocities (
μ
M/hr) in the
model. Full names for the substrates are in Methods. Other
acronyms: vTyr, neutral amino acid transporter; DRR, dihyd-
robiopterin reductase; TH, tyrosine hydroxylase; AADC,
aromatic amino acid decarboxylase; MAT, vesicular
monoamine transporter; DAT, dopamine transporter; auto,
D2 dopamine auto receptors; MAO monoamine oxidase;
COMT, catecholamine O-methyl transferase.
Theoretical Biology and Medical Modelling 2009, 6:21 />Page 3 of 20
(page number not for citation purposes)
exchange between tyrosine and a tyrosine pool that repre-
sents all the other uses and sources of tyrosine in the ter-
minal. Tyrosine is converted into L-3,4-
dihydroxyphenylalanine (l-dopa) by tyrosine hydroxylase
(TH) and l-dopa is converted into cytosolic dopamine
(cda) by aromatic amino acid decarboxylase (AADC).
Cytosolic dopamine is transported into the vesicular com-
partment by the monoamine transporter and vesicular
dopamine (vda) is released from the vesicular compart-
ment into the extracellular space at a rate proportional to
the firing rate of the neuron. In the extracellular space,
extracellular dopamine (eda) affects the autoreceptors, is
taken up into the terminal by the DATs and is removed
from the system by uptake into glial cells and the blood
and diffusion out of the striatum. Dopamine is also cat-
abolized both in the terminal and in the extracellular
space.
There have been a number of other models of dopamine
dynamics. Ours is closest in spirit to the quite comprehen-
sive model by Justice [33] based on experimental work by
Justice, Michael and others [34-36]. They did not consider
fluctuations in blood tyrosine or intracellular tyrosine nor
did they consider the effects of autoreceptors. The model
by Porenta and Riederer [37] is less detailed but does
include the effects of autoreceptors. Tretter and Eberie
[38] have a very simple model of behavior at the synapse.
Nicholson [39] studied the difficult mathematical ques-
tions involved in diffusion and reuptake of dopamine in
extracellular spaces with realistic irregular geometry. Qi et
al. [40,41] use a general modeling framework in which the
rates of change of all variables are written as sums of pow-
ers of the other variables and then coefficients and expo-
nents are determined by fitting data. Kaushik et al. [42]
focus on the regulation of TH by phosphorylation, iron,
and
α
-synuclein. Fuente-Fernandez et al. [43] created a
probabilistic model of synthesis and release to see if sto-
chastic variation could cause the motor fluctuations in
Parkinson's disease. Wightman and co-workers use mod-
els of release into and reuptake from the extracellular
space to infer properties of the DATs and to interpret their
data on the time courses of extracellular dopamine [44-
47]. They added diffusion in the extracellular space in [48]
and used the model and their experiments to show that
the concentration of DA is quite uniform in the extracel-
lular space during tonic firing but not during burst firing.
We use the mathematical model as a platform on which
to investigate the system effects of variations in quantities
such as enzyme expression levels, tyrosine inputs, firing
rate changes, and concentrations of dopamine transport-
ers. We find that dopaminergic function is under tight reg-
ulatory control so that the system can respond strongly to
significant biological signals such as bursts, but responds
only moderately to the normal noisy fluctuations in the
component parts of the system.
Methods
The mathematical model consists of nine differential
equations for the variables listed in Table 1. We denote
substrates in lower case so that they are easy to distinguish
from enzyme names and velocities, which are in upper
case. Reaction velocities or transport velocities begin with
a capital V followed by the name of the enzyme, the trans-
porter, or the process as a subscript. For example, V
TH
(tyr,
bh4, cda, eda) is the velocity of the tyrosine hydroxylase
reaction and it depends on the concentrations of its sub-
strates, tyr and bh4, as well as cda (end product inhibi-
tion), and eda (via the autoreceptors). Below we discuss in
detail the more difficult modeling issues and reactions
with non-standard kinetics. Table 2 gives the parameter
choices and references for reactions that have Michaelis-
Menten kinetics in any of the following standard forms:
for unidirectional, one substrate, unidirectional, two sub-
strates, and bidirectional, two substrates, two products,
respectively.
Table 1 gives the abbreviations used for the variables
throughout. The differential equations corresponding to
the reactions diagramed in Figure 1 follow.
V
V
max
S
K
m
S
V
V
max
SS
K
S
SK
S
S
V
V
max
f
=
+
=
++
=
[]
[]
,
[][ ]
( [ ])( [ ])
[
12
1
1
2
2
SSS
K
S
SK
S
S
V
max
b
PP
K
P
PK
P
12
1
1
2
2
12
1
1
2
][ ]
( [ ])( [ ])
[][ ]
([])( [
++
−
++
PP
2
])
Table 1: Variables
bh2 dihydrobiopterin
bh4 tetrahydrobiopterin
tyr tyrosine
l-dopa 3,4-dihyroxyphenylalanine (L-DOPA)
cda cytosolic dopamine
vda vesicular dopamine
eda extracellular dopamine
hva homovanillic acid
tyrpool the tyrosine pool
Theoretical Biology and Medical Modelling 2009, 6:21 />Page 4 of 20
(page number not for citation purposes)
Table 2: Kinetic Parameters (
μ
M,
μ
M/hr,/hr).
velocity parameter model value literature value references
V
AADC
aromatic amino acid decarboxylase
K
m
130 130 [94]
V
max
10,000 *
V
DAT
dopamine transporter
K
m
.2 0.2-2 [75,76]
V
max
8000 *
V
DRR
dihydropteridine reductase
K
bh2
100 4-754 [95,96]
K
NADPH
75 29-770 [70-80,97-99]
200 *
K
bh4
10 1.1-17 [100,98]
K
NADP
75 29-770 [70-80,97-99]
80 *
V
MAT
vesicular monoamine transporter
K
m 3 .2-10 [101-103]
V
max 7082 *
k
out 40 *
V
TH
tyrosine hydroxylase
K
tyr
46 46 [60]
K
bh4
60 13, [60]
V
max
125 *
K
i
(cda) 110 110 [104]
K
i
(substrate inhibition) 160 46 [23,60] ; 160
V
max
f
V
max
b
Theoretical Biology and Medical Modelling 2009, 6:21 />Page 5 of 20
(page number not for citation purposes)
K
i
(autoreceptors) *
V
TYRin
neutral amino acid transporter
K
m
64 64 [51]
V
max
400 *
tyr ↔ tyrpool
k
1
6*
k
-1
0.6 *
catabolism and diffusion
0.2 *
10 *
30 *
33.3 [68]
3.45 3.45 [69,70]
0.2 *
k
rem
400 *
* see text
Table 2: Kinetic Parameters (
μ
M,
μ
M/hr,/hr). (Continued)
k
tyr
catab
k
cda
catab
V
max
catab eda()
K
m
catab eda()
k
hva
catab
k
tyrpool
catab
Theoretical Biology and Medical Modelling 2009, 6:21 />Page 6 of 20
(page number not for citation purposes)
Tyrosine and the tyrosine pool
A wide range of tyrosine concentrations, 39-180
μ
M, have
been measured in serum in infants and adults [49,50],
with means near 100
μ
M. In our model we take the serum
concentration to be btyr = 97
μ
M. In the model experi-
ments described in Results A, this concentration varies
throughout the day due to meals but averages 97
μ
M.
Tyrosine is transported from the serum across the blood-
brain barrier (BBB) to the extracellular space and from
there into the neuron. We simplify this two-step process
into a single step from the serum into the neuron with
velocity V
TYRin
and assume that the kinetics are those of
the neutral amino acid transporter across the BBB. The K
m
of the transporter has been measured as 64
μ
M [51] and
we take V
max
= 400
μ
M/hr, so
If btyr has its average value of 97
μ
M, then V
TYRin
= 244
μ
M/hr, which corresponds almost exactly to the 4
μ
M/
min reported in [51] for the import of tyrosine into the
brain.
Intracellular tyrosine is used in a large number of bio-
chemical and molecular pathways and is produced by
many pathways [52]. Over 90% of the tyrosine that enters
the intracellular pool of the brain is used in protein syn-
thesis [53-55] and even in the striatum a relatively small
fraction is used for dopamine synthesis [55]. To represent
all of the other products and sources of tyrosine, we will
use a single variable tyrpool, and assume that it exchanges
linearly with the tyrosine pool:
We choose the rate constants k
1
= 6
μ
M/hr and k
-1
= 0.6
μ
M/hr so that tyrpool is approximately 10 time larger than
tyr. As we will see below, with this choice, about 10% of
the imported tyrosine goes to dopamine synthesis and the
steady state tyrosine concentration is 126
μ
M in the
model, well within the normal range of 100-150
μ
M [56].
The importance of tyrpool is that, without it, all imported
tyrosine would have to go to dopamine in the model. Not
only would that be incorrect physiologically, but
dopamine synthesis would be extremely sensitive to tyro-
sine import, which it is not [57,58,56].
Tyrosine hydroxylase
Tyrosine (tyr) and tetrahydrobiopterin (bh4) are con-
verted by tyrosine hydroxylase (TH) into 3,4-dihyroxy-
phenylalanine (l-dopa) and dihyrobiopterin (bh2). The
velocity of the reaction, V
TH
, depends on tyr, bh4, cytosolic
dopamine (cda), and extracellular dopamine (eda) via the
autoreceptors:
The third term (on the right side of the equation) is simply
Michaelis-Menten kinetics including the inhibition of TH
by cda which competes with bh4 [3,59,23]. Values for the
rate constants and references are given in Table 2. The first
term (on the right) is substrate inhibition of the enzyme
by tyrosine itself [23]. A range of values for K
i(tyr)
, 37-74
μ
M, was found in [60]. We have computed K
i(tyr)
= 160
μ
M
directly from the data in figure 2 of [23]. The number 0.56
in the numerator is chosen so that at steady state the over-
all value of this term is one. That means the the steady
states with and without substrate inhibition will be the
same and this will allow us to make comparisons of the
dbh
dt
Vtyrbhcdaeda
Vbh bh
dbh
()
(, , , )
(, , , )
(
2
4
24
=
−
TH
DRR
NADPH NADP
44
24
4
)
(, , , )
(, , , )
()
dt
Vbh bh
Vtyrbhcdaeda
dtyr
d
=
−
DRR
TH
NADPH NADP
tt
VbtyrtVtyrbhcdaeda
k tyr k tyrpool
=−
−⋅ + ⋅
−
TYRin TH
(()) (,,,)4
11
−−⋅
−
=
−−
ktyr
dl dopa
dt
Vtyrbhcdaeda
Vldo
tyr
catab
()
(, , , )
(
TH
AADC
4
ppa
dcda
dt
V l dopa V cda vda
V eda k
cda
cat
)
()
()(,)
()
=−−
+−
AADC MAT
DAT
aab
cda
dvda
dt
V cda vda fire t vda
deda
dt
fire t
⋅
=−⋅
=⋅
()
(, ) ()
()
()
MAT
vvda V eda
V eda k eda
dhva
dt
kcda
rem
cda
catab
−
−−⋅
=⋅+
DAT
CATAB
()
()
()
VVedakhva
d tyrpool
dt
k tyr k tyrpool
hva
catab
CATAB
()
()
−⋅
=⋅ − ⋅
−
−11
kk tyrpool
tyrpool
catab
⋅
Vbtyr
btyr
btyr
TYRin
()
()
.=
+
400
64
tyr tyrpool
k
k
↔
−1
1
.
V
tyr
K
ityr
eda
TH
=
+
⎛
⎝
⎜
⎜
⎜
⎜
⎜
⎞
⎠
⎟
⎟
⎟
⎟
⎟
⋅
⎛
⎝
⎜
⎞
⎠
⎟
056
1
45
8
002024
4
.
()
()
.
.
++
+
⎛
⎝
⎜
⎜
⎜
⎜
⎜
⎞
⎠
⎟
⎟
⎟
⎟
⎟
⋅
++
1
05
4
44
.
()( )
()() ()
V
max
tyr bh
tyr bh K
tyr
bh K
ttyr
K
bh
cda
K
icda
4
1(
()
()
)+
⎛
⎝
⎜
⎜
⎜
⎜
⎜
⎞
⎠
⎟
⎟
⎟
⎟
⎟
Theoretical Biology and Medical Modelling 2009, 6:21 />Page 7 of 20
(page number not for citation purposes)
the dynamic behaviors of the TH reaction in the two cases
(Results A).
The second term (on the right) requires more discussion.
It was first proposed in the 1970's [26,27] that the binding
of dopamine to presynaptic autoreceptors affects TH and
therefore the synthesis of dopamine. Although the details
of the mechanisms are not certain, research since that time
has demonstrated clearly that the autoreceptors modulate
the activity of TH as well as the neuronal firing rate and
the release of dopamine[29,28,61-63,30,64,31]. All three
effects are consistent: higher eda means more stimulation
of the autoreceptors and this decreases the activity of TH
[29,63], lowers firing rate [61,62], and inhibits release
[28,29]. The evidence in these papers suggests that
dopamine agonists can inhibit TH by at least 50% [28,29].
The more difficult question is how much synthesis is
increased if the normal inhibition by the autoreceptors is
released? In [63] only a 40% increase was found, but the
data in [30] and [31] suggest that synthesis can be
increased by a factor of 4 to 5. This is consistent with the
original data in [27], Table 1. The third factor in the for-
mula for V
TH
(tyr, bh4, cda, eda) has the following proper-
ties: at the normal steady state it equals one; as eda gets
large it approaches 0.5; as eda gets smaller and smaller it
approaches 5. The exponent 4 was chosen to approximate
the data in [30], figure 2. Note that, in this first model, we
are not including explicitly the effects of the autoreceptors
on firing rate and dopamine release.
Storage, release, and reuptake of dopamine
After dopamine is synthesized it is packaged into vesicles
by the vesicular monoamine transporter, MAT. We take
the K
m
of the transporter in the literature range (see Table
2) and choose the V
max
so that the concentration of
cytosolic dopamine is in the range 2-3
μ
M under normal
circumstances. The experiments in [65] and the calcula-
tions in [66] suggest strongly that there is transport from
the vesicles back into the cytosol, either dependent or
independent of the MAT. We assume this transport is lin-
ear with rate constant, k
out
, chosen so that the vast major-
ity (i.e., 97%) of the cellular dopamine is in the vesicular
compartment. The vesicles take up a significant fraction of
the volume terminal, perhaps 1/4 to 1/3 (reference). For
simplicity we are assuming that the vesicular compart-
ment is the same size as the non-vesicular cytosolic com-
partment. This assumption is unimportant since we take
the cytosol to be well-mixed and we are not investigating
vesicle creation, movement toward the synapic cleft, and
recyling where geometry and volume considerations
would be crucial.
Vesicular dopamine, vda, is put into the synaptic cleft,
where it becomes eda, by the term fire(t)(vda) in the differ-
ential equations for vda and eda (see above). fire is a func-
tion of time in some of our in silico experiments, for
example in Results G where we investigate individual
spikes. However, for most of our experiments fire = 1
μ
M/
hr, which means that vesicular dopamine is released at a
constant rate such that the entire pool turns over once per
hour. This is consistent with a variety of experimental
results on turnover and we will see in Results C that this
choice gives decay curves after
α
-methyl-p-tyrosine (
α
-
MT) inhibition of TH that match well the findings of
Caron and co-workers [24,25].
Extracellular dopamine has three fates. It is pumped back
into the cytosol by the DATs; it is catabolized; it is
removed from the system. The parameters for the DATs
are taken from the literature. The other two fates are dis-
cussed next.
Metabolism and removal of dopamine
Cytosolic dopamine is catabolized by monoamine oxi-
dase (MAO) and aldehyde dehydrogenase to dihydrophe-
nylacetic acid (dopac), which is exported from the neuron
and methylated by catecholamine methyl transferase
(COMT) to homovanillic acid (hva). In this simple model
we are not investigating the details of catabolism, only
how cda is removed from the system. Since the cytosolic
dopamine concentration is low (2-3
μ
M) and the K
m
for
MAO is high (210-230
μ
M, [67]), the removal of cda is
basically a linear process that we model by the first order
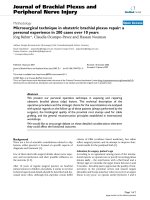
Michaelis-Menten and substrate inhibition kineticsFigure 2
Michaelis-Menten and substrate inhibition kinetics.
The three curves plot the velocity of the TH reaction as a
function of the concentration of tyrosine for normal Michae-
lis-Menten kinetics, for competitive substrate inhibition, and
for uncompetitive substrate inhibition. The curves have been
normalized so that each has velocity 100
μ
M/hr when the
tyrosine concentration is 125
μ
M. In each case K
m
= 46
μ
M.
Theoretical Biology and Medical Modelling 2009, 6:21 />Page 8 of 20
(page number not for citation purposes)
term (cda). We choose the rate constant = 10/
hr so that the rate of cytosolic catabolism is somewhat less
than the synthesis rate of cda at steady state. Extracellular
dopamine is also catabolized, first by COMT and then by
MAO. In this case, we use a Michaelis-Menten formula for
this process because the K
m
of dopamine for COMT is low
enough (approximately 3
μ
M, [68]) that the process satu-
rates in some of our in silico experiments in which large
amounts of DA are dumped into the extracellular space.
The half-life of hva is the brain is approximately hr
[69,70], which determines = 3.45/hr for the
removal of hva from the system.
In our model the extracellular space is a single compart-
ment. One should think of it as the part of the entire extra-
cellular space corresponding to this particular synapse. Of
course, if we had many model synapses, the eda from one
will diffuse into the extracellular compartment of another
(volume transmission). We are assuming for simplicity
that the extracellular space is well-mixed, that is, we are
ignoring diffusion gradients between different parts of the
extracellular space. In fact, Venton et al. [48] have shown
using a combination of experiments and modeling that
the extracellular space is well-mixed during tonic firing
but that substantial gradients exists between "hot spots"
of release and reuptake and the rest of the extracellular
space during and just after episodes of burst firing. In
addition, when SNc projections die, as in Parkinson's dis-
ease or in denervation experiments, the terminals will be
further apart making it certain that diffusion gradients will
play an important role (see the Discussion). The term
k
rem
(eda) in the differential equation for eda represents
removal of eda through uptake by glial cells, uptake by the
blood, and diffusion out of the striatum. After some
experimentation we chose k
rem
= 400/hr because it gave
good fits to the experimental data in [33] discussed in
Results B and the experimental data in [24,25] discussed
in Results D.
In all cases, steady states or curves showing the variables
as functions of time were computed using the stiff ODE
solver in MATLAB.
Steady state concentrations and fluxes
Figure 1 shows the concentrations and velocities at steady
state in our model. Only about 10% of the cellular tyro-
sine input goes to dopamine synthesis with the remainder
going to the tyrosine pool (80%) or being catabolized
(10%) as seen experimentally [53-55]. Cellular tyrosine
itself has a steady state concentration of 126
μ
M in the
model consistent with a large number of experimental
observations [58,56,4].
It is known that the cytosolic concentration of dopamine
is quite low and the concentration of l-dopa is extremely
low [3]. In the model, at steady state, cda = 2.65
μ
M and
the concentration of l-dopa is 0.36
μ
M, consistent with
these observations. It is instructive to look at the flux bal-
ance of cda in the steady state. 27.3
μ
M of cda are manu-
factured from tyrosine per hour. 81
μ
M/hr of dopamine
are put into the vesicles by the monoamine transporter
and 80.1
μ
M/hr are put back into the cytosol from the
extracellular space by the DATs. Finally, 26.5
μ
M/hr of
dopamine is catabolized in the cytosol.
The largest portion of cellular dopamine is in the vesicles;
in our model vda = 81
μ
M at steady state. We assume that
at a "normal" firing rate the vesicular contents would be
emptied in an hour; that is, vda is released into the synap-
tic cleft at 81
μ
M/hr. The DATs put most of this eda back
into the cytosol (80.1
μ
M/hr), with the remainder being
removed (0.81
μ
M/hr) or being catabolized (.02
μ
M/hr).
We will see below that these velocities are consistent with
the half-life measurements of Caron and co-workers
[24,25].
Results
A. Consequences of substrate inhibition of TH by tyrosine
Tyrosine hydroxylase (TH) converts the amino acid tyro-
sine into l-dopa and bh4 into bh2; l-dopa is then converted
by aromatic amino acid decarboxylase into dopamine.
Given the dynamic nature of neurons and the importance
of dopamine, it is not surprising that TH is regulated by
many different mechanisms. TH is inhibited by dopamine
itself and is also inhibited by the D2 autoceptors that are
stimulated by extracellular dopamine. The effects of these
regulations will be discussed below. Here we focus on a
third regulation, substrate inhibition of tyrosine hydroxy-
lase by tyrosine [23]. Substrate inhibition means that tyro-
sine can bind non-enzymatically to TH preventing TH
from performing its function of converting tyrosine to l-
dopa. Substrate inhibition can be competitive (one tyro-
sine binding to TH makes the catalytic site unavailable to
another tyrosine) or uncompetitive (the catalytic site is
available to another tyrosine but the enzyme does not per-
form its catalytic function). Substrate inhibition is not
widely recognized as an important regulatory mechanism,
though it was proposed by Haldane in the 1930s [71], and
it known to have an important homeostatic function in
the folate cycle [72]. Figure 2 shows normal Michaelis-
Menten kinetics, competitive substrate inhibition, and
uncompetitive substrate inhibition. In uncompetitive
substrate inhibition the velocity curves rises, reaches a
maximum, and then descends to zero because at higher
and higher tyrosine concentrations more and more
enzyme is bound non-enzymatically to tyrosine.
k
cda
catab
k
cda
catab
1
5
k
hva
catab
Theoretical Biology and Medical Modelling 2009, 6:21 />Page 9 of 20
(page number not for citation purposes)
The velocity curve, figure 2 of [23], shows clearly that the
substrate inhibition of TH by tyrosine is uncompetitive
and we have chosen our kinetic parameters to match the
shape of that curve. The question that we wish to address
here is what is the purpose of this substrate inhibition? We
will see that it stabilizes vesicular dopamine in the face of
variations in tyrosine availability.
It is known [57] that brain tyrosine levels can double after
meals, and this implies that tyrosine levels in the blood
vary even more dramatically. In our model the average
tyrosine level in the blood is 97
μ
M. We assume that for 3
hours after breakfast and lunch this concentration is mul-
tiplied by 1.75 and for three hours after dinner by 3.25. At
other times the concentration of blood tyrosine is .25 × 97
= 24.2
μ
M, which gives a daily average of 97
μ
M. The
blood tyrosine concentrations are shown in Figure 3 along
with the cellular tyrosine levels (computed from the
model) over a 48 hour period. As found in [57] the intra-
cellular tyrosine levels (roughly the brain levels) vary con-
siderably.
To see the effect of substrate inhibition on the synthesis of
L-Dopa by TH, we computed the time courses of the veloc-
ity of the TH reaction both with and without substrate
inhibition, Panel B of Figure 3. Without substrate inhibi-
tion the velocity of the TH reaction varies from 23.5 to 28
μ
M/hr while in the presence of substrate inhibition the
variation ranges only from 27 to 28
μ
M/hr.
This naturally raises the question of how much the levels
of vesicular dopamine vary throughout the day in the two
cases. Panel C of Figure 3 shows that substrate inhibition
greatly reduces the variation.
We conclude that one important purpose of substrate
inhibition is to stabilize the velocity of the TH reaction,
and thus the vesicular stores of dopamine, in the face of
large variations in tyrosine availability because of meals.
The stabilization is a result of the relatively flat velocity
curve in a large neighborhood (say 75
μ
M to 175
μ
M -see
Figure 2) of the normal tyrosine concentration of 126
μ
M.
We note that the non-monotone shape of the velocity
curve helps explain some of the unusual relationships
between tyrosine levels and dopamine synthesis and
release reported in the literature [73,58,56].
B. The response to prolonged stimulation
In a series of studies and one modeling paper, Justice and
co-workers studied the dynamics of extracellular
dopamine in dopaminergic neurons in rat brain [34-
36,33]. In one experiment they stimulated the ascending
projections of SN neurons in the medial forebrain bundle
for ten seconds and measured the time course of extracel-
lular dopamine in the striatum. The results of a similar
stimulation in our model are shown in Figure 4, which
also shows the data in the original experiment. Note that
the curve starts to descend before the end of stimulation
because of depletion of the reservoir of vda. The close
match between our model curve and the data suggests that
our V
max
for the DATs (the primary clearance mechanism)
is in the right range.
C. Dopamine turnover in tissues and extracellular space
Over the last 15 years Caron and co-workers have con-
ducted numerous experiments with dominergic neurons.
We focus here on the experiments reported in [24], [25]
and [74] that compare the behavior of extracellular
dopamine and striatal tissue dopamine in wild type mice
(WT) and mice that express no DATs at all (DAT
-/-
), the
heterozygote (DAT
+/-
), and mice that overexpress the
DATs (DAT-tg). The experiments of Caron and co-workers
provide an exceptional opportunity to analyze the effects
and importance of the DATs.
When we turn off the DATs in our model (by setting the
V
max
to zero), we see changes in steady state values that are
qualitatively similar to those seen in [24] and [25] but the
magnitudes differ somewhat. The steady state value of eda
rises by a factor of 10 in the model when the DATs are
turned off, while it rises by only a factor of 5 in the DAT
-/
-
mouse. In the model, vesicular dopamine declines from
81
μ
M to 11
μ
M when the DATs are turned off, while [24]
and [25] report that striatal tissue dopamine in DAT
-/-
mice is only 1/20 of the value in WT. We modeled the het-
erozygote (DAT
+/-
) by reducing the V
max
of the DATs to 1/
2 the normal value. The model eda increases by 50% com-
pared to WT and vda declines by 27%, which is almost
exactly the decline in striatal tissue DA reported in DAT
+/-
mice in ([24], figure 3). In general, one would not expect
the model and experimental results to correspond exactly
because the DAT
-/-
and DAT
+/-
mice have not had their
DATs suddenly turned off as we are doing in the model.
These mice have lived their whole lives with no or reduced
DATs, respectively, so their dopaminergic neurons may
differ in other ways from those of the WT mice.
The studies [24], [25] and [74] report on various experi-
ments that highlight the physiological difference between
the WT, DAT
-/-
, and DAT
+/-
mice. We conducted similar
experiments with the model and compared our results to
theirs. Figure 1(E,F) of [25] shows the time courses of eda
for WT and DAT
-/-
mice after treatment with
α
-methyl-p-
tyrosine (
α
-MT), a potent TH blocker. They find half-lives
of approximately 2.5 hours for WT and 15-20 minutes for
DAT
-/-
mice. In the model, the half-life of eda is 2 hours
and 40 minutes for WT mice and 37 minutes for DAT
-/-
mice; see Figure 5.
Theoretical Biology and Medical Modelling 2009, 6:21 />Page 10 of 20
(page number not for citation purposes)
Dynamic effects of substrate inhibitionFigure 3
Dynamic effects of substrate inhibition. Panel A shows the time courses of blood tyrosine concentration (assumed, see
text) and intracellular tyrosine concentration (computed) over a two day period. Panel B shows the time courses of the veloc-
ity of the TH reaction over a two day period in response to meals both with and without substrate inhibition. The fluctuations
are much smaller when substrate inhibition is present. Panel C shows the time courses of vesicular dopamine in response to
meals over a two day period both with and without substrate inhibition. The fluctuations are much smaller when substrate
inhibition is present.
Theoretical Biology and Medical Modelling 2009, 6:21 />Page 11 of 20
(page number not for citation purposes)
One important focus of the experiments in [24], [25] and
[74] is the clearance of eda after stimulation. In the model
we can test this directly by raising the concentration of eda
at time T = 0 to 10 times normal (for either WT or DAT
-/-
)
and measuring the half-life of eda as the system relaxes
back to equilibrium. See Figure 6.
We find in the model that the half-life of eda for WT mice
is .067 seconds and the half-life for DAT
-/-
mice is approx-
imately 6 seconds, giving a ratio of DAT
-/-
half-life to WT
half-life of about 90. Caron and coworkers find similar
numbers experimentally except that their ratio is about
300. We note that the ratio is sensitive, of course, to small
changes in the small WT half-life that is determined both
in experiments and in the model from a very steep curve.
D. The role of transporter kinetics in the regulation of
extracellular dopamine
Some of the most interesting experiments in [24,25] and
[74] measure the actual time courses of eda in WT, DAT
-/-
, DAT
-/-
, and DAT-tg mice in response to pulse stimula-
tion. Panel A of Figure 7, below, shows a composite of the
experimental data taken from [24] and [74]. We were
intrigued by the non-monotone character of the peaks.
Either more transporters (DAT-tg) or fewer transporters
(DAT
+/-
) lowers the eda peak compared to wild-type. Our
investigations show that this behavior is due to two com-
peting effects.
The first effect is that the amount of dopamine available
to be released in response to an external pulse is not
strictly proportional to the number of DATs. In the model
"the number of DATs" is represented by the V
max
of the
transporter. We increased the V
max
by 50% for DAT-tg
mice compared to wild type, decrease it by 50% for DAT
+/
-
mice, and decrease it to zero for DAT
-/-
mice. However,
vda, the pool available for release, has the following
model values: vda = 98.9
μ
M (DAT-tg), vda = 81
μ
M (WT),
vda = 59
μ
M (DAT
+/-
), vda = 11.4
μ
M (DAT
-/-
). In the
model, the amount of dopamine released in response to a
pulse small enough not to deplete the vda pool very much
Extracellular dopamine with 10 seconds of stimulationFigure 4
Extracellular dopamine with 10 seconds of stimula-
tion. The time course of extracellular dopamine during and
after 10 seconds of stimulation (black bar) of dopamin-ergic
neurons. Data points (open circles) are redrawn from [33].
The solid line is the model calculation.
Inhibition of TH by
α
-MTFigure 5
Inhibition of TH by
α
-MT. The time course of extracellu-
lar dopamine (eda) in the model after inhibition of TH by
α
-
MT. The half-life of eda is 2 hours and 40 minutes for WT
mice and 37 minutes for DAT
-/-
mice.
Clearance of a bolus of edaFigure 6
Clearance of a bolus of eda. At time T = 0 the amount of
eda is increased by a factor of 10 and the decay back to
steady state is shown as a percentage of normal for WT and
DAT
-/-
mice. The half-life of the bolus .067 seconds for WT
mice and 6 seconds for DAT
-/-
mice.
Theoretical Biology and Medical Modelling 2009, 6:21 />Page 12 of 20
(page number not for citation purposes)
Figure 7 (see legend on next page)
Theoretical Biology and Medical Modelling 2009, 6:21 />Page 13 of 20
(page number not for citation purposes)
is proportional to vda. Thus more dopamine is released in
DAT-tg compared to WT compared to DAT
+/-
compared to
DAT
-/-
. If this were the only effect then one would expect
the eda peak to be highest for DAT-tg, lower for WT, still
lower for DAT
+/-
, and lowest for DAT
-/-
.
The second effect is that if the cell has more DATs, then it
should be able to pump the released eda back into the cell
faster. Thus, if the amount released were the same in each
case, we would expect the eda peak to be lowest for DATtg,
somewhat higher for WT, still higher for DAT
+/-
, and high-
est for DAT
-/-
. However, as we have seen, the amount
released is not the same but decreases as one progresses
from DAT-tg to WT to DAT
+/-
to DAT
-/-
. These are the two
competing effects that determine the heights of the peaks.
The situation is even more complicated and interesting,
however. The K
m
for the DAT has been measured in a
number of experiments. A reasonable range of possible
values is 0.2
μ
M to 2
μ
M; see [75] and [76]. In the experi-
ments in [24] and [74] the maximal eda concentrations
were in the range 2-3
μ
M. This means that if K
m
= 0.2 then
the height of the peak will be highly affected by how much
dopamine is released because the DATs are saturated.
In Panel B of Figure 7, we show the time courses of extra-
cellular dopamine in model experiments where K
m
= 0.2
μ
M. Notice that the peaks decrease as one goes from
DATtg to WT to DAT
+/-
to DAT
-/-
. In each case the amount
of stimulation was the same. This is what one would
expect if the first effect, the amount of dopamine released,
dominates. To test whether the saturation of the DATs
causes this effect we did a model experiment in which the
amount of stimulation was reduced to 1/10 of what it was
before. The results can be seen in Panel C of Figure 7. At
this lower stimulation level, the second effect dominates
because the DATs are no longer saturated and the peaks
increase as one goes from DAT-tg to WT to DAT
+/-
. Note
also how much narrower the peaks are because the DATs
are operating on the linear parts of their response curves
rather than the saturation part. Panels B and C show that
the peaks can be either decreasing or increasing as one
proceeds from DAT-tg to WT to DAT
+/-
, depending only
on the amount of stimulation. The DAT
-/-
peak remains
lowest because it is not affected by saturation effects on
the DATs, since there aren't any.
If we increase the K
m
of the DATs we will decrease the sat-
uration effects seen in Panel B of Figure 7 and thus the two
effects (amount released and rapidity of uptake) should
be more evenly balanced. That is indeed the case as shown
by Panel D of Figure 7. In Panel D the K
m
of the DATs has
been raised to 1.6
μ
M and everything else remains the
same as in the model experiments shown in Panel B. Now
the WT peak is higher than both the DAT-tg peak and the
DAT
+/-
peak. The differences are not great, but the non-
monotone effect is clear. As before, the DAT
-/-
peak is the
lowest since so little dopamine is released.
These model experiments show that the relative heights of
the peaks depend on the size of the vesicular stores, the
number of DATs, their K
m
s, and the amount of stimula-
tion.
E. The frequency of stimulation affects passive
stabilization
Bergstrom and Garris [46] measured the time course of
extracellular dopamine after two seconds of stimulation
in rat striatum after partial denervation. We will let f
denote the fraction of striatal terminals still alive. With 20
Hz stimulation, the peaks of the resulting eda curves are
almost independent of f until f = .15 ([46], figure 3(a),
and Panel A of Figure 8). This homeostasis, coined "pas-
sive stabilzation" in [77], is the main focus of [46]. By
contrast, with 60 Hz stimulation for 2 seconds, the result-
ing peaks decrease almost linearly as f decreases from one
towards zero ([46], figure 3(b), and Panel C of Figure 8).
Our model shows very similar behavior in both cases
(Panels B and D of Figure 8).
Time courses of eda Panel A shows time courses of eda after a pulse of stimulation for DAT-tg, WT, DAT
+/-
, and DAT
-/-
miceFigure 7 (see previous page)
Time courses of eda Panel A shows time courses of eda after a pulse of stimulation for DAT-tg, WT, DAT
+/-
,
and DAT
-/-
mice. The data for DAT-tg mice is taken from figure four B of [74] rescaled to have the same relationship to WT
as in that paper. The data on WT, DAT
+/-
, and DAT
-/-
mice are from figure one of [24]. Panel B shows the time course of eda
in the model in response to a 300 msec pulse during which the release coefficient fire is raised from 1/hr to 900/hr (see Meth-
ods) for DAT-tg, WT, DAT
+/-
, and DAT
-/-
mice. The V
max
of the DATs is raised 50% for DAT-tg mice, lowered 50% for DAT
+/
-
mice, and set to zero for DAT
-/-
mice. The K
m
of the DATs is 0.2
μ
M. The peaks gets smaller as one moves from DAT-tg to
WT to DAT
+/-
. Panel C shows the time course of eda in the model in response to a 300 msec pulse during which the release
coefficient fire is raised from 1/hr to 90/hr (see Methods) for DAT-tg, WT, DAT
+/-
, and DAT
-/-
mice. The V
max
values are as in
Panel B and the K
m
of the DATs is 0.2
μ
M. The peaks now increase as one goes from DAT-tg to WT to DAT
+/-
. Note how nar-
row the peaks are because the concentrations are lower and the DATs are not saturated. Panel D shows the time course of
eda in the model in response to a 300 msec pulse during which the release coefficient fire is raised from 1/hr to 900/hr (see
Methods) for DATg, WT, DAT
+/-
, and DAT
-/-
mice. The V
max
vales are as in Panel B. The K
m
of the DATs is raised to 1.6
μ
M.
The Dat-tg and DAT
+/-
peaks are both lower than the WT peak as in the experimental data in Panel A.
Theoretical Biology and Medical Modelling 2009, 6:21 />Page 14 of 20
(page number not for citation purposes)
Bergstrom and Garris do not explain the reasons why the
two cases (20 Hz and 60 Hz) are so different, although the
reasons are implicit in their discussions. We give an expla-
nation here using a simple model for eda introduced in
[44]. As we will see, the difference depends on the K
m
of
the DATs. We denote the (well-mixed) extracellular con-
centration of dopamine in the striatum by E(t). We'll
ignore removal from the system and catabolism because
we are interested in events on a very short time scale.
Compared to the concentrations we get after stimulation,
E starts very small, so we'll assume E(0) = 0. Assume that
dopamine is released from the cells at a total rate of C/sec
for
t
o seconds. In [46], t
o
= 2, so the concentration E(t) will
satisfy the differential equation:
where we take K
m
= 0.2
μ
M as in our large model. For t >
2 the C isn't there any more but that doesn't affect the
maximum concentration of E(t), which occurs at t = 2. We
want to calculate E(2) and then introduce our scale factor
f and see how the value scales with f.
We will consider two cases. Suppose the release is rela-
tively low as it is in the 20 Hz case where the peak concen-
trations are (on average) between 0.1 and 0.2
μ
M. Since
the concentrations are below K
m
we can approximate (1)
by:
′
=−
+
≤≤Et C
V
max
Et
K
m
Et
t()
()
()
.for 0 2
(1)
Denervation affects the peaks of eda in the striatumFigure 8
Denervation affects the peaks of eda in the striatum. Panels A and C show data and regression lines redrawn from [46],
figure 3(a), three (b). In both experiments and the model, tissue dopamine concentration as a percentage of normal is approx-
imately equal to f, the fraction of terminals still alive. At 20 Hz stimulation, both the experimental data (Panel A) and the model
(Panel B) show that the peaks keep their heights until f is very small. This "passive stabilization" is the main focus of [46] and
[22]. However, at 60 Hz stimulation, the eda peaks decline linearly as f declines from one to zero both experimentally (Panel
C) and in the model (Panel D).
Theoretical Biology and Medical Modelling 2009, 6:21 />Page 15 of 20
(page number not for citation purposes)
We easily solve this differential equation and find
Suppose, now, that only the fraction f of cells are still
alive. Then C is replaced by fC and V
max
is replaced by
fV
max
, so the maximum is:
The shape of the graph of E(2) as a function of f depends
on the size of . Bergstrom and Garris measured a
V
max
close to 4
μ
M/sec and K
m
= 0.2
μ
M, so ≈ 40.
This means that the graph of E(2) will be almost constant
as f gets smaller from 1. Only when f gets very very small
will E(2) plunge down to zero. This is the constant behav-
ior of the peaks seen in [46], figure 3(a), for 20 Hz stimu-
lation.
In the case of 60 Hz stimulation the peaks are quite high,
as much as 3
μ
M for the intact striatum, far above the K
m
of the transporters. As long as the concentrations are well
above the K
m
the transporters are saturated and we can
approximate (1) by
so the solution at t = 2 is:
If only the fraction f of cells are left, then,
Thus the maxima should decrease linearly with f and
that's what Bergstrom and Garris see in their figure 3(b).
This calculation is correct as long as the concentration of
E stays well above K
m
. The complete behavior as f goes
from 1 to 0 in the 60 Hz case should be: first, this linear
decrease, then a middle range around the K
m
value where
the rate of decrease is more modest, then a flat plateau as
in the first case we considered, until, finally, E(2) should
plunge to 0 for almost complete denervation. As the abil-
ity to take accurate voltametric measurements improves, it
will be interesting to see if this prediction is correct.
F. Homeostatic effects of the autoreceptors
It is well established that the expression levels of proteins
vary substantially, even in genetically identical cells, and
often vary substantially in time in individual cells [78].
Some of this variation is due to control functions in the
cell but other variation is due to the stochastic nature of
gene expression when small numbers of molecules are
involved. The D2 autoreceptors stabilize the velocity of
the TH reaction (and therefore vesicular stores) against
variation in gene expression level. The mechanism is easy
to understand. If the expression of TH drops then the
dopaminergic neuron will have less cytosolic and vesicu-
lar dopamine and less will be released into the extracellu-
lar space. When the concentration of extracellular
dopamine drops, the inhibition of TH via the autorecep-
tors is released, partially compensating for the drop in TH
expression. Similarly, if TH is overexpressed, extracellular
dopamine rises and the inhibition of TH by the autorecep-
tors is increased. Panel A of Figure 9 shows how the veloc-
ity of the TH reaction depends on the expression level of
TH both with and without the autoreceptors. In the pres-
ence of autoreceptors the effect of expression level is much
milder.
Autoreceptors on the presynaptic membrane upregulate
tyrosine hydroxylase(TH) when eda drops and downregu-
late TH when eda rises as it will do if the firing rate of the
neuron increases [62,61]. Thus, the autoreceptors provide
a mechanism whereby the eda concentration provides
feedback inhibition to TH. The strength of the effect can
be seen in Panel B of Figure 9 where eda is graphed as a
function of firing rate. The eda curve is much flatter in the
presence of the autoreceptors. We note that the eda also
affects firing rate directly via somatic autoreceptors [62],
but this is not included in our model.
G. The effect of single action potentials and bursts
It is known [3,4] that there are two typical firing patterns
seen in the dopaminergic neurons of the SNc, tonic firing
at about 5 Hz and bursts of action potentials with an
intraburst frequency of about 15-30 Hz. Dopaminergic
neurons respond to reward-related stimuli with increased
burst firing [8,79] and burst firing is more effective at rais-
ing dopamine levels than tonic firing [80,45]. Recently
bursts have been measured in awake, freely-moving ani-
mals [81,47,82] in response to rewards and in response to
cues for the rewards when the cues have been learned; for
a review, see [83].
′
=− ≤≤Et C
V
max
K
m
Et t() () .for 0 2
(2)
E
C
V
max
K
m
e
V
max
K
m
() ( ).21
2
=−
−
E
C
V
max
K
m
e
V
max
K
m
f
() ( ).21
2
=−
−
2
V
max
K
m
2
V
max
K
m
′
=− ≤≤Et C V t
max
() .for 0 2
ECV
max
() ( ).22=−
EfCfVfCV
max max
() ( ) ( ).22 2=− = −
Theoretical Biology and Medical Modelling 2009, 6:21 />Page 16 of 20
(page number not for citation purposes)
We see in our model responses that quite similar to those
observed experimentally. Panel A of Figure 10 shows the
time course of extracellular dopamine in response to
steady firing at 5 Hz. All extra dopamine is cleared from
the extracellular space before the next action potential
arrives as reported in [76]. Note that on this short time
scale cytosolic dopamine and vesicular dopamine remain
approximately constant. However, Panel B shows that a
burst of action potentials at 15 Hz causes a substantial rise
in average eda [76]. The model results shown in Figure 10
are similar to the model and experimental results reported
in [82], figure 2. Thus, even a very short term shift from
tonic firing at 5 Hz to burst firing at 15 Hz produces a large
dopamine signal. This shows how sensitive the system is
to a brief short-term change in frequency of firing.
However, if firing continues for a long time at 15 Hz, the
feedback on TH via the autoreceptors will cause eda to
decline to an intermediate level, higher than normal but
not as high as the short term response. The inhibition of
TH by increased binding to the autoreceptors happens
quickly, but the resulting decrease in cda and vda happens
slowly over a nine hour period (Figure 11), and this
causes a gradual decrease in eda even though the firing rate
remains elevated. Thus, over the long term, the eda con-
centration gradually habituates to the increased firing
Homeostatic effects of the autoreceptorsFigure 9
Homeostatic effects of the autoreceptors. Panel A
shows that the presence of autoreceptors stabilize the veloc-
ity of the TH reaction against changes in TH expression level.
Panel B shows that the autoreceptors stabilize eda against
changes in firing rate. eda level is shown as a function of firing
rate (% percent normal) without autoreceptors present (blue
curve) and with autoreceptors (red curve).
Bursts increase extracellular dopamineFigure 10
Bursts increase extracellular dopamine. Panel A shows
the eda concentration as a function of time when the tonic
firing rate is 5 Hz. The eda from the previous action potential
is cleared from the extracellular space before the next action
potential arrives. Notice that vesicular dopamine and
cytosolic dopamine are not noticeably affected on this short
time scale. Panel B shows that a short burst of action poten-
tials at 15 Hz raises extracellular dopamine dramatically dur-
ing the burst. Even a very short term change from tonic firing
at 5 Hz to burst firing at 15 Hz produces a large dopamine
signal.
Theoretical Biology and Medical Modelling 2009, 6:21 />Page 17 of 20
(page number not for citation purposes)
rate. It would be interesting to test this prediction of the
model experimentally.
Discussion
The purpose of a mathematical model is not only to sum-
marize or represent the biology that is already known, but
to provide a platform for in silico experimentation that
one can use to explain data, resolve controversies, and try
out hypotheses. Our main focus in this paper is to help
understand the many homeostatic mechanisms involved
in dopamine synthesis, release and reuptake. We have
demonstrated that substrate inhibition of tyrosine
hydroxylase by tyrosine plays an important role in stabi-
lizing vesicular dopamine against tyrosine fluctuations
due to meals. In Section C we studied dopamine turnover
and clearance from the extracellular space and compared
model results to experimental data. In Section D we used
the model to explain features of the time course of extra-
cellualar dopamine observed by Caron and co-worers in
DAT knockout and Dat-tg mice. In Section E we showed
that the model reproduces the results of Bergstrom and
Garris on the different responses to 20 Hz and 60 Hz stim-
ulation and we provide an explanation. In Section F we
showed that autoreceptors stabilize extracellular
dopamine against changes in expression level of TH and
modulate the influence of firing rate on extracellular
dopamine concentration. Of course, the purpose of these
homeostatic mechanisms is not to make the dopaminer-
gic neuron a fixed object that always responds in the same
way. On the contrary, the purpose of the homeostatic
mechanisms is keep the neuron poised in the right state,
despite environmental fluctuations, so that it can respond
appropriately to significant biological signals. Thus, in
Section G we showed that the tonic firing rate of 5 Hz
keeps extracellular dopamine near normal, but an
increase to only 15 Hz in a burst raises extracellular
dopamine transiently but significantly. Thus, the neuron
is able to send a dopaminergic signal with only a modest
and transient increase in firing rate.
Any model includes many oversimplifications. We have
not included the details of the use of tyrosine in other
metabolic pathways. The processes by which vesicles are
created, move to the synapse, and release their dopamine
are complicated and interesting [84,65], but are not
included in this model. In our model the DATs put
released dopamine back into the terminal, but we do not
include leakage of cytosolic dopamine through the DATs
into the extracellular space. We include in the model the
effects of the autoreceptors on dopamine synthesis (via
TH) but we do not include explicitly the effects of the
autoreceptors on dopamine release and firing rate.
Finally, we are focusing on the nerve terminal and on syn-
aptic mechanisms and therefore do not include mecha-
nisms, such as the effects of the autoreceptors on the
dendrites and cell body, that operate at the level of the
whole cell or between dopaminergic cells.
Such cellular and cell population effects are likely to play
important roles in compensatory mechanisms in the case
of dopaminergic cell loss. For example, extracellular
dopamine concentrations in the striatum are maintained
despite massive cell death in the substantia nigra [77,46].
Both passive and active mechanisms including volume
transmission, diffusion, and the autoreceptors play a role
in this population effect, which we study in [22].
Understanding quantitatively the balance of different
mechanisms in dopaminergic cells and cell populations
may be crucial for determining proper therapeutic inter-
ventions for the dopaminergic dysfunctions mentioned in
the introduction. This is a daunting task, complicated by
the likelihood of multiple etiologies as well as interac-
tions with nondopaminergic factors [85,86]. Our future
goal is to develop the mathematical model so we can use
it to explore the variety of proposed hypotheses. We need
to understand dopaminergic signaling in the cortex as
well as in the basal ganglia in order to understand how the
symptoms of Tourette's syndrome arise [87,88]. Both
Tourette's and Parkinson's disease press us to study the
role of dopamine in shaping activity patterns in cortico-
subcortico-cortical circuits and in particular the balance of
activity among parallel circuits such as the direct and indi-
rect pathways of the basal ganglia [85,89]. Cognitive dys-
functions including Attention Deficit Hyperactivity
Habituation to increased firingFigure 11
Habituation to increased firing. At one hour, the firing
rate of the neuron is increased from 5 Hz to 15 Hz and eda
immediately triples. Then eda gradually decreases to an inter-
mediate value since the increased binding of eda to the
autoreceptors inhibits TH and this causes a gradual decline in
vesicular dopamine over a nine hour period. Thus the level of
eda habituates to the increased firing rate.
Theoretical Biology and Medical Modelling 2009, 6:21 />Page 18 of 20
(page number not for citation purposes)
Disorder have been attributed to such factors as altered
dopamine synthesis [90] and to identified mutations
altering the behavior of DATs[91]. Modeling the effects of
differential density of DATs [92] or vesicles [84] in
dopaminergic neuron populations may help explain why,
in the Parkinsonian process of dopaminergic neurodegen-
eration, neurons projecting to the striatum are characteris-
tically affected earlier than those projecting to other areas
such as the Nucleus Accumbens [93].
Conclusion
Dopaminergic systems must respond robustly to impor-
tant biological signals such as bursts, while at the same
time maintaining homeostasis in the face of normal bio-
logical fluctuations in inputs, expression levels, and firing
rates. This is accomplished through the cooperative effect
of many different homeostatic mechanisms including
special properties of tyrosine hydroxylase, the dopamine
transporters, and the dopamine autoreceptors. Under-
standing quantitatively the effects of these homeostatic
mechanisms in normal and pathological situations is cru-
cial for the design of therapeutic strategies in a number of
neurodegenerative diseases and neuropsychiatric disor-
ders.
Competing interests
The authors declare that they have no competing interests.
Authors' contributions
All three authors (JB, MR, HFN) contributed equally to the
formulation of the model, the estimation of parameters,
experimentation with the model, the biological interpre-
tations and conclusions, and the writing and editing of
the manuscript. All authors read and approved the final
manuscript.
Acknowledgements
The authors thank Marc Caron and Raul Gainetdinov for helpful discus-
sions. This work was supported by NSF grant DMS-061670 (MR, HFN),
NSF agreement 0112050 through the Mathematical Biosciences Institute
(JB, MR), AFOSR grant FA9550-06-1-0033 (JB) and NIH grant RO1
CA105437 (MR, HFN).
References
1. Dichiara G, Bassareo V, Fenu S, Luca MD, Spina L, Cadoni C, Acquas
E, Carboni E, Valentini V, Lecca D: Dopamine and drug addiction:
the nucleus accumbens shell connection. Neuropharmacol 2004,
47:227-241.
2. Kuchel O, Kuchel G: Peripheral dopamine in pathophysiology
of hypertension. Interaction with aging and lifestyle. Hyper-
tension 1991, 18:709-721.
3. Feldman R, Meyer J, Quenzer L: Principles of Neuropharmacology Sun-
derland, MA.: Sinauer Associates, Inc; 1997.
4. Cooper J, Bloom F, Roth R: The Biochemical Basis of Neuropharmacol-
ogy New York, NY: Oxford U. Press; 2003.
5. Halbach OBU, Dermietzel R: Neurotransmitters and Neuromodulators,
Handbook of Receptors and Biological Effects Weinheim: Wiley BCH-
Verlag; 2002.
6. Dzirasa K, Ribiero S, Costa R, Santos L, Lin S, Grossmark A, Sotnik-
ova T, Gainet-dinov R, Caron M, Nicolelis M: Dopaminergic con-
trol of sleep-wake states. J Neurosci 2006, 26:10577-10589.
7. Wise R: Dopamine, learning and motivation. Nature Rev Neuro-
sci 2004, 5:1-12.
8. Schultz W: Multiple reward signals in the brain. Nat Rev Neurosci
2000, 1:199-207.
9. Graybiel A, Flaherty TA, Kimura M: The basal ganglia in adaptive
motor control. Science 1994, 265:1826-1831.
10. DeLong M: Primate models of movement disorders of basal
ganglia origin. TINS 1990, 13:281-285.
11. Nieoullon A: Dopamine and the regulation of cognition and
attention. Prog Neurobiol 2002, 571:1-31.
12. Jay T: Dopamine: a potential substrate for synaptic plasticity
in memory mechanisms. Prog Neurobiol 2003, 69:375-390.
13. Arbuthnott G, Ingham C, Wickens J: Dopamine and synaptic plas-
ticity in the neostriatum. J Anatomy 2000, 196:587-596.
14. Yao WD, Gainetdinov R, Arbuckle M, Sotnikova T, Cyr M, Beaulieu
JM, Torres G, Grant S, Caron M: Identification of PSD-95 as a
regulator of dopamine-mediated synaptic and behavioral
plasticity. Neuron 2004, 41:625-638.
15. Kienast T, Heinz A: Dopamine in the diseased brain. CNS Neuro
Disord - Drug Targ 2006, 5:109-131.
16. Lotharius J, Brundin P: Pathogenisis of Parkinson's disease:
dopamine vesicles and
α
-synuclein. Nature Rev Neurosci 2002,
3:932-942.
17. Jankovic J: Tourette's syndrome. N Engl J Med 2001,
345:1184-1192.
18. Heaton J: Central neural pharmacological agents and mecha-
nisms in erectile dysfunction: the role of dopamine. Neurosci
Biobehav Rev 2000, 24:561-569.
19. Gainetenov R, Jones S, Fumagalli F, Wightman R, Caron M: Reevalu-
ation of the role of the dopamine transporter in dopamine
system homeostasis. Brain Res Rev 1998, 26:148-153.
20. Roth R, Elworth J: Biochemical pharmacology of midbrain
dopamine neurons. In Psychopharmacology: The Fourth Generation
of Progress Raven, New York; 1995:227-243.
21. Palop J, Chin J, Mucke L: A Network dysfunction perspective on
neurodegenerative diseases. Nature 2006, 443:769-773.
22. Reed M, Best J, Nijhout H: Passive and active stabilization of
dopamine in the striatum. BioScience Hypotheses 2009, 2:240-244.
23. Nakashima A, Mori K, Suzuki T, Kurita H, Otani M, Nagatsu T, Ota
A: Dopamine inhibition of human tyrosine hydroxylase type
I is controlled by the specific portion of the N-terminus of
the enzyme. J Neurchem 1999, 72:2145-2153.
24. Jones S, Gainetdinov R, Jaber M, Giros B, Wightman R, Caron M: Pro-
found neuronal plasticity in response to inactivation of the
dopamine trasporter. PNAS 1998, 95:4029-4034.
25. Sotnikova T, Beaulieu JM, Barak L, Wetsel W, Caron M, Gainetdinov
R: Dopamine-independent locomotor actions of ampheta-
mines in a novel acute mouse model of parkinson disease.
PLOS Biology 2005, 3:1488-1500.
26. Kehr W, Lindqvist ACM, Magnusson , Atack C: Evidence for a
receptor-mediated feedback control of striatal tyrosine
hydroxylase activity. J Pharm Pharmacol 1972, 24:744-746.
27. Walters J, Roth R: Dopaminergic neurons: drug-induced antag-
onism of the increase in tyrosine hydroxylase activity pro-
duced by cessation of impulse flow. J Pharmacol Exp Ther 1974,
191:82-91.
28. Alter C, Boyer W, Oei E, Wood P: Dopamine Autoreceptors
Modulate the in Vivo Release of Dopamine in the Frontal,
Cingulate and Entorhinal Cortices. J Pharmacol Exper Therap
1987, 242:115-120.
29. Pothos E, Przedborski S, Davila V, Schmitz Y, Sulzer D: D2-Like
Dopamine Autoreceptor Activation Reduces Quantal Size in
PC12 Cells. J Neurosci 1998, 18:5575-5585.
30. Urban J, Vargas G, von Zastrow M, Mailman R: Aripiprazole has
Functionally Selective Actions at Dopamine D2 Receptor-
Mediated Signaling Pathways. Neuropsychopharm 2007,
32:67-77.
31. Tissari A, Lillgals M: Reduction of dopamine synthesis inhibition
by dopamine autoreceptor activation in striatal synapto-
somes with in vivo resperine administration. J Neurochem
1993, 61:231-238.
32. Jones S, Gainetdinov R, Hu XT, Cooper D, Wightman R, Caron M:
Loss of autoreceptor functions in mice lacking the dopamine
transporter. Nature Neurosci 1999, 2:649-655.
33. Justice J, Nicolaysen L, Michael A: Modeling the dopaminergic
nerve terminal. J Neurosci Meth 1988, 22:239-252.
Theoretical Biology and Medical Modelling 2009, 6:21 />Page 19 of 20
(page number not for citation purposes)
34. Michael A, Ikeda M, Justice J: Mechanisms contributing to the
recovery of striatal releasable dopamine following MFB
stimulation. Brain Res 1987, 421:325-335.
35. Michael A, Ikeda M, Justice J: Dynamics of the recovery of releas-
able dopamine following electrical stimulation of the medial
forebrain bundle. Neurosci Lett 1987, 76:81-86.
36. Church W, Justice J, Byrd L: Extracellular dopamine in rat stria-
tum following uptake inhibition by cocaine, nomifensine and
benztropine. Eur J Pharmacol 1987, 139:345-348.
37. Porenta G, Riederer P: A mathematical model of the dopamin-
ergic synapse: stability and sensitivity analyses, and simula-
tion of Parkinson's disease. Cyber Syst 1982, 13:257-274.
38. Tretter F, Eberle E, Scherer J: A basic mathematical model of a
dopamine synapse. Cyber Syst 2002, 1:335-339.
39. Nicholson C: Interaction between diffusion and Michaelis-
Menten uptake of dopamine after iontophoresis in striatum.
Biophys J 1995, 68:1699-1715.
40. Qi Z, Miller G, Voit E: Computational systems analysis of
dopamine metabolism. PLoS ONE 2008, 3:1-10.
41. Qi Z, Miller G, Voit E: A mathematical model of presynaptic
dopamine homeostasis: implications for schizophrenia. Phar-
macopsychiatry 2008, 41:S89-S98.
42. Kaushik P, Gorin F, Vali S: Dynamics of tyrosine hydroxylase
mediated regulation of dopamine synthesis. J Comp Neurosci
2007, 22:147-160.
43. de la Fuente-Fernandez R, Schulzer M, Mak E, Caine D, Stoessl A:
Presynaptic mechanisms of motor fluctuations in Parkin-
son's disease: a probabilistic model. Brain 2004, 127:888-899.
44. Wightman R, Amatore C, Engstrom R, Hale P, Kristensen E, Kuhr W,
May L: Real-time characterization of dopamine overflow and
uptake in the rat striatum. Neurosci 1988, 25:513-523.
45. Garris P, Wightman R: Different kinetics govern dopaminergic
neurotransmission in the amygdala, prefrontal cortex, and
striatum: an in vivo voltametric study. J Neurosci 1994,
14:442-450.
46. Bergstrom B, Garris P: 'Passive stabilization' of striatal extra-
cellular dopamine across the lesion spectrum encompassing
the presymptomatic phase of Parkinson's disease: a volta-
metric study in the 6-OHDA-lesioned rat. J Neurochem 2003,
87:1224-36.
47. Montague P, McClure S, Baldwin P, Phillips P, Budygin E, Stuber G, Kil-
patrick M, Wightman R: Dynamic gain control of dopamine
delivery in freely moving animals. J Neurosci 2004,
24:1754-1759.
48. Venton B, Zhang H, Garris P, Sulzer D, Phillips P, Wightman R: Real-
time decoding of dopamine neurotransmission in the cau-
date-putamen during tonic and phasic firing. J Neurochem
2003, 87:1284-1295.
49. Dickinson J, Rosenblum H, Hamilton P: Ion exchange chromatog-
raphy of the free amino acids in the plasma of the newborn
infant. Pediatrics 1965, 36:2-13.
50. Long C, (Ed): Biochemists' Handbook Princeton, NJ: Van Nostrand;
1961.
51. Kilberg M, Haussinger D: Mammalian Amino Acid Transport, Mecha-
nisms and Control New York: Plenum Pr; 1992.
52. Michal G: Biochemical Pathways: An Atlas of Biochemistry and Molecular
Biology New York: Wiley; 1999.
53. Mains R, Patterson P: Primary cultures of dissociated sympa-
thetic neurons. II. Initial studies on catecholamine metabo-
lism. J Cell Biol 1973, 59:346-360.
54. Coenen H, Kling P, Stocklin G: Cerebral metabolism of L-[2-
18F]fluorotyrosine, a new PET tracer of protein synthesis. J
Nucl Med 1989, 30:1367-1372.
55. Cumming P, Asa A, Kuwabara H, Gjedde A: [3H]DOPA formed
from [3H]tyrosine in living rat brain is not committed to
dopamine synthesis. J Cereb Blood Flow Metab 1998, 18:491-499.
56. Bongiovanni R, Young D, Newbould E, Jaskiw E: Increased striatal
dopamine synthesis is associated with decreased tissue levels
of tyrosine. Brain Res 2006, 1115:
26-36.
57. Fernstrom J, Fernstrom M: Dietary effects on tyrosine availabil-
ity and cat-acholamine synthesis in the central nervous sys-
tem: possible relevance to the control of protein intake. Proc
Nutr Soc 1994, 53:419-429.
58. Bongiovanni R, Kirkbride B, Walmire P, Jaskiw E: Tyrosine admin-
istration does not affect desipromine-induced dopamine lev-
els as measured in vivo in prefrontal cortex. Brain Res 2005,
1054:203-206.
59. Ribiero P, Wang Y, BA BC, Kaufman S: Regulation of recombinant
rat ty-rosine hydroxylase by dopamine. PNAS 1992,
89:9593-9597.
60. Royo M, Daubner S, Fitzpatrick P: Effects of mutations in tyrosine
hydroxylase associated with progressive dystonia on the
activity and stability of the protein. Proteins 2004, 58:14-21.
61. Benoit-Marand M, Borrelli E, Gonon F: Inhibition of Dopamine
Release Via Presynaptic D2 Receptors: Time Course and
Functional Characteristics In Vivo. J Neurosci 2001,
21:9134-9141.
62. Koeltzow T, Xu M, Cooper D, Hu XT, Tonegawa S, Wolf M, White
F: Alterations in dopamine release but not dopamine autore-
ceptor function in dopamine D3 receptor mutant mice. J
Neurosci 1998, 18:2231-2238.
63. Glowinski SMJ, Hamon M: Presynaptic Dopamine Autorecep-
tors Control Tyrosine Hydroxylase Activation in Depolar-
ized Striatal Dopaminergic Terminals. J Neurochem 1986,
46:12-22.
64. Missale C, Nash S, Robinson S, Jaber M, Caron M: Dopamine
Receptors: From Structure to Function. Physiol Rev 1998,
78:189-225.
65. Floor E, Leventhal P, Wang Y, Meng L, Chen W: Dynamic storage
of dopamine in rat brain synaptic vesicles in vitro. J Neurochem
1995, 64:689-699.
66. Wallace L: A small dopamine permeability of storage vesicles
membranes and end product inhibition of tyrosine hydroxy-
lase are sufficient to explain changes occurring in dopamine
synthesis and storage after inhibition of neuronal firing. Syn-
apse 2007, 61:715-723.
67. O'Carroll A, Fowler C, Phillips J, Tipton ITK: The deamination of
dopamine by human brain monoamine oxidase. Specificity
for the two enzyme forms in seven brain regions.
Arch Phar-
macol 1983, 322:198-202.
68. Rivett A, Roth J: Kinetic studies on the O-methylation of
dopamine by human brain membrane-bound catechol O-
methyltransferase. Biochem 1982, 21:1740-1742.
69. Karoum F, Norton H, Wyatt R: The dynamics of dopamine
metabolism in various regions of rat brain. Eur J Pharmacol
1977, 44:311-318.
70. Dedek J, Baumes R, Tien-Duc N, Gomeni R, Korf J: Turnover of
free and conjugated (sulphonyloxy) dihydrophenylacetic acid
and homovanillic acid in rat striatum. J Neurochem 1979,
33:687-695.
71. Haldane J: Enzymes New York: Longmans, Green and Co; 1930.
72. Nijhout H, Reed M, Budu P, Ulrich C: A mathematical model of
the folate cycle: New insights into folate homeostasis. J Biol
Chem 2004, 279:55008-55016.
73. Melamed E, Hefti F, Wurtman R: Tyrosine administration
increases striatal dopamine release in rats with partial
nigrostriatal lesions. PNAS 1980, 77:4305-4309.
74. Salahpour A, Ramsey A, Medvedev I, Kile B, Sotnikova T, Holmstrand
E, Ghisi V, Nicholls P, Wong L, Murphy K, Sesack S, Wightman R, Gai-
netdinov R, Caron M: Increased amphetamine-induced hyper-
activity and reward in mice overexpresing the dopamine
transporter. PNAS 2008, 105:4405-4410.
75. Jones S, Garris P, Kilts C, Wightman R: Comparison of dopamine
uptake in the basolateral amygdaloid nucleaus, caudate-
putamen, and nucleus accumbems of the rat. J Neurochem
1995, 64:2581-2589.
76. Schmitz Y, Benoit-Marand M, Gonon F, Sulzer D: Presynaptic reg-
ulation of dopaminergic neurotransmission. J Neurochem 2003,
87:273-289.
77. Garris P, Walker Q, Wightman R: Dopamine release and uptake
both decrease in the partially denervated striatum in pro-
portion to the loss of dopamine terminals. Brain Res 1997,
753:225-234.
78. Sigal A, Milo R, Cohen A, Geva-Zatorsky N, Klein Y, Liron Y, Rosen-
feld N, Danon T, Perzov N, Alon U: Variability and memory of
protein levels in human cells. Nature 2006,
444:643-646.
79. Reynolds BHJ, Perk JHC, Miller R: Firing modes of midbrain
dopamine cells in the freely moving rat. Neuroscience 2002,
114:475-492.
Publish with BioMed Central and every
scientist can read your work free of charge
"BioMed Central will be the most significant development for
disseminating the results of biomedical research in our lifetime."
Sir Paul Nurse, Cancer Research UK
Your research papers will be:
available free of charge to the entire biomedical community
peer reviewed and published immediately upon acceptance
cited in PubMed and archived on PubMed Central
yours — you keep the copyright
Submit your manuscript here:
/>BioMedcentral
Theoretical Biology and Medical Modelling 2009, 6:21 />Page 20 of 20
(page number not for citation purposes)
80. Gonon F, Buda M: Regulation of dopamine release by impulse
flow and by autoreceptors as studied by in vivo voltametry in
the rat striatum. Neuroscience 1985, 14:765-774.
81. Robinson D, Venton J, Heien M, Wightman R: Detecting subsec-
ond dopamine release with fast-scan cyclic voltametry in
vivo. Clinical Chemistry 2003, 49:1763-1773.
82. Heien M, Wightman R: Phasic dopamine signaling during behav-
ior, reward, and disease states. CNS Neuro Disord - Drug Targ
2006, 5:99-108.
83. Venton B, Wightman R: Psychoanalytical electrochemistry:
dopamine and behavior. Anal Chem 2003, 75:414A-421A.
84. Reimer R, Fon E, Edwards R: Vesicular neurotransmitter trans-
port and the presynaptic regulation of quantal size. Curr Opin
Neurobiol 1998, 8:405-412.
85. Leckman J, Peterson B, Anderson G, Arnsten A, Pauls D, Cohen D:
Pathogenesis of Tourette's Syndrome. J Child Psychol Psychiat
1997, 38:119-142.
86. Sawa A, Snyder S: Schizophrenia: diverse approaches to a com-
plex disease. Science 2002, 296:692-695.
87. Leckman J: Tourette's Syndrome. The Lancet 2002,
360:1577-1586.
88. Comings D: A controlled study of Tourette's sundrome. VII.
Summary: A common genetic disorder causing disinhibition
of the limbic system. Am J Hum Genet 1987, 41:839-866.
89. Smith Y, Bevan M, Bolam J: Microcircuitry of the direct and indi-
rect pathways of the basal ganglia. Neuroscience 1998,
86:353-387.
90. Forssberg H, Fernell E, Waters S, Waters N, Tedroff J: Altered pat-
tern of brain dopamine synthesis in male adolescents with
attention deficit hyperactivity disorder. Behavioral and Brain
Functions 2006, 2:40.
91. Hahn M, Blakely R: Monoamine transporter gene structure and
polymorphisms in relation to psychiatric and other complex
disorders. Pharmacogenom J 2002, 2:217-235.
92. Nirenberg M, Chan J, Pohorille A, Vaughan R, Uhl G, Kuhar M, Pickel
V: The dopamine transporter: comparative ultrastructure of
dopaminergic axons in limbic and motor compartments of
the nucleus accumbens. The J Neurosci 1997, 17:6899-6907.
93. Miller G, Gainetdinov R, Levey A, Caron M: Dopamine transport-
ers and neuronal injury. Trends in Pharmacological Sciences 1999,
20:424-429.
94. Siaterli M, Vassilacopoulou D, Fragoulis E: Cloning and expression
of human placental L-Dopa decarboxylase. Neurochem Res
2003, 28:797-803.
95. Armarego W, Ohnishi A, Taguchi H: New pteridine substrates
for dihydropteridine reductase and horseradish peroxidase.
Biochem J 1986, 234:335-342.
96. Bailey S, Ayling J: 6,6-Dimethylpterins: stable quinoid dihydrop-
terin substrate for dihydropteridine reductase and tetrahy-
dropterin cofactor for phenylalanine hydroxylase. Biochem
1983, 22:1790-1798.
97. Firgaira F, Cotton R, Jennings I, Danks D: Use of naphthoquinone
adsorbant for the isolation of human dihydropteridine
reductase. Meth Enzymol 1987, 142:116-126.
98. Firgaira F, Cotton R, Danks D: Isolation and characterization of
dihydropteridine reductase from human liver. Biochem J 1981,
97:31-43.
99. Schomburg D, Schomburg I: 6,7-Dihydropteridine Reductase.
Springer Handbook of Enzymes 2005, 23:248-272.
100. Craine J, Hall E, Kaufman S: The isolation and characterization
of dihydropteridine reductase from sheep liver. J Biol Chem
1972, 247:6082-6091.
101. Sherman D, Henry J: The catecholamine carrier of bovine chro-
maffin granules. Molec Pharamacol 1983, 23:431-436.
102. Near J: [3H]Dihydrotetrabenazine binding to bovine striatal
synaptic vesicles. Mol Pharmacol 1986, 30:
252-257.
103. Volz T, Hanson G, Fleckenstein A: Kinetic analysis of develop-
mental changes in vesicular monoamine transporter-2 func-
tion. Synapse 2006, 60:474-477.
104. Morgenroth V, Walters J, Roth R: Dopaminergic neurons - alter-
ation in the kinetic properties of tyrosine hydroxylase after
cessation of impulse flow. Biochemical Pharacology 1976,
25:655-661.