Báo cáo y học: "Hypofractionated radiotherapy has the potential for second cancer reduction" pps
Bạn đang xem bản rút gọn của tài liệu. Xem và tải ngay bản đầy đủ của tài liệu tại đây (544.17 KB, 8 trang )
RESEA R C H Open Access
Hypofractionated radiotherapy has the potential
for second cancer reduction
Uwe Schneider
1,2*
, Jürgen Besserer
1
, Andreas Mack
1
* Correspondence:
1
Radiotherapy Hirslanden AG,
Institute for Radiotherapy, Rain 34,
5001 Aarau, Switzerland
Abstract
Background and Purpose: A model for carcinoma and sarcoma induction was used
to study the dependence of carcinogenesis after radiotherapy on fractiona tion.
Materials and methods: A cancer induction model for radiotherapy doses including
fractionation was used to mode l carcinoma and sarcoma induction after a radiation
treatment. For different fractionation schemes the dose response relationships were
obtained. Tumor inductio n was studied as a function of dose per fraction.
Results: If it is assumed that the tumor is treated up to the same biologically
equivalent dose it was found that large dose fractions could decrease second cancer
induction. The risk decreases approximately linear with increasing fraction size and is
more pronounced for sarcoma induction. Carcinoma induction decreases by around
10% per 1 Gy increase in fraction dose. Sarcoma risk is decreased by about 15% per
1 Gy increase in fractionation. It is also found that tissue which is irradiated using
large dose fractions to dose levels lower than 10% of the target dose potentially
develop less sarcomas when compared to tissues irradiated to all dose levels. This is
not observed for carcinoma induction.
Conclusions: It was found that carcinoma as well as sarcoma risk decreases with
increasing fractionation dose. The reduction of sarcoma risk is even more
pronounced than carcinom a risk. Hypofractionati on is potentially beneficial with
regard to second cancer induct ion.
Introduction
Although the increased risk for radiotherapy patients to develop a secondary malig-
nancy is small, it is statistically significant, in particular for long time survivors of
treatment. As a consequence of better radiation treatment modalities available, can-
cer cure rates have increased. As a result, there are now many long term survivors
of cancer who are at risk of late effects of therapy, including secondary cancers.
Hypo-fractionated treatment schedules are proposed for several types of cancers,
including cancer of the breast [1-4], prostate [5-7] and lung [8,9]. Although such treat-
ment options are still related to major concerns such as the uncertainty to predict the
correct complication probabilities of normal tissues and control probabil ities for tumor
tissue it might be of interest to study their impact on radiation induced cancer.
Estimates of radiation carcinogenesis after radiotherapy can be based on epidemio-
logical studies of patients tr eated with old techniques. However, most of the epide-
miological studies, which are published in a large number, don’ tprovidea
Schneider et al. Theoretical Biology and Medical Modelling 2010, 7:4
/>© 2010 Schneider et al; licensee BioMed Central Ltd. Thi s is an Open Access article distribute d under the terms of the Creative
Commons Attribution License ( which permits unrestricte d use, distribution, and
reproduction in any medium, provided the original work is properly cited.
correlation of cancer inductio n with dose. Unfortunately, if a do se correlation is
deduced, cancer induction is usually related to integral d ose or average organ dose
and thus implies a linear dose-response relationship. Thus, such data cannot be used
directly to obtain non-linear dose-response relationships for radiotherapy. Therefore,
as an alternative cancer risk models can be used to estimate second malignancies
after radiotherapy. Those models can be validated with epidemiologic studies.
Sachs and Brenner [10] developed a discrete algebraic model of dose-dependent can-
cer risk, incorporating cell killing and proliferation/repopulation effects. In this report
we use a model based on a continuous approach with a dose variation from zero to
the total delivered dose which leads to an analytic representation of cancer risk. The
model includes fractionation ef fects and distinguishes between carcinoma and sarcoma
induction.
Materials and methods
For modeling cancer risk after fractionated radiotherapy it is assumed that the tissue
or organ of interest consists of N
0
cells before it is irradiated. At this stage there is
no distinction between cells which represent a particular function and do not divide
and stem cells which are dividing. The tissue is now irradiated with a fractionated
treatment schedule of equal dose fractions d up to a dose D. The number of original
cells after irradiation is reduced by cell kill. A number of N cells survive one dose
fraction. Cell kill is proportional to a’ which is defined using the linear quadratic
model
(1)
where D
T
and d
T
is the prescribed dose to the target volume with the correspond-
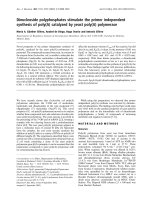
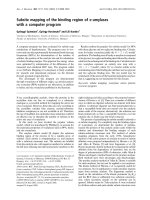
ing fractionation dose, respectively. Fig. 1 shows a compartmental diagram of the
modeled processes. It is further assumed for this work, that the number of killed ori-
ginal tissue cells N
0
-N is replaced by a number of new cells N
R
with a repopulation
rate which is proportional to N
0
-N-N
R
. Here it i s assumed that the repo pulation
kinetics of repopulated cells will follow the same basic patterns as those of normal
cells. Cells which were irradiated can be mutated and have the potential to develop a
tumor. In the context of this work the word “mutation” is used as a synony m for
each cell transformation which results in a new t umor cell. In fact the development
of a tumor usually implies several mutations. The mutational process is m odeled
here according to the linear-no-threshold model and thus cancer risk originating
from an irradiation with one dose fraction d is taken proport ional to μ which is the
slope of cancer induction from the linear-no-threshold model which is mainly based
on the dat a of the A-bomb survivors. If is now assumed that the number of involved
cells is treated as a continuous function of dose a syste m of differential equations
derived from the cell kinetics as described in Fig. 1 can be solved [11]. The excess
absolute risk for carcinoma induction is then
(2)
Schneider et al. Theoretical Biology and Medical Modelling 2010, 7:4
/>Page 2 of 8
and for sarcoma induction
(3)
where R is the repopulation parameter which characterizes the ability of the tissue to
repopulate. Risk was computed for different fractionation schemes using Equs. 2 and 3.
Results
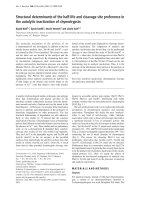
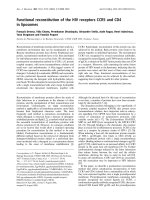
Fig. 2 shows lung carcinoma risk as a function of equivalent dose corresponding to
2Gyfractions(NTD2).NTD2isusedheresince different fractionation schedule s
result in dif ferent biological effectiveness for the same physical dose. Thus in radio-
therapy it is convenient to use the dose which would result in the same biological
effect as a 2 Gy fractionation schedule (NTD2). The solid line represents carcinoma
risk for a treatment up to 50 Gy target dose in 2 Gy fractions, the dotted line up to
42 Gy in 3 Gy fractions and the dashed line up to 30 Gy in 5 Gy fractions. Computa-
tions were done using an a/b = 3 Gy. It should be noted here that the dose plotted in
Figure 1 Diagram of the cell kinetics which were assumed in the presented model. M indicates the
number of mutated cells for both sarcoma and carcinoma induction and M
C
indicates mutated cells only
for the case of carcinoma induction.
Schneider et al. Theoretical Biology and Medical Modelling 2010, 7:4
/>Page 3 of 8
Fig. 2 is absorbed dose in healthy tissue. Therefore a data point on the dose axis corre-
sponds to different daily dose fraction. For example the 25 Gy data point would corre-
spond to 1.0 Gy, 1.8 Gy and 4.2 Gy daily dose fractions for the 2 Gy, 3 Gy and 5 Gy
target fractionation schedule. The initial slope μ for this figure was obtained from the
analysis of the A-bomb survivors [12,13]. The A-bomb data were used for an age at
exposure of 48.5 years and attained age of 59 years, since those data are characteristic
for a popu lation of treated Hodgk in ’s patients [14]. T his example is chosen as Hodg-
kin’s patients which were treated with radiation are at a significant enhanced risk for
lung cancer [14]. The initial slope μ is then 2.8 per 10000 PY per Gy per year. The
other parameters were a =0.10Gy
-1
, a/b =3GyandR = 0.7. Fig. 2 shows a signifi-
cant advantage for large dose fractionations with respect to cancer induction.
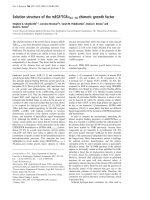
The risk ratio for a 3 Gy fractionat ion relativ e to a 2 Gy schedule is shown in Fig. 3
bot h for carcinoma and sarcoma induction as a function of dose relative to the target
dose. Carcinoma risk reduction is for the whole dose range more or less constant in
contrast to sarcoma risk reduction which varies significantly with dose and is larger for
tissue which receive s only small dose. It should be noted here that the relative risks
(with regard to fractionation) are independent of the initial slope μ of the dose
response curve since μ cancels out when using ratios of Equs. 2 and 3, respectively.
Thus the relative risks between different fractionation schedules are in a first approxi-
mation independent of the type of cancer.
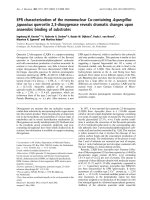
Fig. 4 shows the risk relative to a 2 Gy fractionation scheme quantitatively as a function
of fraction size for a 50 Gy NTD2 treatment. The error bars represent the variation of the
risk ratio over the complete dose range. A 3 Gy fractionation schedule for example could
result in a 10% reduction of second cancers relative to a 2 Gy fractionated treatment. It is
also shown that this advantage is more distinct for sarcoma induction than for carcinoma
induction. Since the risk advantage is approximately a linear function of fractionation dose
a simple rule yields a 10% reduction in second carcinoma risk per 1 Gy increase in fractio-
nation dose and a 13%/Gy reduction for sarcoma (a =0.10Gy
-1
, a/b =3Gy,R =0.7).
This risk reduction is dependent on the chosen model parameters. A variation of the
Figure 2 Plot of lung cancer risk per 10000 persons per year as a function of absorbed dose in
normal tissue. The solid, dotted and dashed lines represent 2 Gy, 3 Gy and 5 Gy fractions. The total dose
to the target was 50 Gy for the 2 Gy fractionation schedule and was adjusted for the other fraction sizes
(by applying the LQ-model) to achieve the same biological effect. The model parameters were for the
initial slope μ = 2.8 per 10000 PY per Gy per year, a = 0.09 Gy
-1
, a/b = 3 Gy and R = 0.7.
Schneider et al. Theoretical Biology and Medical Modelling 2010, 7:4
/>Page 4 of 8
repopulation parameter R between 0 and 1 yields a variation of carcinoma risk reduction
between 5.2% and 10.3% and of sarcoma risk reduction between 12.5% and 13.8%. A varia-
tion of a between 0.05 and 0.15 yields a variation of carcinoma risk reduction between
8.3% and 12.4% and of sarcoma risk reduction between 12.0% and 14.5%. As a conclusion
the fractionation advantage is slightly dependent on the model parameters.
Figs. 5a and 5b show second cancer risk relative to a 2 Gy fractionation as a function
of fractionation dose f or sarcoma and carcinoma, respectively. In this plot the dia-
monds represent the average dose advantage for all dose levels (as in Fig. 4). The
squares represent the dose advantage only for such tissues which receive less than 10%
of the prescribed dose, which is in this example 5 Gy (NTD2). Clearly, it can be
observed that the advantage of larger fraction sizes with respect to sarcoma induction
might be more significant for low dose volumes. On the other hand the risk reduction
for carcinomas is approximately independent of the irradiated dose.
Figure 3 Carcinoma (solid line) and sarcoma risk (dotted line) for a 3 Gy fractionation schedule
relative to a 2 Gy fractionation. The model parameters are a = 0.09 Gy
-1
, a/b = 3 Gy and R = 0.7.
Figure 4 Risk ratio between treatments with different fractionations relative to a 2 Gy fractionation
schedule plotted as a function of dose per fraction. The diamonds represent carcinoma and the
squares sarcoma induction. The bars represent the variation of risk difference for the different dose levels
including tissues which receive nearly no dose up to the target dose.
Schneider et al. Theoretical Biology and Medical Modelling 2010, 7:4
/>Page 5 of 8
Discussion
In this report a cancer induction model for the radiotherapy dose range was used. Several
assumptions had to be made to simplify the biological processes leading to cancer induc-
tion [11]. This includes the design of tissues, the repopulation process and processes
which result in the formation of a tumor cell. This was done to keep the number of model
parameters at a minimum. However, this is associated with uncertainties. It was for exam-
ple suggested [15] that some radiotherapy -induced second cance rs can be the conse-
quence of late normal tissue damage leading to a precancerous lesion. Such a mechanism
is not included in the present model.
Another assumption of the presented model is that single dose fractions of a radio-
therapy treatment are treated independently. Therefo re the linear-no-threshold theory
for cancer induction could be applied to each single dose fraction. Although this may
be valid for a single expo sure lower than 3 Gy, for fract ionatio n schedules with single
doses of more than 3 Gy the model must be used with care. In addition it is not clear
Figure 5 Risk ratio between a treatments with different fractionations relative to a 2 Gy
fractionation schedule and plotted as a function of dose per fraction. For sarcoma in a) and for
carcinoma in b). The diamonds represent the average over the whole dose range and the squares are
averages up to 10% of the target dose which is 5 Gy NTD2 in this example. The bars represent the
variation of risk ratio over the dose range.
Schneider et al. Theoretical Biology and Medical Modelling 2010, 7:4
/>Page 6 of 8
whether it can be applied for dose fractions which are separated by days when in fact
not all cells are fully repaired.
Many problems and uncertainties are involved in modeli ng the underlying biology of
radiation induced cancer. However, since very little is currently known about the shape
of dose-response relatio nships for radiation-induced cancer in the radiotherapy dose
range, this approach can be used to look at least qualitatively at the fractionation
dependence of cancer induction for carcinomas and sarcomas separately.
As the results of this report are expressed in terms of EAR it is also difficult to com-
pare them with the findings of S achs and Brenner [10] wh o fitted an algebraic model
of cancer induction to lung cancer risk.
If the fraction size is increas ed while keeping the total dose at a level which corre-
sponds to the same b iological response (LQ-model) it is shown that cancer induction
is decreasing lin early. This decrease occurs for both carcinoma and sarcoma induction,
however, the effect is more pronounced for sarcoma induction. Quantitatively a redu c-
tion of around 5% to 15% is expected while increasing the fraction size from 2 Gy to
3 Gy. As a consequence hypo-fractionated treatment techniques are with regard to
cancer induction advantageous when compared to conventional fractionation sche-
dules, as for example in prostate radiotherapy where hypofractionation is realized with
intensity modulated treatment techniques (IMRT) . However, if both a hypofractionated
treatment schedule and a new treatment technique is applied (for example a cyberknife
treatment), risk must be analysed in detail. The dose distributions resulting from
cyberknife treatments are significantly different from conventional therapy and hence
the changes in risk with regard to dose distr ibution might balance the implications of
changes in the fractionation.
Conclusions
A cancer induction model for fractionated radiotherapy was used to investigate the
impact of different fractionation schedules on second cancer risk.
It was found that carcinoma as well as sarcoma risk decreases with increasing fractio-
nation dose. This decrease is nearly linear with fra ctionation dose and is more distinct
for sarcoma induction . It was also shown that the risk advantage for the sarcoma induc-
tion is significantly dependent on the dose in the tissue and is more enhance d for tissue
irradiated with low dose (< 10% of the prescribed dose).
Author details
1
Radiotherapy Hirslanden AG, Institute for Radiotherapy, Rain 34, 5001 Aarau, Switzerland.
2
Vetsuisse Facutly, University
of Zürich, Winterthurerstrasse 260, 8057 Zürich, Switzerland.
Authors’ contributions
US contributed in constructing the model. JB analysed the biological modeling. AM was involved in applying the
results to Cyberknife treatments. All authors read and approved the final manu script.
Competing interests
The authors state that there is no conflict of interest for the authors or the author’s institution and that they have no
financial or personal relationships that inappropriately influence their actions. They have no dual commitments,
competing interests, competing loyalties, employment, consultancies, stock ownership, honoraria, or paid expert
testimony.
Received: 6 January 2010
Accepted: 11 February 2010 Published: 11 February 2010
Schneider et al. Theoretical Biology and Medical Modelling 2010, 7:4
/>Page 7 of 8
References
1. Brown SL, Rodger A, Orton CG: Point/Counterpoint. Hypofractionation is a proven safe and effective modality for
postoperative whole-breast radiotherapy for early breast cancer patients. Med Phys 2009, 36(6):1927-30.
2. Whelan TJ, Kim DH, Sussman J: Clinical experience using hypofractionated radiation schedules in breast cancer.
Semin Radiat Oncol 2008, 18(4):257-64.
3. Bartelink H, Arriagada R: Hypofractionation in radiotherapy for breast cancer. Lancet 2008, 371(9618):1050-2.
4. START Trialists’ Group, Bentzen SM, Agrawal RK, Aird EG, Barrett JM, Barrett-Lee PJ, Bentzen SM, Bliss JM, Brown J,
Dewar JA, Dobbs HJ, Haviland JS, Hoskin PJ, Hopwood P, Lawton PA, Magee BJ, Mills J, Morgan DA, Owen JR,
Simmons S, Sumo G, Sydenham MA, Venables K, Yarnold JR: The UK Standardisation of Breast Radiotherapy (START)
Trial B of radiotherapy hypofractionation for treatment of early breast cancer: a randomised trial. Lancet 2008,
29;371(9618):1098-107.
5. Macías V, Biete A: Hypofractionated radiotherapy for localised prostate cancer. Review of clinical trials. Clin Transl
Oncol 2009, 11(7):437-45.
6. Leborgne F, Fowler J: Late outcomes following hypofractionated conformal radiotherapy vs. standard fractionation
for localized prostate cancer: a nonrandomized contemporary comparison. Int J Radiat Oncol Biol Phy 2009,
74(5):1441-6.
7. Lee WR: The ethics of hypofractionation for prostate cancer. Int J Radiat Oncol Biol Phys 2009, 15;73(4):969-70.
8. Jin JY, Kong FM, Chetty IJ, Ajlouni M, Ryu S, Ten Haken R, Movsas B: Impact of Fraction Size on Lung Radiation
Toxicity: Hypofractionation May Be Beneficial in Dose Escalation of Radiotherapy for Lung Cancers. Int J Radiat
Oncol Biol Phys 2009.
9. Ng AW, Tung SY, Wong VY: Hypofractionated stereotactic radiotherapy for medically inoperable stage I non-small
cell lung cancer–report on clinical outcome and dose to critical organs. Radiother Oncol 2008, 87(1):24-8.
10. Sachs RK, Brenner DJ: Solid tumor risks after high doses of ionizing radiation. Proc Natl Acad Sci USA 2005,
102(37):13040-13045.
11. Schneider U: Mechanistic model of radiation-induced cancer after fractionated radiotherapy using the linear-
quadratic formula. Med Phys 2009, 36(4):1138-43.
12. Preston DL, Ron E, Tokuoka S, Funamoto S, Nishi N, Soda M, Mabuchi K, Kodama K: Solid Cancer Incidence in Atomic
Bomb Survivors: 1958-1998. Radiat Res 2007, 168:1-64.
13. Walsh L, Rühm W, Kellerer AM: Cancer risk estimates for X-rays with regard to organ specific doses, part I: All solid
cancers combined. Radiat Environ Biophys 2004, 43:145-151.
14. Travis LB, Gospodarowicz M, Curtis RE, Clarke EA, Andersson M, Glimelius B, Joensuu T, Lynch CF, van Leeuwen FE,
Holowaty E, Storm H, Glimelius I, Pukkala E, Stovall M, Fraumeni JF Jr, Boice JD Jr, Gilbert E: Lung cancer following
chemotherapy and radiotherapy for Hodgkin’s disease. J Natl Cancer Inst 2002, 94(3):182-92.
15. Tubiana M: Can we reduce the incidence of second primary malignancies occurring after radiotherapy? A critical
review. Radiother Oncol 2009, 91(1):4-15.
doi:10.1186/1742-4682-7-4
Cite this article as: Schneider et al.: Hypofractionated radiotherapy has the potential for second cancer reduction.
Theoretical Biology and Medical Modelling 2010 7:4.
Submit your next manuscript to BioMed Central
and take full advantage of:
• Convenient online submission
• Thorough peer review
• No space constraints or color figure charges
• Immediate publication on acceptance
• Inclusion in PubMed, CAS, Scopus and Google Scholar
• Research which is freely available for redistribution
Submit your manuscript at
www.biomedcentral.com/submit
Schneider et al. Theoretical Biology and Medical Modelling 2010, 7:4
/>Page 8 of 8