Báo cáo y học: " Research Skeletal muscle contraction. The thorough definition of the contractile event requires both load acceleration and load mass to be known" docx
Bạn đang xem bản rút gọn của tài liệu. Xem và tải ngay bản đầy đủ của tài liệu tại đây (797.98 KB, 14 trang )
© 2010 Grazi and Pozzati; licensee BioMed Central Ltd. This is an Open Access article distributed under the terms of the Creative Com-
mons Attribution License ( which permits unrestricted use, distribution, and reproduction
in any medium, provided the original work is properly cited.
Grazi and Pozzati Theoretical Biology and Medical Modelling 2010, 7:24
/>Open Access
RESEARCH
Research
Skeletal muscle contraction. The thorough
definition of the contractile event requires both
load acceleration and load mass to be known
Enrico Grazi* and Sara Pozzati
Abstract
Background: The scope of this work is to show that the correct and complete definition of
the system of muscle contraction requires the knowledge of both the mass and the
acceleration of the load.
Results: The aim is achieved by making use of a model of muscle contraction that operates
into two phases. The first phase considers the effects of the power stroke in the absence of
any hindrance. In the second phase viscous hindrance is introduced to match the
experimental speed and yield of the contraction. It is shown that, at constant force of the
load, changing load acceleration changes the time course of the pre-steady state of
myofibril contraction. The decrease of the acceleration of the load from 9.8 m.s
-2
to 1 m.s
-2
increases the time length of the pre-steady state of the contraction from a few
microseconds to many hundreds of microseconds and decreases the stiffness of the active
fibre.
Conclusions: We urge that in the study of muscle contraction both the mass and the
acceleration of the load are specified.
Background
It is a general opinion that the load (force/cross-section) determines the muscle response
(power output, force and speed of contraction). Apparently it is not realized that 1. one of
the components of the load, the force, is the product of the mass by the acceleration, 2. the
same force is generated by an infinite number of mass and acceleration couples 3. each one
of these couples displays different physical and biological effects. Let us now assume that to
a muscle, of mass, m
1
, and developing the force, F
1
, is attached a load of mass, m
2
, and force,
F
2
. Under these conditions the driving acceleration, a
d
, is,
Thus, at constant F
2
, changing m
2
, changes the driving acceleration, i.e. changes the time
course of the pre-steady state of the contraction. This means that the characterization of
muscle contraction requires the load to be defined both by its mass and by its acceleration.
We may now ask whether, in the gravitational field, it is possible to change the accelera-
tion of the load. The answer is yes. When a muscle raises a load hanging freely, this load is
associated with the acceleration of gravity. On the contrary when muscle pulls a load, rolling
* Correspondence:
1
Dipartimento di Biochimica e
Biologia Molecolare, Università
di Ferrara, Via Borsari 46, 44100,
Ferrara, Italy
Full list of author information is
available at the end of the article
aFFmm
d
=− +()/( )
12 1 2
Grazi and Pozzati Theoretical Biology and Medical Modelling 2010, 7:24
/>Page 2 of 14
(in the absence of friction) on an inclined plane, the acceleration associated with the load
depends on the inclination of the plane and is,
where, g, is the acceleration of gravity and, α, is the inclination of the plane. As a conse-
quence a constant force is maintained provided that the mass is suitably changed,
A second question is whether two loads, characterized by the same force F
2
, by two dif-
ferent couples (m
2
' a
2
') and (m
2
" a
2
") induce the same or a different response of the mus-
cle (power output, force and speed of contraction). In this work we try to answer the
question by applying a model of muscle contraction [1,2] to the data of He et al. [3]. In
short the model relates the experimental power output to the experimental speed of con-
traction by means of a constant, 1/k (s
-1
), that expresses the hindrance of the contractile
system. As a matter of fact the actual mass and the actual acceleration of the load are
unknown to He et al. [3] so we test different couples of these two parameters while keep-
ing constant the experimental power output and the experimental speed of contraction.
The result is that by decreasing the acceleration of the load the value of the constant, 1/k
(s
-1
), decreases and the time length of the pre-steady state of the contraction increases.
We conclude that a rigorous definition of muscle contraction requires the acceleration of
the load to be known and that, at constant load force, the decrease of the acceleration of
the load slows down the pre-steady state of the contraction.
Methods
The evaluation of the effect of load acceleration on the pre-steady state of muscle fibre
contraction was made on the data of He et al. [3] by making use of the model of Grazi
and Di Bona [1,2].
For the convenience of the reader the model is summarized below together with an
abbreviation section (Appendix 1).
The model operates into two phases. The first phase considers the effects of the power
stroke in the absence of any hindrance, the result being a uniformly accelerated motion.
In the second phase viscous hindrance is introduced to match the experimental speed
(i.e. a uniform rate) and the experimental yield of the contraction. In short the model
relates the experimental power output to the experimental speed of contraction by
means of a constant 1/k (s
-1
) that expresses the hindrance of the contractile system. Data
on the force - velocity curve and on the relative power outputs were taken from He et al.
[3]. In the studies of He et al. [3] the isotonic contraction of rabbit skeletal muscle fibres
was initiated by releasing ATP via a laser pulse from caged ATP and maintaining a con-
stant velocity of shortening. In our model, on the contrary, muscle fibres are subjected to
the load concomitantly with the activation and, after a pre-steady state, attain the iso-
tonic contraction. Our aim is not to mimic the experiment of He et al. [3] but to feed
their stationary data to our model.
We are dealing with different conditions but we see no reason why the experimental
data could not fit to our model.
acceleration g Sin=⋅
a
Force m g m Sin g Sin=⋅= ⋅⋅(/ )( )
aa
Grazi and Pozzati Theoretical Biology and Medical Modelling 2010, 7:24
/>Page 3 of 14
In the model the sarcomere is composed by n = 2000 elementary units [4], its cross-
section is,
and the mobile part of the half sarcomere mass, m
1
, is,
where, ρ = 1.035 g.cm
-3
, is the density of frog sartorius muscle [5]; r = 25 nm, is the dis-
tance between the centers of two adjacent actin filaments; l
s
= 2.7 μm is the sarcomere
length; 300, molecules in the tick filament; MW
M
, is the molecular mass of myosin, 520
kD [6], N, is the Avogadro's number.
First phase
The power stroke is powered by the cleavage of ATP, 7.44 10
-8
pJ per molecule (E
ATP
) [7].
Power strokes occur randomly and the sequence of these events produces muscle con-
traction [8,9].
Energy and force delivered by the power stroke are linked by,
F
1
, is the average force over the distance l at the beginning of the contraction and, l, is
the sliding of thick and thin filaments past each other, provided that E
ATP
is used up com-
pletely and that the movement occurs without hindrance.
In the presence of a load per unit area, P, the opposing force, F
2
, is.
(the factor of 2 accounts for the fact that only about half of the total cross-section of
the fiber is occupied by the contractile machinery [10] and the driving acceleration is,
m
2
, is the mass of the load,
where, a
L
, is the acceleration associated with the load.
The force generated by a single power stroke is, in general, much lower than F
2
so that
it is necessary to sum up the energy delivered by the power strokes. This is possible if the
frequency of the power strokes exceeds a given level, so that not all the energy provided
by a power stroke is used up before the following power stroke, performed by another
attached cross-bridge, occurs. This condition is fulfilled if the space, l
A
, travelled in the
time between two power strokes, is lower than, l = E
ATP
/F
1
, so that the fraction left of the
original energy, 1- |l
A
|/l, adds to the energy provided by the subsequent power stroke. To
summarize, l, is constant, its value is defined by eqn. a3, where the value of F
1
is that at
the starting of the experiment. In the pre-steady state of the contraction both F
1
and l
A
change. At the steady state both F
1
and l
A
are constant the driving acceleration, a
d
,
sn r
S
=×× ×332
2
√ /
(a1)
mn rl MW N
SM1
2
3 3 2 2 300 2=×× ×× −×(/ / /())
r
√
(a2)
EF
ATP
=×
1
l
(a3)
FsP
S2
2=× ×
(a4)
aFFmm
d
=− +()/( ),
12 1 2
(a5)
msPa
SL2
2=× ×/
(a6)
Grazi and Pozzati Theoretical Biology and Medical Modelling 2010, 7:24
/>Page 4 of 14
approaches zero. Thus bound cross-bridges make a translation of |l
A
| <l whose value
changes with the progress of the contraction and becomes fairly constant at the steady
state
The iteration procedure is as follows, The energy left after the (i-1)
th
cycle is,
The total energy available in the i
th
cycle is,
l
A
, the space traveled in the i
th
cycle in the absence of hindrance, is determined by:
and the velocity, v
(i)
,
where, t
AT
, is the time between the power strokes.
Thus at any cycle the energy available, the contractile force and the driving accelera-
tion change. In the first cycle, E
T
= E
ATP
and v = 0.
Second phase
In the second phase the uniformly accelerated motion is converted into the uniform
motion observed experimentally by introducing a viscous hindrance. To do this an
hyperbolic form is assigned to the velocity, v
V
, of the masses, m
1
and m
2
, which move
under the effect of the force F
1
[11,12],
where the reciprocal of the constant, k (s), defines the hindrance. In our system, since
driving acceleration is changing at every cycle,
where, i
vv
, the increment of velocity in the time t
AT
is,
and the space, l
V
, travelled in the i
th
cycle of time length, t
AT
, is,
Ell
Ri Ti Ai
E
() () ()
(| |/)
−− −
=−
11 1
1
(a7)
EEE
Ti ATP Ri() ( )
=+
−1
(a8)
FE
iTi1( ) ( )
/= l
(a9)
aFFmm
di i() ()
()/( )=− +
12 12
(a10)
l
A() ( ) ()
/
i i AT d i AT
vt at=+
−1
2
2
(a11)
vv at
ii diAT() ( ) ()
=+
−1
(a12)
vk a tkt
Vd
=+/( ),
(a13)
vv i
Vi v i vv
=+
−()
,
1
(a14)
i k a i t k i t k a i t k i t
vv d AT AT d AT AT
=+−−+−/( ) ( ) /( ( ) ),11
(a15)
l
V
= v t
VAT
.
(a16)
Grazi and Pozzati Theoretical Biology and Medical Modelling 2010, 7:24
/>Page 5 of 14
The total space traveled, stv, is obtained by summing up the spaces traveled in each
single cycle,
Actually to avoid calculation overflow in the iterative procedure the time increment, t
I
,
must be much lower than t
AT
. The value selected was t
I
= 10
-9
s. t
I
thus replaces t
AT
in
equations (a11), (a12), (a15) and (a16) while equation (a8) is modified accordingly,
The hypothesis is thus made that the energy, E
ATP
, is delivered uniformly in the period
t
AT
.
Operative features
The operative features were as follows. Data on the force - velocity curve were taken
from Figure six of He et al. [3], with P
0
= 190 kN.m
-2
, a/P
0
= 0.42, and b = 0.51 (Table 1).
In the original Figure six of He et al. [3] the tension is plotted as a function of the applied
shortening velocity in number of fibre length per second (ML s
-1
). We prefer, on the con-
trary, to plot the applied shortening velocity per half sarcomere (hsl.ML.s
-1
), where, hsl,
is the half sarcomere length, as a function of the relative tension, (the actual tension, P,
divided by the isometric tension, P
0
).
The ATPase rate constant as a function of the applied shortening velocity were taken
from Figure eight of He et al. [3] (Table 1). ATP consumption was assumed to be due
only to the actin-myosin ATPase since the experiments were performed in permeabi-
lized muscle fibers. From these data the time between the power strokes, t
AT
, was calcu-
lated as follows,
Where, n, is the number of thick filaments in the half sarcomere, 300 is the number of
the myosin heads in the half sarcomere, 0.96 is the fraction of myosin heads involved in
the process and, k
AT
, is the mean ATPase rate constant which changes with the load [3].
The program was operated into two steps.
a. The first step was operated in the absence of viscous hindrance and in the presence
of an external load. In this step the value of the initial F
1
was determined. Initial F
1
is
the threshold force that must be reached by the cross-bridges in order to be able to
prepare the contraction. If the threshold force is not reached the system does not
reach a positive driving acceleration and the contraction does not start. The right
value of the initial F
1
, in a given condition, is obtained by trials, starting from a low
value of F
1
and continuing with small increments until the threshold value is reached
that initiates the contraction. Although laborious the procedure is quite accurate.
b. In the second step, once the value of the initial F
1
has been found, the value of, k
(s), capable to equate the calculated velocity, v
V
, to the observed velocity, v
O
, is deter-
mined. Also in this case the search for, k (s), is made by trials. The program is
stopped at v
V
/v
O
< 1.001.
stv stv=+l
V
.
EE tt E
TATP ATR
=+
1
/
(a18bis)
tn k
AT AT
= 1 300 0 96/( . )
(a18)
Grazi and Pozzati Theoretical Biology and Medical Modelling 2010, 7:24
/>Page 6 of 14
Table 1: The velocity of contraction and the ATPase rate constant as a function of the load
P/P0
Contraction velocity, vvnm.s-1.hsl-1
ATPase rate constant, s-1
0.00526316 1610.48 18.1578
0.0526316 1380.07 17.5316
0.105263 1172.8 16.8363
0.157895 1003.28 16.1415
0.210526 862.062 15.4473
0.263158 742.604 14.7537
0.315789 640.236 14.0606
0.368421 551.535 13.3681
0.421053 473.936 12.6761
0.473684 405.477 11.9846
0.526316 344.633 11.2937
0.578947 290.2 10.6034
0.631579 241.216 9.91354
0.684211 196.902 9.22426
0.736842 156.62 8.53553
0.789474 119.843 7.84735
0.842105 86.1343 7.1597
0.894737 55.1241 6.47259
0.947368 26.5012 5.78603
In He et al. [3] the velocity of contraction, V, number of fiber length per second (ML/s), is calculated by
the equation: V = b (P
0
- P)/(P+a), Fig. 6 of He et al. [3], where P
0
= 190 kN.m
-2
; a/P
0
= 0.42; b = 0.51. In this
work the velocity of contraction was expressed in nm per second per half sarcomere: v
v
= hsl. ML.s
-1
,
where hsl = 1350 nm. The ATPase constant was calculated from the equation, ATPase rate constant (s
-1
)
= 5.1 + (18.7 × 1.94 × V)/(1+1.94 × V) where, V, is the applied shortening velocity (ML.s
-1
), 5.1 s
-1
is the
ATPase rate constant in the isometric state, 18.7 s
-1
is the ATPase rate constant for shortening at infinite
velocity [3].
Grazi and Pozzati Theoretical Biology and Medical Modelling 2010, 7:24
/>Page 7 of 14
Results
In the study of muscle contraction load and muscle are usually treated as a single system.
It may therefore appear a non-sense to talk about the acceleration of the load. In our
model, however, load and muscle are considered as separate systems at the beginning
and merge as a single system at the moment of the contraction. Under these circum-
stances the effects of the changes of the acceleration of the load on the contraction can
be traced.
Effect of the acceleration of the load on the initial F
1
In this section it is shown that, at parity of the force F
2
, the decrease of the acceleration of
the load (and the corresponding increase of the mass) decreases the initial F
1
required to
start the contraction.
In our previous work we considered the load as a weight (a
L
= 9.8 m.s
-2
) so, to change
the load, we changed its mass [1,2]. The load, however, can be changed also by changing
the acceleration while keeping constant the mass. In the following experiments the mass,
m
2iso
, obtained by dividing the isometric tension per half sarcomere (2 × s
S
× P
0
) by the
acceleration of gravity was used,
where, s
S
, is the sarcomere cross-section and, P
0
, is the isometric tension per unit area.
Thus the acceleration at the different loads was,
where, F
2
, is the force generated by the load.
So that, at each single load is,
where, g, is the acceleration of gravity.
It is shown that, at constant F
2
, lowering the acceleration of the load decreases the ini-
tial F
1
to values smaller than those required when the acceleration of the load is kept at a
constant, large value (9.8 m.s
-2
) and the value of F
2
is adjusted by changing the mass. This
is appreciated by comparing row by row the data of Table 2. At P/P
0
= 0.0526, the, F
1
,
required to prepare the contraction is 15.6 fold smaller when the load is defined by a
large mass (1.259 10
-7
kg,) and a small acceleration (0.5158 m.s
-2
) than when the load is
defined by a small mass (6.277 10
-9
kg) and a large acceleration (9.8 m.s
-2
). Thus the
divergence of the two conditions increases with the decrease of the load, this is because
both mass and acceleration in the two conditions are much more different at small load
than at large load (Table 2).
Effect of the acceleration of the load on the pre-steady state
In this section it is shown that the decrease of the acceleration of the load (at parity of
load force) delays the pre-steady state and decreases the apparent viscosity coefficient, 1/
k (s
-1
).
The overall shortening of the half sarcomere under viscous regime, stv, was obtained
by summing up the spaces traveled in each single cycle, stv = stv + l
V
. The information
fed to the system were: P/P
0
= 0.0526, ATPase rate = 17.5316 s
-1
, steady rate of shorten-
msP m s
iso S20
2
298=× ×
−
/( . )
aFm
LO iso
=
22
/
Fgma m
LO iso22 2
=× = ×
Grazi and Pozzati Theoretical Biology and Medical Modelling 2010, 7:24
/>Page 8 of 14
ing, 1380.07 nm.s
-1
.hsl
-1
, these parameters being taken from the experiment of He et al.
[3]. Since the acceleration of the load in the experiment of He et al. [3] is unknown two
cases were considered.
a. load acceleration, 9.8 m.s
-2
; load mass, 6.277 10
-9
kg. Under these conditions, to fit
the P/P
0
, the ATPase rate and the steady rate of shortening of He et al. [3], F
1
was
adjusted to 3584 pN and k to 8.32 10
-5
s.
b. load acceleration, 0.5158 m.s
-2
; load mass, 1.259 10
-7
kg. Under these conditions, to
fit the P/P
0
, the ATPase rate and the steady rate of shortening of He et al. [3], F
1
was
adjusted to 230 pN and k to 2.24 10
-4
s.
Please notice that the product of the acceleration and of the load mass is exactly the
same in the two cases.
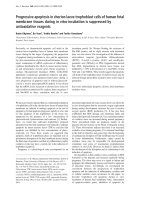
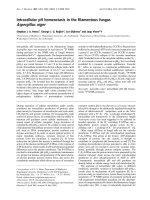
The result of the calculation is presented in Fig. 1 where the shortening of the half sar-
comere under viscous regime, stv, is illustrated. The descending limb of the curves is due
to the stretching by the load (negative values), the ascending limb represents the short-
ening due to the active reaction of the half sarcomere (negative values, shortening up to
the rest length; positive values, shortening below the rest length). In curve, a, the
descending limb of the curve (stretching by the load) has a length of 0.32 nm (0 - (-0.32))
and is reached in 31.7 μs. In curve, b, the descending limb of the curve has a length of
0.784 nm (0 - (-0.784) and is reached in 131 μs. (Incidentally, a similar behaviour was dis-
played experimentally by the tibialis anterior of the cat [4,13]). Thus, even though the
load is the same, the decrease of the acceleration of the load decreases the initial F
1
,
decreases the apparent viscosity coefficient, 1/k (s
-1
), delays the pre-steady state, in fact
the steady rate is reached in ~30 μs in curve, a, and in ~250 μs in curve, b.
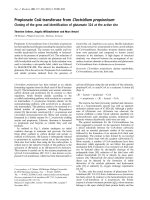
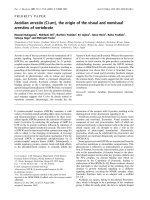
Effects of the acceleration of the load on the initial stiffness of the active half sarcomere
In this section we show that the decrease of the acceleration of the load (at parity of load
force) decreases the apparent stiffness of the half sarcomere.
Table 2: Effect of the mass and of the acceleration of the load on initial F
1
P/P0
Changing mass Changing acceleration
mass Kg
accelera-
tion m.s-2
Initial F1,
pN (1)
mass Kg
accelera-
tion m.s-2
Initial F1,
pN (2)
(1)/(2)
0.0526 6.277 10
-9
9.8 3300 1.259 10
-7
0.515 207 15.96
0.1579 1.988 10
-8
9.8 31108 1.259 10
-7
1.547 6261 4.97
0.3684 4.639 10
-8
9.8 158060 1.259 10
-7
3.61 85631 1.84
0.5789 7.29 10
-8
9.8 366025 1.259 10
-7
5.674 295915 1.24
0.7895 9.94 10
-8
9.8 641199 1.259 10
-7
7.7368 607261 1.055
0.9473 1.193 10
-7
9.8 885361 1.259 10
-7
9.284 878421 1.008
Grazi and Pozzati Theoretical Biology and Medical Modelling 2010, 7:24
/>Page 9 of 14
An estimate of the initial stiffness of the active half sarcomere is obtained by dividing
the difference between F
2
and the initial F
1
by stv
M
, the difference between the length of
the half sarcomere at the maximum extension and the rest length.
As it is shown in Fig. 2, the stiffness increases with the increase of P/P
0
but it decreases
with the decrease of the acceleration of the load. In fact, when the acceleration associ-
ated to the load decreases from 9.8 to 1 m.s
-2
, at P/P
0
= 0.789 the stiffness decreases from
3.24 to 1.43 mN.nm
-1
; at P/P
0
= 0.579 the stiffness decreases from 1.42 to 0.41 mN.nm
-1
;
at P/P
0
= 0.368 the stiffness decreases from 0.305 to 0.085 mN.nm
-1
.
Discussion
The parameter k (s), related to the viscosity of the structure, is an important feature of
the model. The viscosity originates from the interplay between water activity and the
stiffness of the structure. In fact the water activity coefficient is altered by sarcomere
stretching, by the cross-bridges attaching and detaching [14], by the formation of the
network of filaments [15]. In turn viscosity is related to water activity since any time
water activity decreases (or protein osmotic pressure increases) viscosity (and stiffness)
increase. Thus muscle contraction is ruled by the interplay between water activity, vis-
cosity and stiffness [2].
As it was shown in our previous work [1] the model also predicts a cooperative behav-
iour between the elementary sarcomere units. This was tested by comparing the behav-
iour of virtual sarcomere composed by a different number of elementary units. It was
found that the value of the initial F
1
required to initiate the contraction increased with
()/F initial F stv
M21
−
Figure 1 Distance covered in the pre-steady state. Stretching (descending limb), shortening (ascending
limb). The conditions were: P/P
0
, 0.0526. Trace a. load acceleration, 9.8 m.s
-2
; load mass, 6.277 10
-9
kg; F
1
,
3584.474 pN, k, 8.32 10
-5
s. Trace b. load acceleration, 0.5158 m.s
-2
; load mass, 1.259 10
-7
kg; F
1
, 230 pN; k, 2.24
10
-4
s.
Grazi and Pozzati Theoretical Biology and Medical Modelling 2010, 7:24
/>Page 10 of 14
the decrease of the number of the elementary units. This suggests that the elementary
units are cooperating to overcome the load.
When presenting our model for the first time [1,2] we selected the acceleration of grav-
ity as the load acceleration and the load was changed by changing the mass. As a result
the pre-steady state of the contraction was estimated to be quite rapid, a few microsec-
onds, thus beyond the possibility of an experimental check. We observe now that, at con-
stant load, the time length of the pre-steady state of the contraction increases
significantly with the decrease of the acceleration of the load. This time length may reach
the sub-millisecond, thus allowing the prediction of our model to be tested experimen-
tally.
He et al. [3], by measuring the steady rate of contraction and the accompanying
ATPase rate, provided the values of the parameters (load, velocity of the isotonic con-
traction, power output) to be fed to our model. From those data and on the basis of our
model we reconstructed the pre steady state of muscle contraction even though, as we
stated already, our model and the muscle fibres of the experiment of He et al. [3] operate
quite differently. We tacitly assumed the release of ATP from caged ATP to be immedi-
ate. The advantage of this choice is to test directly the time of reaction of the contractile
apparatus, a time that appears much faster that it is usually believed. Being more realistic
i.e. simulating a gradient of ATP concentration would make more complex the writing of
the model but would not alter the main conclusion of this work: namely that changing
the acceleration of the load changes the initial F
1
and the time course of the pre-steady
state of myofibril contraction.
At the same load, P/P
0
, 0.0526, at the same ATPase rate, 17.5316 s
-1
and at the same
steady rate of shortening, 1380.07 nm.s
-1
.hsl
-1
, the half sarcomere is stretched differently
depending on the mass and on the acceleration of the load. At the load acceleration of 9.8
m.s
-2
and load mass of 6.277 10
-9
kg the half sarcomere is stretched by 0.32 nm in 31.7 μs.
At the load acceleration of 0.5158 m.s
-2
and load mass of 1.259 10
-7
kg the half sarcomere
Figure 2 Stiffness of the half sarcomere as a function of the acceleration of the load. Filled circles, P/P
0
=
0.368; open circles, P/P
0
= 0.579; triangles, P/P
0
= 0.789.
Grazi and Pozzati Theoretical Biology and Medical Modelling 2010, 7:24
/>Page 11 of 14
is stretched by 0.784 nm in 131 μs. Moreover, according to our model, both the initial
force and the initial stiffness of the active half sarcomere decrease with the decrease of
the acceleration associated to the load. These effects are the direct consequence of the
equation of motion used,
where the relevance of the acceleration of the load is recognized.
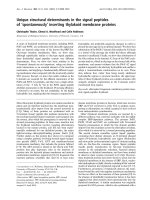
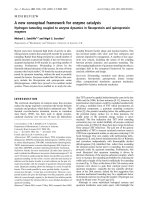
According to the classic view the assumed length of the working stroke is as low as 4
nm and take place in a few ms [16], in our model, on the contrary, the working stroke is
much shorter and much more rapid. We define the length of the working stroke (lstr) as
the distance spanned by the active sarcomere in the time between two power strokes,
t
AT
. This definition may appear too wide since it includes both stretching and contrac-
tion. However there is a smooth transition between the two conditions: in the first F
1
succumbs to F
2
, in the second F
1
overcomes F
2
. The length of the working stroke is calcu-
lated by summing up the distances, l
V
, spanned in t
AT
/t
l
~ 137 consecutive cycles of the
program. As it is shown in Fig. 3, the length of the putative working stroke first increases
up to 0.00014 nm at the end of sarcomere stretching then stabilized at 0.000065 nm in
the steady state. These are incredibly low figures. This is because the effect of a single
working stroke is averaged between the 2000 elementary units of the sarcomere. Inci-
dentally, the lengths of the working stroke are not influenced by the change of the accel-
eration of the load from 0.5 m.s
-2
to 9.8 m.s
-2
.
The difference between our view and the classic view is partly explained by the fact
that our model tests directly the contractile apparatus while experimental tests are "con-
taminated" by accessory compliances that slow down the phenomenon. We report small
(0.04 - 0.784 nm) and very fast (40 - 131 μs) stretching of the half sarcomere. Stretching is
mostly the result of the visco-elastic distortion of the lever arm plus the compliance of
the thick and thin filaments. Stretching is not an all or none but a relatively continuous
event. So it should not be surprising that the smaller the distortion the faster the event.
Our experimental settings are presently unable to record extremely short stretches. This
does not means that our model is wrong.
Many reports show that the ATPase rate depends on the load [3,17-19]. No informa-
tion however is available on the effect of the change of the mass-acceleration couple at
constant load. Tentatively we assumed that, at constant load, muscle power output (i.e.
the ATPase rate constant) and the steady rate of shortening do not change with the accel-
eration associated to the load. Nevertheless, owing to the very fine regulation of muscle
contraction, we do not exclude that a change may occur. Perhaps the introduction of the
acceleration of the load in the pre-steady could help unraveling some debated questions
on muscle mechanism. It is clear however that to achieve this result the model should be
confronted with experiments specifically addressed to those questions. It is sometime
recognized, explicitly or implicitly, that, during acceleration, the load on the contracting
muscle continuously changes because, as the mass accelerates, the force produced by the
muscles changes due to force-velocity and length-tension effects. The changing muscle
force in turn affects the acceleration of the load [20-22].
In general, however, in the studies on myofibril contraction very precise measurements
of the force-length relationship are performed but no explicit mention of the value of the
aFFmm
d
=− +()/( )
12 1 2
Grazi and Pozzati Theoretical Biology and Medical Modelling 2010, 7:24
/>Page 12 of 14
acceleration associated to the load is provided. Since the time length of the pre-steady
state of the contraction is determined by the acceleration associated to the load we urge
this parameter to be explicitly mentioned in the experiments.
Conclusions
In the studies on myofibril contraction very precise measurements of the force-length
relationship are performed without mentioning the value of the acceleration associated
to the load.
Figure 3 The length of the power strokes. The length of the power stroke was calculated by summing up
the distances, l
V
, spanned in t
AT
/t
l
~ 137 consecutive cycles of the program. Upper part of the figure: P/P
0
=
0.421; a
L
= 0.5 m.s
-2
; F
1
= 228.43 pN; k = 2.26 10
-4
s. Lower part of the figure: P/P
0
= 0.421; a
L
= 9.8 m.s
-2
; F
1
=
2030.66 pN; k = 2.467 10
-5
s.
Grazi and Pozzati Theoretical Biology and Medical Modelling 2010, 7:24
/>Page 13 of 14
According to our model, with the decrease of this acceleration the time length of the
pre-steady state of the contraction increases up to the millisecond thus allowing our pre-
dictions to be tested experimentally.
Furthermore both the initial F
1
(the initial force needed to start the contraction) and
the initial stiffness of the active myofibril decrease with the decrease of the acceleration
of the load. Thus, at constant load, the decrease of the acceleration induces the decrease
of the stiffness.
All these features strongly suggest that the value of the acceleration of the load should
be mentioned in all the experiments on muscle contraction.
Appendix 1 - Abbreviations
a
d
driving acceleration
a
L
acceleration of the load
E
ATP
free energy of hydrolisis of one molecule of ATP in muscle
E
R
energy left after the (i-1)
th
cycle
E
T
total energy available in the I
th
cycle
F
1
force of the half sarcomere
F
2
force of the load
i number of the cycles
i
VV
increment of velocity in the time t
AT
l = E
ATP
/initial F
1
l
A
space travelled in the absence of hindrance in the time between two power strokes
l
S
sarcomere length
l
V
space travelled in the presence of hindrance in the time between two power strokes
1/k (s
-1
) hindrance of the contractile system
m
1
mass of the mobile part of the half sarcomere
m
2
mass of the load
n = 2000 number of the elementary units
P tension per unit area
P
0
isometric tension per unit area
r = 25 nm distance between the centers of two adjacent actin filaments
s
S
sarcomere cross-section
stv total space travelled in the presence of hindrnce
t
AT
time between the power strokes
t
I
time length of the cycles
v velocity in the absence of hindrance
v
V
velocity in the presence of hindrance
Competing interests
The authors declare that they have no competing interests.
Authors' contributions
EG has made the conception and design of the manuscript; SP has contributed to the analysis and to the interpretation of
the data. Both authors read and approved the final version.
Acknowledgements
This work was supported by grants of the Ferrara University and of the Fondazione della Cassa di Risparmio di Ferrara.
Grazi and Pozzati Theoretical Biology and Medical Modelling 2010, 7:24
/>Page 14 of 14
Author Details
Dipartimento di Biochimica e Biologia Molecolare, Università di Ferrara, Via Borsari 46, 44100, Ferrara, Italy
References
1. Grazi E, Di Bona C: Cooperative behaviour of the elementary sarcomere units and the cross-bridge step size.
Biophys Chem 2005, 118:113-117.
2. Grazi E, Di Bona C: Viscosity as an inseparable partner of muscle contraction. J Theoret Biol 2006, 242:853-861.
3. He ZH, Rodney RH, Chillinworth RK, Brune M, Corrie JET, Webb MR, Ferenczy MA: The efficiency of contraction in
rabbit skeletal muscle fibres, determined from the rate of release of inorganic phosphate. J Physiol 1999,
517:839-854.
4. Ernst E: Sliding friction contra sliding hypothesis. Acta Biochim et Biophys Acad Sci Hung 1977, 12:83-85.
5. Truong XT: Viscoelastic wave propagation and rheologic properties of skeletal muscle. Am J Physiol 1974,
226:256-265.
6. Margossian SA, Lowey S: Preparation of myosin and its subfragments from rabbit skeletal muscle. Methods
Enzymol 1982, 85:55-71.
7. Kushmeric MJ: Appendix. Free energy of ATP hydrolysis in the sacoplasm. Proc Roy Soc Lond B 1969, 174:348-353.
8. Duke TAJ: Biophysics Molecular model of muscle contraction. Proc Natl Acad Sci USA 1999, 96:2770-2775.
9. Huxley HE: Fifty years of muscle and the sliding filament hypothesis. Eur J Biochem 2004, 271:1403-1415.
10. Merah Z, Morel JE: Isometric tension exerted by a myofibril of the frog at 0°C: geometrical considerations. J
Muscle Res Cell Motil 1993, 14:552-553.
11. Muller W: Zum Problem der Anlaufstromung einer Flussigkeit im geraden Rohr mot Kìreisring und
Kreisquerschnitt. Ztschr f angevw Math and Mec 1932, 16:227-238.
12. Szymanski PJ: Math pures appl 1932, Series 9 II:67-107.
13. Baratta RV, Solomonow M, Nguyen G, D'Ambrosia R: Load, length, and velocity of load-moving tibialis anterior
muscle of the cat. J Applied Physiology 1996, 80:2243-2249.
14. Grazi E, Cintio O: Thermodynamic features of myosin filament suspensions: Implications for the modeling of
muscle contraction. Biophys J 2001, 81:313-320.
15. Trombetta G, Di Bona C, Grazi E: The transition of polymers into a network of polymers alters per se the water
activity. Int J Biol Macromol 2005, 35:15-18.
16. Piazzesi G, Lucii L, Lombardi V: The size and the speed of the working stroke of muscle myosin and its
dependence on the force. J of Physiol (London) 2002, 545(1):145-151.
17. Chaen S, Shirikawa L, Bagshaw CR, Sugi H: Measurement of ATP turnover during shortening and lengthening of
rabbit psoas myofibrils using a fluorescent ATP analog. Adv Exp Med Biol 1998, 453:569-76.
18. Sugi H, Iwamoto H, Akimoto T, Ushitani H: Load-dependent mechanical efficiency of individual myosin heads in
skeletal muscle fibers activated by laser flash photolysis of caged calcium in the presence of a limited amount of
ATP. Adv Exp Med Biol 1998, 453:557-66.
19. Sugi H, Iwamoto H, Akimoto T, Ushitani H: Evidence for the load-dependent mechanical efficiency of individual
myosin heads in skeletal muscle fibers activated by laser flash photolysis of caged calcium in the presence of a
limited amount of ATP. Proc Natl Acad Sci USA 1998, 95:2273-8.
20. Roberts TJ, Marsh RL: Probing the limits to muscle-powered accelerations: lessons from jumping bullfrogs. J Exp
Biol 2003, 206:2567-2580.
21. Partridge LD: Intrinsic feedback factors producing inertial compensation in muscle. Biophys J 1967, 7:853-863.
22. Schilling BK, Falvo MJ, Chiu LZF: Force-velocity, impulse-momentum relationships: Implications for efficacy of
purposefully slow resistance training. J Sports Sci Med 2008, 7:299-304.
doi: 10.1186/1742-4682-7-24
Cite this article as: Grazi and Pozzati, Skeletal muscle contraction. The thorough definition of the contractile event
requires both load acceleration and load mass to be known Theoretical Biology and Medical Modelling 2010, 7:24
Received: 12 March 2010 Accepted: 18 June 2010
Published: 18 June 2010
This article is available from: 2010 Grazi and Pozzati; licensee BioMed Central Ltd. This is an Open Access article distributed under the terms of the Creative Commons Attribution L icense ( which permits unrestricted use, distribution, and reproduction in any medium, provided the original work is properly cited.Theoretical Biology and Medical Modelling 2010, 7:24