Báo cáo y học: "A plague on five of your houses – statistical reassessment of three pneumonic plague outbreaks that occurred in Suffolk, England, between 1906 and 1918" pdf
Bạn đang xem bản rút gọn của tài liệu. Xem và tải ngay bản đầy đủ của tài liệu tại đây (408.04 KB, 10 trang )
RESEA R C H Open Access
A plague on five of your houses – statistical re-
assessment of three pneumonic plague outbreaks
that occurred in Suffolk, England, between 1906
and 1918
Joseph R Egan
Correspondence: joseph.egan@hpa.
org.uk
Microbial Risk Assessment,
Emergency Response Department,
Health Protection Agency, Porton
Down, Salisbury, Wiltshire, SP4 0JG,
UK
Abstract
Background: Plague is a re-emerging disease and its pneumonic form is a high
priority bio-terrorist threat. Epidemiologists have previously analysed historical
outbreaks of pneumonic plague to better understand the dynamics of infection,
transmission and control. This study examines 3 relatively unknown outbreaks of
pneumonic plague that occurred in Suffolk, England, during the first 2 decades of
the twentieth century.
Methods: The Kolmogorov-Smirnov statistical test is used to compare the
symptomatic period and the length of time between successive cases (i.e. the serial
interval) with previously reported values. Consideration is also given to the case
fatality ratio, the average number of secondary cases resulting from each primary
case in the observed minor outbreaks (termed R
minor
), and the prop ortion of
individuals living within an affected household that succumb to pneumonic plague
via the index case (i.e. the household secondary attack rate (SAR)).
Results: 2 of the 14 cases survived giving a case fatality ratio of 86% (95%
confidence interval (CI) = {57%, 98%}). For the 12 fatal cases, the average
symptomatic period was 3.3 days (standard deviation (SD) = 1.2 days) and, for the 11
non index cases, the average serial interval was 5.8 days (SD = 2.0 days). R
minor
was
calculated to be 0.9 (SD = 1.0) and, in 2 households, the SAR was approximately 14%
(95% CI = {0%, 58%}) and 20% (95% CI = {1%, 72%}), respectively.
Conclusions: The symptomatic period was approximately 1 day longer on average
than in an earlier study but the serial interval was in close agreement with 2
previously reported values. 2 of the 3 outbreaks ended without explicit public heal th
interventions; however, non-professional caregivers were particularly vulnerable - an
important public health consideration for any future outbreak of pneumonic plague.
Background
Pneumonic plague is a disease that poses a th reat to both civilian and military popula-
tions either via a biological aerosolised release or through zoonotic transmission [1].
Such routes of infection are not mutually exclusive since a biological attack in a non-
endemic plague region could lead to reservoirs of plague-inf ected animals after the
initial human infections have been controlled [2]. In addition, military populations are
Egan Theoretical Biology and Medical Modelling 2010, 7:39
/>© 2010 Egan; licensee BioMed Centr al Ltd. This is an Open Access article distributed under the terms of the Creative Commons
Attribution License ( whi ch pe rmits unrestricted use, distribution, and reprodu ction in
any medium, provided the original work is prope rly cited.
at risk when operating in plague endemic regions and the possibility of import ation of
plague from abroad also provides a continuing threat to public health in the U.K., and
elsewhere [3]. It is therefore impor tant to understand the epidemiology of pneum onic
plague in order to mitigate any outbreaks of the disease. The Japanese are believed to
have dropped plague-infected fleas over China during World War 2 [4] but due to a
lack of detailed descriptions of biological attacks, researchers have previously analysed
natural outbreaks to gain a better understanding of disease features such as the incuba-
tion/infectious periods and the potential for human-to-human transmission [3,5,6].
Prior to a single laboratory-acquired case of pneumonic plague at Porton Down in
1962, [7] the most recent English outbreaks occurred between 1906 and 1918 in Suf-
folk [8,9]. 3 outbreaks of pneumonic plague and 2 outbreaks of bubonic plague were
believed to h ave resulted from shipping on the Rivers Orwell and Sto ur. The most
likely explanation for these outbreaks is that grain brought from ports in the Black Sea
and the Americas contained plague-infected rats which lead to enz ootic rat-flea plague
cycles. All of these outbreaks are particularly well documented and have been
described as “unique to western Europe” [8]. Although they have been reported in pre-
vious papers, this study uniquely analyses the statistical epidemiology of the 3 pneumo-
nic plague outbreaks. Unlike recent analyses, [10-12] the natural history and
transmissibility of the S uffolk cases were unaffected by effective treatment since anti-
biotics were not available until ~30 years after the last Suffolk outbreak.
Methods
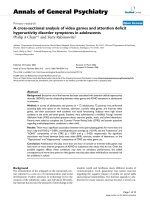
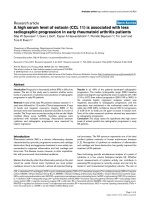
Table 1 provides data describing the 3 pneumonic plague outbreaks [9,13] and Figure 1
shows a graphical representation of the data using epidemic trees [10]. A brief explana-
tion of each outbreak is given below.
Shotley outbreak, 1906/07
The index case, Mrs C (case 1), who lived in Charity Farm Cottages, developed what is
believed to be pneumonic plague on 9
th
December 1906 and died 3 days later. She was
nursed by her daughter, Mrs R (case 2), who s ubsequently developed the disease on
17
th
December and died on the 19
th
Dece mber. Given the close contact of the 2 cases
it seems very likely that Mrs R was infected by her m other. Also, since evidence sug-
gests that transmission takes place when cases are coughing bloody sputum and near
death [14] then the approximate 5 day incubation period agrees with previously
reported values [3,15]. Interestingly, another daughter, Miss C (case 3) also became ill
on 20
th
December but finally recovered. Miss C nursed both her mother and her sister;
it was assumed that Miss C was infected by her sister given that the time-course of
disease suggests she was less likely to have been infected by her mother.
The 2 daughters were both nursed by Mrs G (case 4) who lived approximately half a
mile away at Brickhill Terrace Cottages. Mrs G became ill on Christmas Eve and died
on Boxing Day; it was assumed that Mrs G was infected by Mrs R, the more seriously
ill of the 2 daughters. Mrs G seems to have infected her husband (case 6) and 2 sons
(cases 5 and 7) who all became symptomatic in quick succession between 27
th
and
30
th
December. The first son that experienced symptoms recovered. Mrs G’smother,
Mrs W (case 8), travelled over 20 miles to attend her daughter’ sfuneralandthen
remained at Brickhill Terrace Cottages to nurse her son-in-law and 2 grandsons. Mrs
Egan Theoretical Biology and Medical Modelling 2010, 7:39
/>Page 2 of 10
W became ill on 3
rd
January 1907 and died 3 days later; it was assumed that infection
occurred via Mrs W’sson-in-law,MrG,sincehewastheonlycasetohavedied(and
thus experienced the late infectious s tage) after Mrs W had arrived but prior to her
onset of symptoms.
Freston outbreak, 1910
Mrs C lived in Latimer Cottages with her husband, Mr C, and her 4 children from a
previous marriage. On 12
th
September 1910, Mrs C’s daughter, Miss G (case 9), suf-
fered a bout of vomiting and died 4 days later after having experienced a severe cough
and diarrhoea. 5 days after the death of her daughter, Mrs C (case 10) began to experi-
ence similar symptoms and died after 2 days illness. 3 days after his wife’s death, Mr C
(case 11) and Mrs P (case 12), a neighbour living at Turkey Farm Cottages who had
nursed Mrs C, also b ecame ill. The following day local doctors isolated both cases in
Table 1 Outbreak data
Case
Number
Name Age Date of
symptom
onset
Date of
death
Location Symptomatic
period (days)
Serial
interval
(days)
Number of
secondary
cases
Shotley, 1906/07
1 Mrs C 53 9
th
Dec. 12
th
Dec. Charity Farm
Cottages
3 Index case 1
2 Mrs R 24 17
th
Dec. 19
th
Dec. Charity Farm
Cottages
282
3 Miss
E. C
19 20
th
Dec. Recovered Charity Farm
Cottages
Recovered 3 0
4 Mrs G 46 24
th
Dec. 26
th
Dec. Brickhill
Terrace
Cottages
273
5MrH.
G
?27
th
Dec. Recovered Brickhill
Terrace
Cottages
Recovered 3 0
6 Mr G 56 28
th
Dec. 2
nd
Jan. Brickhill
Terrace
Cottages
541
7MrR.
G
730
th
Dec. 4
th
Jan. Brickhill
Terrace
Cottages
560
8 Mrs
W
66 3
rd
Jan. 6
th
Jan. Brickhill
Terrace
Cottages
360
Freston, 1910
9 Miss
A. G
912
th
Sept. 16
th
Sept. Latimer
Cottages
4 Index case 1
10 Mrs C 40 21
st
Sept. 23
rd
Sept. Latimer
Cottages
292
11 Mr C 57 26
th
Sept. 29
th
Sept. Latimer
Cottages
3 5 Isolated
12 Mrs P 43 26
th
Sept. 29
th
Sept. Turkey Farm
Cottages
3 5 Isolated
Erwarton, 1918
13 Mrs B 52 8
th
June 13
th
June Warren Lane
Cottages
5 Index case 1
14 Mrs G 42 16
th
June 19
th
June Warren Lane
Cottages
380
Columns 2 - 6 copyright The Trustee, The Well come Trust, reproduced with permission; originally published in [9].
Egan Theoretical Biology and Medical Modelling 2010, 7:39
/>Page 3 of 10
their homes in view of the infectious nature of the illness; other family members were
requested to sleep in outhouses temporarily [16]. Mr C and Mrs P died on 29
th
Sep-
tember; the same day that bacilli grown from blood specimens taken from these third
generation cases were identified as Yersinia pestis (the causative agent of plague). Sub-
sequently contacts of all cases were moved into isolation accommodation on 1
st
Octo-
ber. The r outes of transmission in t his outbreak were relatively straight-forward to
deduce; the only debatable link is whether Mr C was infected via his step-daughter or
his wife. However, based on previous analysis [3,15] it is far more likely that Mr C
experienced an approximate 3 day incubation period having been infected by his wife
than incubating the disease for approximately 10 days after contact with the in dex
case.
Erwarton outbreak, 1918
Mrs B (case 13), who lived in Warren Lane Cottages, developed pneumonic plague
symptoms on 8
th
June 1918 and died 5 days later. Mrs B was visited by her next-door
neighbour, Mrs G (case 14), who became ill on 16
th
June. 2 days later the local general
practitioner, Dr Carey (who had attended all cases in the Shotley and Freston out-
breaks) visited Mrs G and suspected pneumonic plague after he found her with a high
temperature, spitting blood and breathing rapidly. Mrs G died the following day at
approximately the same time that pneumonic plague was bacteriologically confirmed
by a second doctor. Once again, the contacts of the 2 cases were subsequently moved
Figure 1 Epidemic trees of the 3 pneumonic pl ague outbreaks. The vertical grey lines separate the
numbered days of each outbreak. Circles and squares represent female and male cases, respectively. White
and black symbols represent time of symptom onset and death, respectively. Grey symbols represent time
of symptom onset for those cases that recovered. Case numbers are given above time of symptom onset
symbols. Dashed connectors represent the symptomatic period and un-dashed connectors represent
routes of transmission. Boxes represent different locations and dividing long-dashed lines represent
different cottages. C, B, L, T and W represent Charity Farm Cottages, Brickhill Terrace Cottages, Latimer
Cottages, Turkey Farm Cottages and Warren Lane Cottages, respectively.
Egan Theoretical Biology and Medical Modelling 2010, 7:39
/>Page 4 of 10
into isolated accommodation; in addition, all of the cases’ clothing and bedclothes were
burnt.
Results
The followin g analysis aggregates data from the 3 pneumonic plague outbreaks due to
their small sample sizes.
Symptomatic period
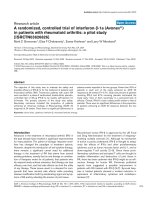
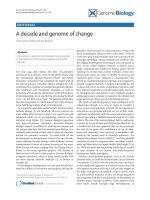
Figure 2a shows the Kaplan-Meier survival function following symptom onset. All
cases that died experienced at least 2 days of symptoms and survived for no longer
than 3 further days. 2 of the 14 cases survived the disease giving a case fatality ratio of
86% with a 95% binomial confidence interval of {57%, 98%}. Figure 2b shows a histo-
gram of the sympto matic period for the 12 fatal cases giving a mean and standard
deviation (SD) of 3.3 and 1.2 days, respectively. A Kolmogorov-Smirnov (KS) test
showed evidence against the sample data here being drawn from the log-normal distri-
bution as reported by Gani & Leach [3] who calculated a mean and SD of 2.5 and 1.2
days, respectively (p-value = 0.02).
Time from symptom onset
Proportion surviving
0123456
0.0
0.2
0.4
0.6
0.8
1.0
a
Time from symptom onset to death
Counts
0123456
0
1
2
3
4
5
6
b
Serial interval
Counts
0246810
0
1
2
3
c
Number of secondary cases
per primary case
Counts
01234
0
1
2
3
4
5
6
d
Figure 2 (a) Kaplan-Meier survival curve; dashed horizontal line repre sents 1-case fatality ratio, (b)
histogram of the symptomatic periods of fatal cases (n = 12), (c) histogram of the time between
successive cases (n = 11), (d) histogram of transmission (n = 12).
Egan Theoretical Biology and Medical Modelling 2010, 7:39
/>Page 5 of 10
Serial interval
The serial interval (symptom onset time in a primary case to symptom onset time in a
secondary case) could only be calculated for 11 of the 14 cases since the remaining 3
were index cases whose source of infection was not explicitly identified. The estimated
serial intervals ranged from 3 to 9 days with a mean and SD of 5.8 and 2.0 days,
respectively (Figure 2c). Nishiura et al. have previously reported 2 independent serial
interval distributions; the first giving a mean and SD of 5.7 a nd 3.6 days, respectively,
[5] and the second giving equivalent parameters of 5.1 and 2.3 days [6]. A KS test
revealed no evidence against the sample data here being drawn from either gamma dis-
tribution (first distribution p-value = 0.38, second distribution p-value = 0.22).
Secondary cases
Figure 2d shows a histogram of the number of secondary cases per primary case in the
observed minor outbreaks prior to the implementation of any control measures giving
a mean (termed R
minor
) of 0.9 (SD = 1.0), slightly lower than the R
minor
of 1.3 (SD =
1.8) reported by Gani & Le ach [3]. A visual inspection of the histogram shows a simi-
lar shape to the geometric distribution provided by Gani & Leach and confirmed by
Lloyd-Sm ith et al., [17] but the KS test is only val id for testing against continuous dis-
tributions and therefore cannot be applied here. Despite this, the geometric distribu-
tion was again superior (Akaike’s Information Criterion with a correction for small
sample sizes (AIC
c
) = 29.5) to either the Poisson (AIC
c
= 32.7) or negative-binomial
(AIC
c
= 35.6) models. The results here also compare favourably with the R
minor
values
of 0.9 for Mukden in 1946 and 1.1 for Madagascar in 1957 [3]. Finally, there was insuf-
ficient data to provide any statistical compar ison with the time-decreasing R
minor
ana-
lysed by Nishiura et al., [6] although it is noteworthy that all 3 index cases here
infected only 1 other person.
Secondary attack rate
Let the house hold secondar y attack rate (SAR) be defined as the number of secondary
cases resulting from each household index case divided by the number of household
contacts of each index case. The family living in Charity Farm Cottages, Shotley, con-
sisted of about 8 persons [13] giving a household SAR of 14% with a 95% binomial
confidence interval of {0%, 58%}. 3 children remained disease-free at Latimer Cottages,
Freston, giving a household SAR of 20% with a 95% binomial confidence interval of
{1%, 72% }. The early isolation of Mrs P prevented any further cases amongst her hus-
band or their 6 children [13] making the household SAR un tenable for Turkey Farm
Cottages, Freston. It should be noted that 4 doctors, 3 nurses and 2 church members
also had close contact with the Freston cases but none of them develo ped the disease
[13,18]. The lack of information regarding the number of inhabitants at either Brickhill
Terrace Cottages, Shotley, or Warren Lane Cottages, Erwarton, means that the house-
hold SAR cannot be calculated for either residence.
Discussion
There seems to be sufficient evidence in the Erwarton outbreak to suggest that public
health interventions were implemented too late to prevent any further cases because
contacts were isolated at approximately the time of the second death (i.e. after any
Egan Theoretical Biology and Medical Modelling 2010, 7:39
/>Page 6 of 10
additional transmission would have occurred). The situation is slightly less clear in
Shotley where pneumonic plague was only accepted as the disease responsible many
years later - all deaths were registered as being due to acute pneumonia and any expli-
cit isolation was not reported. It is important to note that Dr Carey, who attended
cases in all 3 outbreaks, undoubtedly encouraged barriers to close contact which may
have implicitly affected the epidemiology of each outbreak. In spite of this, Mr C and
Mrs P were still in fected by Mrs C duri ng the Freston outbreak even though Dr Carey
had impressed on those nursing Mrs C of the necessity of avoiding close contact
whenever possible [19]. This highlights the difficulty of quantifying such medical advice
from outbreak dat a - a subject perhaps mor e appropriately addressed through beha-
vioural research studies [20].
2 of the 3 Suffolk outbreaks were what are usually referred to as ‘ minor outbreaks’
which by definition decline to extinction with or without the strong influence of public
health interventions. By analysing the entire transmission tree of a minor outbreak it is
natural that one calculates an R
minor
estimate slightly smaller than 1; this consequence
is clear even without any explicit estimation. Nevertheless, it is not appropr iate to
regard that the average number of secondary cases per primary case in a fully suscepti-
ble population (i.e. R
0
) of pneumonic plague is less than 1 in general and that pneumo-
nic plague is not capable of c ausing a major epidemic. For example , when evaluating
the major epidemic in Manchuria, 1910, [5] which wa s clearly dominated by human-
to-human transmission (due to confirmation of the absence of b ubo amongst the
cases), R
0
of pneumonic plague is definitely regarded as greater than 1. What the pre-
sent study and previous studie s [3,6,17] have tended to analyse are examples in which
the outbreak declined to extinction before growing to a major epidemic, and thus, the
resulting estimate of the average number of secondary cases per single primary case is
not a true representation of R
0
.Thisisapparentfrombranchingprocesstheorygiven
that an observation of a single epidemic is merely “asinglesamplepathprofile” [21].
Furthermore, the underlying social contact structure that predicates R
0
is unclear i n
many settings and so interpretation of transmissibility inferences between settings
requires care.
The case fatality ratio of pneumonic plague is often stated as approa ching 100% and
so it is interesting that 14% of the Suffolk cases survived, although the small sample
size leads to wide confidence intervals. Of the 14 possible cases of pneumonic plague
only 3 were confirmed bacteriologically (Mr C and Mrs P at F reston, and Mrs G at
Erwarton). There can be little doubt that the other 2 cases at Latimer Cottages and
MrsBatWarrenLaneCottagesalsohadthedisease [9]. However, it is possible that
the 2 surviving cases in Shotley did not experience pneumonic plague; indeed, all the
cases were originally believed to have beenduetoavirulentformofinfluenza[13].
On the other hand, perhaps the strain of Y. pestis responsible for the Suffolk outbreaks
was less virulent than in other outbreaks resulting in a less than 100% case fatality
ratio. It is also possible that the 2 surviving Shotley cases could have initially suffered
from bubonic plague before displaying pneumonic symptoms, although no buboes
were reported. Interestingly, the presumed bubonic plague outbreak of 1909/1910 in
the nearby village of Trimley resulted in 7 cases and 4 deaths - 6 of these cases were
described as having a “knot” (enlarged gland) in the neck, axilla or groin [8].
Egan Theoretical Biology and Medical Modelling 2010, 7:39
/>Page 7 of 10
The plague outbreaks that occurred in Suffolk during the early twentieth century did
not behave like the ‘black death’ pandemic of the 14
th
-17
th
centuries ( which killed a
quarter of t he population o f Europe) but more like sylvatic plague [9,22]. Enzootic
amongst wild rodents in many areas of the world, sylvatic plague (a term that is used
to reflect the ecological rather than the medical context of the disease) rarely results in
the infection of more than a few individuals or single households. Interestingly, t he
index cases of all 3 outbreaks here seem to have followed a direct course of primary
pneumonic plague (which has also been associated with sylvatic plague [23]) rather
than experiencing the usual secondary effects after suf fering bubonic symptoms. It
should be noted that there was 1 further case that experienced secondary pneumonic
plague - on 10
th
October 1911, a sailor, Mr B, was admitted to the sick quarters of the
Royal Naval Barracks at Shotley. Mr B was probably infected 3 days earlier after he cut
himself while cleaning a rabb it that he had caught less than a mil e from Lati mer Cot-
tages, Freston. Soon after d eveloping a severe pneumonia on 15
th
October, Mr B was
isolated after inspection of his sputum suggested plague. No transmission occurred
and Mr B finally recovered on 12
th
January 1912.
The last pandemic of plague started in Ch ina, 1894, and spread to many parts of the
world including India where over 1 million people were killed by the disease [9].
Plague reached Glasgow in 1900 [24] resulting in 36 bubonic cases and 16 deaths.
Prior to t his outbreak, Britain remained effectively free from plague for nearly
250 years following the great plague of London (1665-1666) that caused 60,000 deaths
in a p opulation of 450,000. The absence of plague was probably due to the introduc-
tion of the brown rat (Rattus norvegicus ) which eventually replaced the common black
rat (Rattus rattus) [8]. Since the brown rat p refers to live apart from man, as opposed
to the black rat which prefers human habitations, the close contact required for flea-
based transmission is likely to have decreased over time. However, over 200 species of
wild rodents are capable of harbouring plague [8] and could act as a reservoir for
potential human infection following an aerosolised release of Y. pestis.Indeed,the
small localise d outbreaks seen in Suffolk could provide a model of potential secondary
outbreaks of plague after any ini tial epidemic has been curtailed, with domesticated
cats perhaps providing the mo st direct rodent-human link in contemporary western
society [25,22].
Conclusions
The average s ymptomat ic period o f the cases described here was almost 1 day longer
than that found by Gani & Leach [3] in their analysis of a variety of outbreaks,
although the 2-5 day range fell within previously report ed values. The main differ ence
between the results of these 2 papers is that none of the cases here died within the
first day of experiencing symptoms whereas approximately 15% of cases suffered a
1 day infectious period in the Gani & Leach study. The smaller sample size of the Suf-
folk outbreaks perhaps offers the most likely explanation for this discrepancy; although
possible epidemiological differences cannot be ruled out. The average ~6 day serial
interval agrees closely with values reported by Nishiura et al. [5,6] and in 2 situations
where it was possible to estimate, the household SAR was approximately 15%, but
again the small sample sizes lead to wide confidence intervals. These outbreaks high-
lightthatnon-professionalcaregivers are particularly vulnerable and would likely
Egan Theoretical Biology and Medical Modelling 2010, 7:39
/>Page 8 of 10
comprise th e majority or non-index pneum onic plague cases following importation of
the disease or deliberate release of the causative organisms. Finally, it should be
emphasised that even with R
minor
= 0.9, significant amplification of any index cases
could ensue through human-to-human transmission [3] and would need to be consid-
ered appropriately in terms of risk assessment and public health mitigation strategies.
List of Abbreviations
AIC: Akaike’s Information Criterion; KS: Kolmogorov Smirnov; SAR: Secondary Attack Rate; SD: Standard Deviation.
Acknowledgements
Thanks to Emma Bennett, Andrew Williams, Ian Hall and Steve Leach for helpful suggestions and comments. Thanks
also to Lois Roberts, Caroline Ridler and Sue Goddard for their obliging library services and to Steve Harvey at the
Ipswich Record Office. This work was supported by the Department of Health for England (Health Protection Agency
grant numbers 104307, 104308); and the Defence Science and Technology Laboratory (contract number EA901976).
The views and opinions expressed in this paper are those of the author and do not necessarily reflect those of the
sponsoring institutions.
Authors’ contributions
JE analysed the data and wrote the paper.
Author Information
JE is a Mathematical Modeller for the Health Protection Agency. His interests include the development of
mathematical models to assess and predict the potential public health impacts of newly emerging infectious diseases
and the likely relative benefits of different mitigation strategies.
Competing interests
The author declares that he has no competing interests.
Received: 5 August 2010 Accepted: 25 October 2010 Published: 25 October 2010
References
1. Rabinowitz P, Gordon Z, Chudnov D, Wilcox M, Odofin L, Liu A, Dein J: Animals as Sentinels of Bioterrorism Agents.
Emerging Infectious Diseases 2006, 12:647-652.
2. Levison ME: Lessons learned from history on mode of transmission for control of pneumonic plague. Current
Infectious Disease Reports 2000, 2:269-271.
3. Gani R, Leach S: Epidemiologic Determinants for Modelling Pneumonic Plague Outbreaks. Emerging Infectious
Diseases 2004, 10:608-614.
4. Inglesby TV, Dennis DT, Henderson DA, Bartlett JG, Ascher MS, Eitzen E, Fine AD, Hauer J, Koerner JF, Layton M,
McDade J, Osterholm MT, O’Toole T, Parker G, Perl TM, Russell PK, Schch-Spana M, Tonat K: Plague as a Biological
Weapon: Medical and Public Health Management. Journal of the American Medical Association 2000, 283:2281-2290.
5. Nishiura H: Epidemiology of a primary pneumonic plague in Kantoshu, Manchuria, from 1910 to 1911: statistical
analysis of individual records collected by the Japanese Empire. International Journal of Epidemiology 2006,
35:1059-1065.
6. Nishiura H, Schwehm M, Kakehashi M, Eichner M: Transmission potential of primary pneumonic plague: time
inhomogeneous evaluation based on historical documents of the transmission network. Journal of Epidemiology
and Community Health 2006, 60:640-645.
7. Hammond PM, Carter GB: From Biological Warfare to Healthcare: Porton Down, 1940-2000 Basingstoke, U.K.: Palgrave;
2002.
8. Black J, Black D: Plague in East Suffolk 1906-1918. J R Soc Med 2000, 93(10):540-543.
9. Van Zwanenberg D: The last epidemic of plague in England? Suffolk 1906-1918. Medical History 1970, 14:63-74.
10. Ratsitorahina M, Chanteau S, Rahalison L, Ratsifasoamanana L, Boisier P: Epidemiological and diagnostic aspects of the
outbreak of pneumonic plague in Madagascar. The Lancet 2000, 355:111-113.
11. Begier EM, Asiki G, Anywaine Z, Yockey B, Schriefer ME, Aleti P, Ogen-Odoi A, Staple JE, Sexton C, Bearden SW, Kool JL:
Pneumonic Plague Cluster, Uganda, 2004. Emerging Infectious Diseases 2006, 12:460-467.
12. Gupta M, Sharma A: Pneumonic plague, northern India, 2002. Emerging Infectious Diseases 2007, 13:664-666.
13. Bulstrode HT: Report to the Local Government Board upon the occurrence in the autumn of 1910 of four deaths
at Freston near Ipswich, from a rapidly fatal and infectious malady diagnosed as pneumonic plague, and upon
the prevalence of plague in rodents in Suffolk and Essex. Together with a report upon two localised outbreaks of
disease in East Suffolk in 1909-10 and 1906-7 which may have been instances of bubonic and pneumonic plague
respectively. Bulletin of the Society of Exotic Pathogens 1927, 20.
14. Kool JL: Risk of Person-to-Person Transmission of Pneumonic Plague. Clin Infect Dis 2005, 40:1166-1172.
15. Nishiura H: Backcalculation of the disease-age specific frequency of secondary transmission of primary pneumonic
plague. Asian Pacific Journal of Tropical Medicine 2008, 1:25-29.
16. Strange disease near Ipswich.
East Anglian Daily Times 1910.
17. Lloyd-Smith J, Schreiber S, Kopp P, Getz W: Superspreading and the effect of individual variation on disease
emergence. Nature 2005, 438:355-359.
18. Pringle A: The outbreak of rat plague in Suffolk. Public Health 1911, 24:126-131.
19. Plague cases in Suffolk. Daily Mail 1910.
Egan Theoretical Biology and Medical Modelling 2010, 7:39
/>Page 9 of 10
20. Rubin GJ, Amlot R, Rogers MB, Hall I, Leach S, Simpson J, Wessely S: Perceptions and reactions with regard to
pneumonic plague. Emerging Infectious Diseases 2010, 16:120-122.
21. Farrington CP, Kanaan MN, Gay NJ: Branching process models for surveillance of infectious diseases controlled by
mass vaccination. Biostatistics 2003, 4:279-295.
22. Stenseth N, Atshabar B, Begon M, Belmain S, Bertherat E, Carniel E: Plague: Past, Present, and Future. PLoS Med 2008,
5.
23. Hirst L: The study of plague: A conquest of the evolution of epidemiology Oxford, U.K.: Oxford Clarendon Press; 1953.
24. Plague in Glasgow. British Medical Journal 2000, 321:281.
25. Gage K, Dennis D, Orloski K, Ettestad P, Brown T, Reynolds P, Paper W, Fritz C, Carter L, Stein J: Cases of Cat-Associated
Human Plague in the Western US, 1977-1998. Clinical Infectious Diseases 2000, 30:893-900.
doi:10.1186/1742-4682-7-39
Cite this article as: Egan: A plague on five of your houses – statistical re-assessment of three pneumonic plague
outbreaks that occurred in Suffolk, England, between 1906 and 1918. Theoretical Biology and Medical Modelling
2010 7:39.
Submit your next manuscript to BioMed Central
and take full advantage of:
• Convenient online submission
• Thorough peer review
• No space constraints or color figure charges
• Immediate publication on acceptance
• Inclusion in PubMed, CAS, Scopus and Google Scholar
• Research which is freely available for redistribution
Submit your manuscript at
www.biomedcentral.com/submit
Egan Theoretical Biology and Medical Modelling 2010, 7:39
/>Page 10 of 10