Báo cáo y học: "Using an agent-based model to analyze the dynamic communication network of the immune response" docx
Bạn đang xem bản rút gọn của tài liệu. Xem và tải ngay bản đầy đủ của tài liệu tại đây (2.36 MB, 25 trang )
SOFTWA R E Open Access
Using an agent-based model to analyze the
dynamic communication network of the
immune response
Virginia A Folcik
1,3*
, Gordon Broderick
2
, Shunmugam Mohan
1
, Brian Block
1,3
, Chirantan Ekbote
1,3
, John Doolittle
1,3
,
Marc Khoury
1,3
, Luke Davis
1
, Clay B Marsh
4,1
* Correspondence:
1
Department of Internal Medicine,
Division of Pulmonary, Allergy,
Critical Care and Sleep Medicine,
The Ohio State University Medical
Center, Davis Heart and Lung
Research Institute, Columbus, OH,
USA
Abstract
Background: The immune system behaves like a complex, dynamic network with
interacting elements including leukocytes, cytokines, and chemokines. While the
immune system is broadly distributed, leukocytes must communicate effectively to
respond to a pathological challenge. The Basic Immune Simulator 2010 contains
agents representing leukocytes and tissue cells, signals representing cytokines,
chemokines, and pathogens, and virtual spaces representing organ tissue, lymphoid
tissue, and blood. Agents interact dynamically in the compartments in response to
infection of the virtual tissue. Agent behavior is imposed by logical rules derived
from the scientific literature. The model captured the agent-to-agent contact history,
and from this the network topology and the interactions resulting in successful
versus failed viral clearance were identified. This model served to integrate existing
knowledge and allowed us to examine the immune response from a novel
perspective directed at exploiting complex dynamics, ultimately for the design of
therapeutic interventions.
Results: Analyzing the evolution of agent-agent interactions at incremental time
points from identical initial conditions revealed novel features of immune
communication associated with successful and failed outcomes. There were fewer
contacts between agents for simulations ending in viral elimination (win) versus
persistent infection (loss), due to the removal of infected agents. However, early
cellular interactions preceded successful clearance of infection. Specifically, more
Dendritic Agent interactions with TCell and BCell Agents, and more BCell Agent
interactions with TCell Agents early in the simulation were associated with the
immune win outcome. The Dendritic Agents greatly influenced the outcome,
confirming them as hub agents of the immune network. In addition, unexpectedly
high frequencies of Dendritic Agent-self interactions occurred in the lymphoid
compartment late in the loss outcomes.
Conclusions: An agent-based model capturing several key aspects of complex
system dynamics was used to study the emergent properties of the immune
response to viral infection. Specific patterns of interactions between leukocyte agents
occurring early in the response significantly improved outcome. More interactions at
later stages correlated with persistent inflammation and infection. These simulation
experiments highlight the importance of commonly overlooked aspects of the
immune response and provide insight into these processes at a resolution level
exceeding the capabilities of current laboratory technologies.
Folcik et al . Theoretical Biology and Medical Modelling 2011, 8:1
/>© 2011 Folcik et al; licensee BioMed Central Ltd. This is an Open Access article distributed under the terms of the Creative Commons
Attribution License (http://creative commons.org/licenses/by/2.0), which permits unrestricted use, distribution, and reproduction in
any medium, provided the original work is properly cited.
Background
The immune system is a dynamic network of interacting cells that communicate
directly and indirectly to exchange information during an immune response. Orosz
gave this complex phenomenon the name “ Immuno-ecology” [1], and described in
detail the properties of the immune network, likening the immune response to swarm-
ing ants. The network qualities exhibited by the immune system allow such a geogra-
phically dispersed glandular system to effectively mainta in homeostasis and yet swiftly
react in a de novo, swarm-like manner when responding to a pathogen. Immune cell
activity is controlled by cell-cell interaction and by environmenta l signals that these
and other cells produce. These signals constitute broadcast signals if they enter the
blood. In contrast, cell-to-cell interactions constitute direct communication. The com-
bination of indirect and direct communication with connections changing over time
gives the immune system its network topology. The immuno-ecology view of the
immune network identifies immune cells as nodes and cytokines and chemokines as
edges or links between the nodes. This network topology evolves over time as cells
interact, change state and eventually die. An immune response most effectively pro-
tects the body when the leukocyt es rapidly eliminate pathogens and then naturally
diminish in numbers (via apoptosis), avoiding damaging chronic inflammation [2-5].
In real world networks such as the world-wide web [6] and the biochemistry of living
organisms [7], some nodes play a more central role than others. This network topology
is called “scale-free”, and is characterized b y many nodes having very few links and a
few “ hub” nodes having many links [6]. In these cases the distribution of connections
among the network nodes follows a “power-law”. This hu b-centric architectural design
provides a high level of resilience to random loss of connections, yet makes these net-
works susceptible to attacks directed specifically at t he hubs [8]. This scale-free topol-
ogy was demonstrated in simulation experiments conducted with the Basic Immune
Simulator (BIS) and has been reported previously [9].
Others have also studied the network properties of the immune system [10-12] using
a growing body of biochemically validated information describing cellular signaling
pathways. Fuite, Vernon and Broderick [13] extended this elemental approach by iden-
tifying signaling networks using data from high-throughput molecular assays used to
survey immune and neuroendocrine status. They applied novel topological analyses to
identify network features that distinguished patients with chronic fatigue syndrome
(CFS)fromnon-fatiguedsubjects.Inacomplex illness like CFS, the identification of
individual b iomarkers in human data is especially difficult because of the natural het-
erogeneity in the magnitude of cytokines and hormones normally produced [1]. Impor-
tantly, analyzing co-expression networks improved resolution and added a new
dimension to molecular phenotyping [13]. Moreover, novel therapeutic strategies could
prevent or enhance indirect and direct interactions between immune cells that are
causing pathological inflammation or undesired immunosuppression [1].
In these examples, the immune networks were constructed with nodes representing
immune cell types and the links between the nodes represented soluble mediators such
as cytokines, chemokines, or hormones. Cell-cell signals mediated by direct contact
were implicitly represented. In some cases, mediators of indirect communication or
stigmergy [14,15] were represented explicitly as nodes. Though revealing, these are
Folcik et al . Theoretical Biology and Medical Modelling 2011, 8:1
/>Page 2 of 25
typical ly static representations of network intera ctions and descri be an average state of
network assembly. The dynamic, spontaneous assembly and disassembly of network
components that occurs over time were not described.
This study uses an agent-based model to explore the dynamics of immune network
connectivity in cellular communication by direct cell-cell contact. In the static repre-
sentation of the network model, discrete agents representing individual immune cells
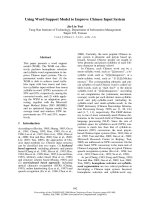
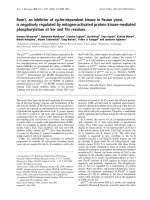
define the nodes (Figure 1). Connections between any two node s involve direct physi-
cal contact leading to informa tion exchange between individual immune cell agents.
The agents and signals representing the various cell types and cytokines are described
in addit ional file 1. A key advantage of using an agent-bas ed model like the BIS_2010
(the current version of the BIS) is that it integrates experimental results from a wide
range of studies, compiling them into a detailed set of known and validated interaction
rules (additional file 2; [16]), and using the knowledge base in a way that allows obser-
vation and analysis of virtual cellula r behavior. This agent-based approach allows a
dynamic analysis of leukocyte interactions during an immune response to challenge.
Though fluorescent leukocyt e tagging in vivo continues to advance as a technology for
studying cellular interaction, it is not possible to conduct analyses of immune
dynamics experimentally at this level of detail and brea dth, making simulation experi-
ments highly useful.
Using this model-based approach, we identified patterns of temporally distinct net-
work interactions that emerged from the contacts between individual agents during
inflammation that led to d ifferent immunological win and loss outcomes [16]. By
Figure 1 The BIS_2010 agents representing nodes in a static repre sentation of the immune
network. Each node in the immune network represents a category of immune cells that includes
subtypes. Solid lines indicate two-way connections that involve a change in information recorded by both
nodes upon contact. Dashed lines indicate interactions in which only one node, usually the Macrophage
Agent, records information about the contact because the other node represents an agent that is dead.
The agents representing leukocytes are pink or green, indicating their function in innate or adaptive
immunity.
Folcik et al . Theoretical Biology and Medical Modelling 2011, 8:1
/>Page 3 of 25
definition, a win occurred when the virtual infection of Parenchymal Agents was
cleared and more than half of these agents survived or regenerated, a loss outcome
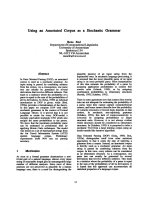
occurred when the infecti on persisted in Parenchymal Agents (Figure 2), or they all
died. The network interactions were also analyzed to identify characteristic features
including interaction frequencies, the percent engagement of agents, and agent popula-
tions constituting functional hubs.
Implementation
The Basic Immune Simulator 2010 (BIS_2010)
The BIS and the new version, B IS_2010, were created using RepastJ [17] in Java. Its
purpose is to examine the activity of the immune system dur ing an immune response
to various pathogens and injury [16]. It is an agent-based model of the immune system
with representations of the cells as agents (additional file 1), these agents have specified
behaviors (additional file 2), and the tissue spaces where cellular interactions take place
are represented as zones (additional file 3). The adjustable param eters and their initial
values are provided in a dditiona l file 4. The agents and spaces are extensions of Java
classes in the RepastJ software library. The behavioral rules for the agents are described
in detail in state diagrams (additional files 5, 6, 7, 8, 9, 10, 11, 12, 13, 14, 15, 16, 17, 18,
19, 20, 21, and 22). The citations for empirical demonstration of immune cell behavior
are in these state diagrams describing the rules. Time is represented as discrete,
sequential “ticks” that allow agent behavioral events to emulate concurrency. Space
and time in the model are abstractly represented. Though duration is not strictly
represented, the correct sequence of events emerge s from the behavioral rules of the
agents, thereby providing an event-driven chronology.
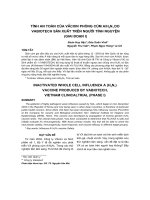
Figure 2 The number of infected Parenchymal Agents for the duration of the simulation for the
win and loss outcomes. The figure shows the average number of infected Parenchymal Agents ± the
95% confidence interval (solid line and dashed lines, respectively) in Zone 1 for every tick of the simulation.
The win outcomes (n = 100) are in black and the loss outcomes (n = 46) are plotted in blue.
Folcik et al . Theoretical Biology and Medical Modelling 2011, 8:1
/>Page 4 of 25
More specifically, at every tick each agent in the simulation is allowed to examine its
immediate environment for signals or other agents. Each agent may react to what it
detects, depending upon the rules that apply for the agent in its current state. It will
only react if it detects a signal or agent relevant to its c urrent state, and it can only
change b y one state, i.e. follow one edge to another state (per t ick). Otherwise, it will
remain in its current state until the next tick. Because many of the state changes repre-
sent behavioral even ts that occur within a solid tissue (as opposed to the blood), the
exact quantity of time they require is unknown. Conditional control of events forces
them to occur in the correct order.
One could estimate the quantity of time represented by ticks based upon the known
duration of immunological events in human systems. The virus and the tissue are gen-
eric in the model and the space was based on human scale (described below), so hall-
marks of the human immune response involving interactions of innate and adaptive
immunity were used to estimate the time scale. The hallmarks used were the peaks of
IgM and IgG antibody detection in the serum [18,19], and the peaks of virus, IgM, and
IgA detection at a mucosal surface [20]. The BIS_2010 correlates were the peaks of sig-
nals Ab5 (IgM), Ab1 and Ab2 (averaged; IgG) in Zone 3 (the blood); and the peaks of
the signals for Virus, Ab5, Ab1 and Ab2 (averaged; IgA) in Zone 1 (the functional tissue
space), respectively. An example calculation used the peak of detection of IgM in the
serum, occurring at 7-10 days [18,19]. The peak of Ab5 in Zone 3 occurred at an average
of 159 ticks (simulation time increments) for the win outcomes (data not shown). Using
8.5 days (the average of 7 and 10 days), 159 ticks/8.5 days is 18.7 ticks/day. There are
1440 minutes/day, and (1440 minutes/day)/(18.7 ticks/day) is 77 minutes/tick, or 1.3
hours/tick. This calculation was performed using six sets of input values from above (all
obtained from win outcomes), with two different values for the day of peak IgG detec-
tion [18,19]. The average value obtained was 64 minutes/tick (range 45-86 minutes/tick)
or approximately 1 hour/tick. If this value is applied to F igure 2, the peak of infected
Parenchymal Agents occurs at 4.3 days for the win outcome.
Space was divided into discrete compartments where relative area in the BIS_2010
Zones approximates the volume of functional human tissue (Zone 1; a representative
organ, such as the lungs), the secondary l ymphoidtissue(Zone2;agroupoflymph
nodes and spleen), and blood (Zone 3). The volume of the lungs in an adult is esti-
mated to be 843 ± 110 ml [21], the volume of the lymph nodes in the thorax is
approxima tely 12 ml [22,23], and the sple en volume ranges from 180-250 ml [18]. The
volume of blood in a human is approximately 5000 ml. The ratios of these volumes,
roughly 1000:20 0:5000, were used to adjust the area s (number of [x, y] coordinates in
the square) of Zones 1, 2, and 3 to 12321:2500:62500, respectively.
Simulation Runs and Initial Conditions
A simulation run begins with all of the zones containing the numbers of agents speci-
fied in the initial conditions (additional file 4) randomly arranged (Zones 2 and 3) in
whole or in part (Zone 1; additional file 3). When the BIS was first described, the
initial parameters controlling the numbers of agents of different types were systemati-
cally varied and the outcomes compared [16]. Based on prior simulation runs and a
parameter sweep of the number of Dendritic Agents, a (biologically) near-optimal set
of experimental conditions were chosen from those producing the results shown in
Folcik et al . Theoretical Biology and Medical Modelling 2011, 8:1
/>Page 5 of 25
additional file 23 to examine the dynamics of immune network direct communication.
Near-optimal was defined as the initial parameter values that resulted in a combination
of a near maximal percentage of outcomes as wins yet enough losses to make compari-
sons of the win vs. loss data. The initial conditions chosen consisted of 200 Dendritic
Agents and the other parameter values given in additional File 4. All of the data shown
inFigures2,3,4,5,6,7,and8,andadditionalfiles24,25,26,27,28,and29came
from 146 simulation runs with those initial conditions, resulting in 100 win outcomes
and 46 loss outcomes for comparison.
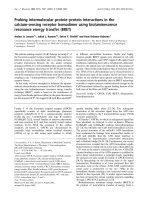
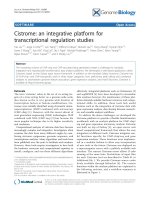
Figure 3 Percentage engagement in the virtual viral immune response for each i mmune agent
type. The percentage of the each of the agents present in the simulation runs, in the win (n = 100) and
the loss (n = 46) outcomes, that made a meaningful contact with at least one other agent were recorded
cumulatively every 100 ticks. The data are expressed as the median percentage (circle) with the error bars
showing the 25th and 75th percentiles. Asterisks between the win and loss results indicate significant
differences at the recorded time point (**p-value < = 0.006; *p-value < = 0.012) using a two-tailed Mann-
Whitney U-test with the Bonferroni correction for multiple comparisons.
Folcik et al . Theoretical Biology and Medical Modelling 2011, 8:1
/>Page 6 of 25
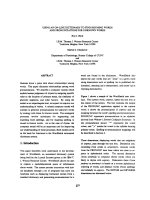
Figure 4 The number of activated Dendritic Agents (DCs) in Zone 2. A. The average number of pro-
inflammatory Dendritic Agents (DC1; blue) and alternatively activated Dendritic Agents (DC2; green) ± the
95% confidence interval (solid line and dashed lines, respectively) for the win outcomes (n = 100). B. The
average number of DC1 and DC2 ± the 95% confidence interval (solid line and dashed lines, respectively)
for the loss outcomes (n = 46). The inset plot shows the loss data on the same scale as the win data in
part A, for comparison.
Figure 5 Quantities of specific interactions between agents representing leukocy tes in Zone 2. The
median (squares), 25
th
percentile and 75
th
percentile of number of links per node for the indicated
combinations of agents and time points for the win (n = 100, open squares) and the loss (n = 46, filled squares)
outcomes are shown. The first agent type listed indicates which agent recorded the contact. An asterisk
between the win and loss results indicate significant differences at the recorded time point (*p-value < =
0.0016) using a two-tailed Mann-Whitney U-test with the Bonferroni correction for multiple comparisons. The
abbreviations are as follows: B, BCell Agent; CTL, CTL Agent; DC, Dendritic Agent; T, TCell Agent.
Folcik et al . Theoretical Biology and Medical Modelling 2011, 8:1
/>Page 7 of 25
Agent Placement and Movement
The Parenchymal Agents representing the functio nal tissue cells (additional file 6) and
the Portal Agents representing the entry and exit points for blood and lymphatic fluid
(additional file 22) were placed in Zone 1 in the same pattern for every simulation run.
Neither of these agent types moved in the tissue zone for the duration of the simula-
tion, but they could die and be replaced depending upon the environmental conditions.
Figure 6 Distributions of links per Node for each immune agent type. The median (triangles), 25
th
percentile and 75
th
percentile of number of links per node for all immune agents (except Granulocyte
Agents) having at least one link for the win (n = 100, open triangles) and the loss (n = 46, filled triangles)
outcomes are shown. The cumulative data for links for every agent were recorded at 100 tick intervals.
Asterisks between the win and loss results indicate significant differences at the recorded time point (*p-
value < = 0.006) using a two-tailed Mann-Whitney U-test with the Bonferroni correction for multiple
comparison.
Folcik et al . Theoretical Biology and Medical Modelling 2011, 8:1
/>Page 8 of 25
The conditions for replacement included the presence of surrounding uninfected Par-
enchymal Agents. The same four locati ons (coordinate s of Parenchymal Agents) were
chosen for the initial sites of viral infection for all data shown. Virus and PK1 signals
(additional file 1) were produced at the first tick of the sim ulation, and after that point
every simulation run produced a unique pattern.
Randomness is an integral part of the model, a nd is included as described here. All
random numbers were generated from a uniform distribution. The Dendritic Agents,
Macrophage Agents, Granulocyte Agents, and TCell, BCell and CTL Agents were placed
randomly in their zones. The few lymphocyte agents specific for the virus (and the other
scenarios) were placed at randomly chosen empty coordinates among non-specific lym-
phocyte agents in Zone 2. Agents moved randomly unless th ey were attracted by signals
representing chemokines. Agent movement was in increments of one [x, y] coordinate
per tick. All signals diffused at each tick, using the Repast J “diffuse” method [17], which
forms concentration gradients. Random initial placement (within the appropriate zones)
and random movement of the agents or non-random movement towards chemotactic
Figure 7 Frequency distributions of contac ts for each immune agent type at 400 ticks. The plots
show the frequency distribution of the contacts as log
10
of the number of nodes vs. the log
10
of the number
of links per node for the first 400 ticks of the simulation for the given agent type and outcome. 7A) BCell
Agent’s win contacts, 752 points, Spearman r = -0.9418, p < 0.0001; 7I) BCell Agent’s loss contacts, 792 points,
Spearman r = -0.7857, p < 0.0001; 7B) TCell Agent’s win contacts, 661 points, Spearman r = -0.8675, p <
0.0001; 7J) TCell Agent’s loss contacts, 281 points, Spearman r = -0.7679, p < 0.0001; 7C) Dendritic Agent’s win
contacts, 1843 points, Spearman r = -0.8482, p < 0.0001; 7K) Dendritic Agent’s loss contacts, 2266 points,
Spearman r = -0.8936, p < 0.0001; 7D) CTL Agent’s win contacts, 187 points, Spearman r = -0.9439, p <
0.0001; 7L) CTL Agent’s loss contacts, 269 points, Spearman r = -0.9509, p < 0.0001; 7E) Macrophage Agent’s
win contacts, 277 points, Spearman r = -0.9586, p < 0.0001; 7M) Macrophage Agent’s loss contacts, 317
points, Spearman r = -0.9771, p < 0.0001; 7F) Natural Killer Agent’s win contacts, 16 points, Spearman r =
-0.6676, p = 0.0047, the correlation coefficient r = -0.106 is not significant; 7N) Natural Killer Agent’s loss
contacts, 16 points, Spearman r = -0.6794, p = 0.0038, the correlation coefficient r = -0.140 is not significant;
7G, 7O) Granulocyte Agent’s contacts, with only 2 points, the correlation cannot be determined; 7H)
Combined immune agent’s win contacts, 1912 points, Spearman r = -0.8954, p < 0.0001; 7P) Combined
immune agent’s loss contacts, 2274 points, Spearman r = -0.9088, p < 0.0001.
Folcik et al . Theoretical Biology and Medical Modelling 2011, 8:1
/>Page 9 of 25
concentration gradients produced by other agents generated the observed patterns. This
is an accurate representation of the immune system, because the cells of the immune
system are initially distributed at random in the lymphoid tissue (in the naive individual)
and migrate in response to environmental cues to carry out their functions [24]. Some-
times they follow biochemical gradients (chemotaxis), and sometimes they are subject to
flow forces or cellular i nteractions in the lymphatics and in the circulation [25,26] that
may randomly change their arrival time at a new destination.
The lymphatic fluid ducts and blood vessels are represented by Portal Agents (addi-
tional file 2 2). When an agent leaves one zone via a Portal Age nt it ente rs another
zone at the site of a Portal Agent, under the control of environmental conditional
rulesattheentrysite.IfnoneofthePortalAgentsinthenewzonesatisfythecondi-
tions for entry (such as having the necessary chemotactic signals present proximally),
the agent remains stationary and waits in a queue for the next tick. In this way, Portal
Agents control the movement of agents and signals between zones. The agents or sig-
nals must be in the Portal Agent’ s Moore neighborhood ( within the eight adjacent
Figure 8 Frequency distributions of contacts for each immune agent type at 1000 ticks. The plots
show the frequency distribution of the contacts as log
10
of the number of nodes vs. the log
10
of the number
of links per node for all 1000 ticks of the simulation for the given agent type and outcome. 8A) BCell Agent’s
win contacts, 1732 points, Spearman r = -0.7197, p < 0.0001; 8I) BCell Agent’s loss contacts, 2353 points,
Spearman r = -0.6487, p < 0.0001; 8B) TCell Agent’s win contacts, 756 points, Spearman r = -0.8636, p <
0.0001; 8J) TCell Agent’s loss contacts, 368 points, Spearman r = -0.8192, p < 0.0001; 8C) Dendritic Agent’s win
contacts, 3444 points, Spearman r = -0.7669, p < 0.0001; 8K) Dendritic Agent’s loss contacts, 17218 points,
Spearman r = -0.9074, p < 0.0001; 8D) CTL Agent’s win contacts, 216 points, Spearman r = -0.9488, p <
0.0001; 8L) CTL Agent’s loss contacts, 580 points, Spearman r = -0.9257, p < 0.0001; 8E) Macrophage Agent’s
win contacts, 310 points, Spearman r = -0.9630, p < 0.0001; 8M) Macrophage Agent’s loss contacts, 470
points, Spearman r = -0.9896, p < 0.0001; 8F) Natural Killer Agent’s win contacts, 16 points, Spearman r =
-0.6853, p = 0.0034, the correlation coefficient r = -0.1945 is not significant; 8N) Natural Killer Agent’s loss
contacts, 16 points, Spearman r = -0.6912, p = 0.0030, the correlation coefficient r = -0.4899 is not significant;
8G, 8O) Granulocyte Agent’s contacts, too few point for correlation to be determined; 8H) Combined
immune agent’s win contacts, 3603 points, Spearman r = -0.8657, p < 0.0001; 8P) Combined immune agent’s
loss contacts, 17250 points, Spearman r = -0.9097, p < 0.0001.
Folcik et al . Theoretical Biology and Medical Modelling 2011, 8:1
/>Page 10 of 25
coordinate spaces to the Portal Agent) for this to occur. They might be considered to
represent endothelial cells, which have been modeled by others for their contributio n
to systemic inflammation [27-29], but they are abstractly represented in the BIS_2010.
Updates included in BIS_2010
The BIS_2010 is an updated version of the agent-based model, the BIS, that was cre-
ated using RepastJ [17,30] and was p reviously described [16]. Because of the discovery
and characterization of new types of T-helper lymphocytes i ncluding the T-helper 17 s
[31-34], regulatory T cells (T-regs; [35-39]), and the T-follicular helper cells [40,41],
the BIS_2010 was updated and these subtypes were added to the TCell Agent class
(additional files 16, 17, and 18). Other additions included enhanced Macrophage Agent
behavior (additional files 10, 11, and 12) and Granulocyte Agent behavior (additional
file 21) in response to other agents in apoptotic (non- inflammatory or programmed
cell death) and necrotic (inflammatory; killed by environmental factors) states. BCell
Agents were updated to include more behavioral states and antibody signals (additional
files 13, 14, and 15). The state diagrams for of all of the agents contain the details of
their behavioral rules with literature c itations, representing them as finite state auto-
mata. Agent behaviors are listed, categorized, and referenced in additional file 2. The
list of references cited in the additional files is in additional file 30. Other updates to
the BIS_2010 include the changes in the Zone areas described above.
Code Verification
When changes were made to the simulation program, the code for the agents’ behavior
was tested to ensure that it was executing correctly before the BIS_2010 was used for
experimen ts. Verifying the code for the behavior of the agents in the BIS_2010 is chal-
lenging because it is a p rogram with sections of code that execute stochastically.
Besides the traditional methods for verification [42], including unit testing, code walk-
throughs, and observation of the visual output (additional file 3) with input parameters
set to produce expected patterns, we have created a program to automate tracing of
agent behavior called the AgentVerifier [43], a separate application from the BIS_2010.
This is a Java application that checks state transitions for the agents and any accompa-
nying changes in internal variable values. This process was previously done by manu-
ally reading the BIS agent behavior output files [16].
Recording the Dynamic Network Interactions
The simulation was run and the interactions were recorded by having each agent count
its contacts with o ther agents that either caused one of the agents involved to change
state or one of the agents to change a value in an internal variable. These criteria
defined “meaningful” contacts. Contacts between two agents that did not meet either
of these criteria (random collisions) were not counted. Agents had to be w ithin one
coordinate space of each other (within the Moore neighborhood, radius = 1), except
for Dendritic Agents, which were allowed to probe a radius of two coordinate spaces
(Moore neighborhood, radius = 2). This represents the relatively large size of dendritic
cells with their long dendri tes [44,45]. In addition, multiple contacts between the same
two agent s were counted (at sequential ticks), as long as they remained in a state that
Folcik et al . Theoretical Biology and Medical Modelling 2011, 8:1
/>Page 11 of 25
recognized the contact (for example, one did not die). Thus, the BIS_2010 models pro-
cesses that have been observed and recorded in living lymphoid tissue [44-53].
Each individual agent kept an ongoing record (a list of integer arrays) of their total
number of meaningful contacts, including the agent types involved and the zone where
the interactions took place. Both agents involv ed in an interac tion recorded the inter-
action unless one of the agents was dead. Because Portal Agents represented structures
and not individual cells, contacts were not recorded for these agents. Contact summa-
ries were saved in text files with comma separated values at 100 tick intervals during
each simulation run.
Signals are another major element in the BIS_2010. The signals represent cytokines
and chemokines, biologically active proteins that direct migration and mediate infor-
mation exchange. All of the signals that the agents produce are listed in additional file
1. Cytokines and chemokines drive cell-cell interaction by providing indirect communi-
cation or “stigmergy” [15], and have been considered to form a net work of communi-
cation among the cells of the immune system [1,10,11,13]. Signals in the BIS_2010
control agent behavior by causing state transitions. The state of an agent determines
whether the agent recognizes a contact with another agent or a signal, simulating the
presence or absence of surface receptors on cells. Production of a signal may be com-
mon t o multiple agent types, as described in additional file 1. For efficiency of execu-
tion, the BIS_2010 was not implemented in a manner that all ows determination of the
agent source of a signal. The impact of signals on network formation was implicitly
captured in the network of direct communication events between agents.
Statistical Analyses
Non-parametric statistical methods were used unless otherwise indicate d. A very con-
servative Bonferroni correction was applied to correct the alpha value used when esti-
mating significance in multiple comparisons. Thus the alpha value necessary for
significance was made smaller by dividing it by the number of comparisons made for a
data set. Outcomes at regular time intervals were analyzed using separate statistical
comparisons to simplify interpretatio n. GraphPad Prism version 5.03 was used to cre-
ate the plots in the figures and perform the statistical analyses.
Results
Simulation outcomes
The initial condi tions for the simulation runs used for the networ k analysis were cho-
sen (from those shown in additional file 23) to provide mostly immune win outcomes
but enough loss outcomes for comparisons to be made. In the win outcomes, all of the
infected Parenchymal Agents were eliminated, usually within the first half of the simu-
lation run (Figu re 2). In the loss outcomes, more Parenchymal Agents became infected
by the time 100 ticks had passed, a nd the virtual immune response failed to eliminate
all of the infected agents. The data shown i n the remainder of the figures came from
the same simulation runs as the data shown in Figure 2. There were many ways to pre-
sent the data derived from these experiments; the results are presented from an immu-
nologist’s perspective.
Folcik et al . Theoretical Biology and Medical Modelling 2011, 8:1
/>Page 12 of 25
Participation of agents in mounting a typical immune response
A characteristic of the immune response demonstrated by the BIS_2010 was that most
of the agent types representing leukocytes never made meaningful contacts with any
other agents (Figure 3). Agents having h ad at least on e meaningful contact (in an y
Zone) were considered “engaged ” in the immune response, and the extent of engage-
ment of each agent type for the response duration was determined. Zero percent of
the agents were engaged at the start of a simulatio n run. The median percent engaged
and inter-quartile ranges are plotted in Figure 3 (with 100 tick intervals) and show the
cumulative history of engagement of each agent type for the duration of the simulation
runs. The levels of engagement for simulation runs that ended in wi n outcomes are
separated from the same data for loss outcomes. The results show that with the excep-
tion of the Dendritic and BCell Agents (Figure 3C and 3A), the median percent of
agents engaged from the win and loss outcomes diverged significantly at 200 ticks into
the simulation.
The Dendritic Agents displayed the greatest increases in engagement at the begin-
ning (100 and 200 ticks) of the virtual immune response (Figure 3C). This initia l surge
corresponds to the recognition of antigen by contact with infected Parenchymal Agents
in Zone 1 (Figure 2; additional file 7). The Dendritic Agents are activated by contact
with the infected Parenchymal Agents and migrate to Zone 2 (Figure 4; additional file
8). Figure 4 shows the average numbers of Dendritic Agents of two different pheno-
types, DC1 s representing the pro-inflammatory type and DC2 s the alternatively acti-
vated type [54-62]. Note the ten-fold difference in the scale for the loss outcomes, in
part B, and the inset in part B for comparison to part A. The numbers of activated
Dendritic Agents that travel to Zone 2 (lymph node equivalent) decreases after the
infected Parenchymal Agents have been nearly eliminated (Figure 2) between 200 and
300 ticks for the win outcome (part A), but not in the loss outcome (part B). In Zone
2 the Dendritic Agents seek BCell, TCell and CTL Agents to make contact and present
antigen(Figure5).Thelaginengagingthese lymphocytic agent types (Figure 3A, B,
and 3D) is due to the time required by the Dendritic Agents to encounter the few viral
antigen-matched lymphocyte agents in Zone 2 [26,46,63 ]. The requ irement for v iral
antigen-specificity a lso accounts for the low level of lymphocyte agent engagement,
especially apparent for the BCell Agents and TCell Agents in Figure 3.
The Natural Killer (NK) Agents and Macrophage Agents (Figure 3E and 3F) repre-
sent cells involved in the innate immune response (additional files 9, 10, 11, and 12). A
greater percentage of these agents became engaged in the loss than in the win out-
come. This is because the NK and Macrophage Agents continued to be engaged by
infected Parenchymal Agents in Zone 1 (Figure 2) in the loss outcome. Macrophage
Agen ts had significantly more contacts with Parenchymal Agents at 10 0 and 200 ticks
in the loss vs . the win outcome (data not shown). The drop in percentage of engaged
agents in the win outcomes for Macrophage and NK Agents indicated an increase in
the number of agents present that were not engaged (Figure 3E and 3F). The engaged
NK Agents in Zone 1 were killing the virally infected Parenchymal Agents or their
“stressed” neighbors (additional files 6 and 9). The median number of contacts with
Parenchymal agents per NK Agent was significantly greater for the loss vs. the win out-
come at 100 and 200 ticks (data not shown), because there were m ore infected Pa r-
enchymal Agents (Figure 2).
Folcik et al . Theoretical Biology and Medical Modelling 2011, 8:1
/>Page 13 of 25
Specific interactions between agents in each zone were counted and the results from
Zone 2 (the lymphoid tissue zone) are shown in Figure 5. The contact pairs in Figure 5
are liste d with the agent recording the contact first. Since both agents would record a
contact between them, the contacts are counted by two agent types in the figure. After
arrival to present antigen in Zone 2, significa ntly higher f requencies of contacts per
Dendriti c Agent wit h the TCell and BCell Agents at these early time points were asso-
ciated with the win outcom e. No outcome-associated differences in the Dendritic
Agents’ median quantity of contacts with CTL Agents were found at 100 and 200 ticks
(Figure 5).
In contrast, significantly fewer Dendritic Agent contacts were made per BCell Agent
for the win vs. the loss outcomes at 100 and 200 ticks in Zone 2 (Figure 5). BCell
Agents also made antibody after contact with virus [64,65], but BCell Agent contacts
with free virus were not counted in these analyses. The effector TCell, CTL, and BCell
Agents generated by this initial activity then migrated via Zone 3 (the blood) to Zone
1 to eliminate the virally infected Parenchymal Cells directly or via antibody produc-
tion (additional files 24, 25, 26 and Figure 2).
The median number of contacts per TCell Agent with BCell and Dendritic Agents was
not greater for the win outcome (Figure 5). However, the win outcomes were associated
with far more TCell Agents making at least one specific contact with a BCell Agent
(fourteen times more per simulation run by 100 ticks) or a Dendritic Agents (ten times
more per simulation run by 100 ticks) than the loss outcomes in Zone 2 (data not
shown). This reiterates the role for TCell Agent engagement for a win (Figure 3B).
The CTL Age nts had a greater percentage of agents engaged in the loss outcome
(Figure 3D), and more were present in Zone 1 (the functional tissue zone) in the loss
outcome ( additional file 26). The CTL Agents contacted Dendritic Agents in Zone 2,
but there were no differences in the median number of these contacts per CTL Agent
(Figure 5) in Zone 2 at 100 or 200 ticks for the win and loss outcomes.
The TCell and BCell Agents need contact with each other in Zone 2 for full activa-
tion and antibody production to occur (additional files 13 and 14; [40,52]). The median
number of contacts per BCell Agent with TCell A gents was not different for the first
100 ticks of win vs. loss o utcomes, but more TCell Agent contacts per BCell agent by
200 ticks was associated with th e win outcome ( Figure 5). In addition, there were
seven times as many BCell Agents that made specific contact with TCell Agents in the
same interval for wins vs. losses (data not shown). By 200 ticks, there were almost nine
times as many BCell Agents that had made contact with a TCell Agent in Zone 2 for
the win vs. the loss outcomes (data not shown).
Interaction history for engaged agents over time
The median number of contacts and the interquartile range (± 25th percentile) were
plotted to describe the overall contact history at every 100 ticks of the simulation in all
zones with all agent types (Figure 6A, B, C, D, E, and 6F).
The BCell Agen ts and TCell Agents had a higher percentage of agents engaged in
the virtual immune response when there was a win outcome (Figure 3A and 3B), but
the median number of conta cts or links per node were greater in the loss outcome
throughout the time course (Figure 6A and 6B). Because the data presented in Figure 6
are cumulative, increases in the numbers of agents without contacts at the end of
Folcik et al . Theoretical Biology and Medical Modelling 2011, 8:1
/>Page 14 of 25
simulation runs resulte d in decreases in the median links per node (Figure 6A, B, and
6F). For the TCell and BCell Agents (Figure 6A and 6B) these are memory cells (addi-
tional files 24 and 25). NK Agents (Figure 6F) are likely unable to make contacts
(kill remaining infected Parenchymal Agents) because anti-inflammatory cytokines pre-
dominate (additional files 9 and 28). These are produced by Macrophage Agents of
type 2, or anti-inflammatory Macrophage Agents ([62]; additional files 10 and 27).
In contrast to the BCell and TCell Agents, the CTL Agents and Natural Killer
Agents had a higher percentage of agents engaged when there was a loss outcome
(Figure 3), and CTL Agents also had more links per node for the loss outcome after
100 ticks (Figure 6D). NK Agents had higher median numbers of links per node at 100
and 200 ticks for the loss outcome (Figure 6F). The difference between cytotoxic T
lymphocytes and natural killer cells is that the cytotoxic T lymphocytes require antigen
presentation in the lymph node (to become activated to kill) but the natural killers
cells do not [66,67], so there was less delay in engagement and killing for the NK
Agents. Although there were no significant differences in the number of contacts per
CTL Agent at 100 ticks between the win and loss outcomes (Figure 6D), from 200
ticks onward the CTL Agents had more contacts per agent in the loss outcome.
The pattern observed for the Macrophag e Agent s was more agents engaged
(Figure 3E) and more contacts (Figure 6E) in the loss outcomes than the win outcomes.
As scavengers, the Macrophag e Agents (Figure 6E) interacted wit h all agents, in most
cases when the agents had died via apoptosis (Figure 1). Engaged Macrophage Agents
had the most contacts per ag ent with Parenchymal Agents (specifically) compared to
all other agents at 100 ticks, and significantly more in the loss outcomes (data not
shown), perhaps because they contacted more infected and apoptotic Parenchymal
Agents and then killed and/or phagocytosed them ([68-70]; additional file 10).
The frequency distributions of the immune network contacts for the BIS_2010
The frequency distributions of the meaningful contacts or links between the a gents
representing leukocytes (nodes) are shown in Figures 7 and 8, and additional files 31,
32, and 33. These plots are the logarithmically transformed, aggregate data from the
win outcomes separated from the aggregate loss outcomes, with the cumulative num-
bers of links per node for data collected at 400 ticks and 1000 ticks (Figures 7 and 8,
respectively). The median number of links per node is in brackets for the engaged
agents in the aggregate data. These “time” points in the simulation run were chosen
because at 400 ticks most of the agents’ activities (contacts wi th other agents) had
reached a l evel near the end-point value ( Figure 6). The frequency distribution is a
power law distribution in all cases except for the d ata from the Granulocyte Agents
and the Natural Killer Agents. The functional relationship was tested on the raw data
using a Spearman non-parametric test for correlation. Similar statistical results were
obtained using linear regression on the log-transformed data (not shown). Remarkably
similar results were obtained when o ther initial conditions were used, including 20,
100, and 300 Dendritic Agents, (1000 ticks shown in additional files 31, 32, and 33;
statistics are summarized in additional file 34).
Thus the frequency distribution of the network interactions between immune cell-
agents during the simulated immune response is scale-free, suggesting that the network
interactions of the immune system are as well. This result is not surprising for the
Folcik et al . Theoretical Biology and Medical Modelling 2011, 8:1
/>Page 15 of 25
system as a whole (Figure 7H and 7P, and Figure 8H and 8P) given that the interac-
tions between elements in complex biological systems can generally be characterized as
scale-free [7,9,71-74]. The frequency distributions for most of the different agent types
were also scale-free, with the exceptions mentioned above, while the Granulocyte
Agents did not have enough data points to test.
The agents representing granulocytes had the fewest agents engaged (data not shown).
They also had the lowest median number of links (Figure 7G and 7O and Figure 8O).
This is because granulocyte behavior, killing pathogens via release of reactive oxygen
species and potent protease enzymes, is dependent upon activation by signals or cyto-
kines/chemokines (additional file 21; [75]). Granulocytes have surface receptors to make
physical contact with pathogens such as bacteria, parasites and fungi [76]. The Granulo-
cyte Agent activation did not require receptor-mediated contact with other agents, but
there were conditions where a few made contact with dying agents and necrotic debris,
a condition thought to mimic pathogen contact (Figure 8G and 8O; [77]).
Immune system hubs
The Dendritic Agents had far more links than the other agents representing immune
cells, making them hub agents of the virtual immune system (Table 1). Without repre-
sentation of the necessity for antigen presentation to the adaptive immune cells, Figure 1
does not convey that Dendritic Agents are hubs. The analysis of the numbers of contacts
between agents revealed this quality. By 200 ticks, a greater percentage of the Dendritic
Agents were engaged compared to the other immune agents (Figure 3). As antigen pre-
senting cells, dendritic cells may have more meaningful contacts than other immune cell
types [78]. However, the median numbers of links for Dendritic Agents in the simulation
seemed higher than expected at the end of the simulation runs and notably in the loss
outcomes (Figure 6). This phenomenon was examined further (Table 2) to determine
which agents the Dendritic Agents were interacting with at such high rates, and in
which zone this was occurring.
Dendritic Agent contacts with each agent type in Zones 1 and 2
The striking difference in the number of contacts for Dendritic Agents between the
win and loss outcomes was even more surprising when it was determined that most of
the contacts were between Dendritic Agents themselves (Table 2). The Dendritic
Table 1 Median Number of Links for All Agents
Agent Type Ticks
100 200 300 400 500 600 700 800 900 1000
BCell Agents 6 1212131313131313 13
CTL Agents 678887777 8
Dendritic Agents 2 14 28 49 95 183 415 849 1495 2366
Granulocyte Agents 001111111 1
Macrophage Agents 222222222 2
Natural Killer Agents 999988887 7
TCell Agents 788877777 7
All 366666789 11
The median numbers of contacts for each agent type representing a leukocyte is given, including only the engaged
agents. These are the contacts from all 146 simulation runs, including the win outcome and the loss outcomes
combined. The results are shown for every 100 ticks of the simulation runs.
Folcik et al . Theoretical Biology and Medical Modelling 2011, 8:1
/>Page 16 of 25
Agents interacted with other agents first in Zone 1 (tissue), and then in Zone 2 (lymph
nodes; Figure 4). The data for the number of contacts made in Zone 2 includes the
contacts from Zone 1 because the counting was not reset when the agents changed
zones. Besides contacting themselves in Zone 2, the engaged Dendritic Agents actually
had more contacts (higher medians) for their numbers of contacts with BCell, TCell
and CTL Agents in the win outcomes than in the loss outcomes (Table 2). This models
the antigen-presenting function of dendritic cells. The numerous contacts betwe en
Dendr itic Agents at the end represented an emergent phenomenon for the simulation,
with biological correlation discussed below.
Discussion
The value of applying network theory to understand relationshi ps embedded in biolo-
gical data is becoming better appreciated [74]. Defining the interactions between ele-
ments of biologica l systems as networks and characterizing the topology has broad
application, from the st udy of protein-protein interactions in small organisms [7,79-82]
to evolution of the protein s of the immune system [83] to defining networks of disease
genotypes [73] and phenotypes [13,84,85]. The arbitrary definition of nodes and edges
distinguishes all of the biological network analyses, and determines what information
can be derived from the application of network theory to biological mechanisms.
Here we chose to define the network nodes as agents representing cells of the
immune system, and edges as physical contacts made between agents representing
immune cell types (via implied surface receptors) during a simulated immune response.
Since an immune response to a pathog en is a dynamic process that involves sequential
steps and movement of cells to different locations in the body to communicate infor-
mation, the network defined above requires a dynamic analysis. This type of analysis
cannot be conducted quantitatively in a living organism, but it can be conducted vir-
tually using an agent-based model of the immune system.
The frequency distribution of the interactions between the agents representing
immune cells was found to be scale-free for a range of starting conditions (Figure 8
and additional files 31, 32, and 33), and the agents representing dendritic cells acted as
hubs in the immune system network. This is consistent with our earlier resu lts, using
a simpler version of the simulation [9]. The new observations from this work include
the a nalysis of the agent interactions recorded over virtual time, the individual agent
Table 2 Dendritic Agent Median Contacts at 1000 ticks
Outcome WIN LOSS
Agent Type Zone 1 Zone 2 Zone 1 Zone 2
BCell Agents 247127
CTL Agents 21719
Dendritic Agents 1 79 1 3085
Granulocyte Agents 1111
Macrophage Agents 1111
Natural Killer Agents 1111
TCell Agents 11015
The median numbers of contacts that each engaged Dendritic Agent had with each agent type representing an immune
cell type is given. The contacts are separated into columns of those accumulated in Zone 1 and then Zone 2, with the
contacts from Zone 1 included with those in Zone 2. The data from the simulation runs are also separated into columns
by their outcome (wins, n = 100; loss, n = 46).
Folcik et al . Theoretical Biology and Medical Modelling 2011, 8:1
/>Page 17 of 25
types recording the types of agents they contacted, and i n which zone the interactions
were taking place.
One observation that arose f rom the assessment of the interactions between the
immune cell agents was that the majority of agents present did not interact during the
simulation (Figure 3). In general, the agents repr esenting innate immune cells (Dendri-
tic, Macrophage, and Natural Killer Agents) were more engaged at the beginning of
the simulation (Figure 3C, E, and 3F; [56,66,86,87]). NK cells kill i nfected cells, but
without the prior need for antige n presentation that adaptive immune cells require
[67,88,89]. Macrophages innately recognize pathogens and infected, apoptotic or necro-
tic cells (additional files 10, 11, and 1 2), but antibody attachment to infected cells or
pathoge ns also helps macropha ges find their targets [90]. The cells of the innate
immune system, by definition, are ready to fight common pathogens at the first detec-
tion of “danger signals” [91-95]. In contrast, Granulocyte Agents had the least mean-
ingful interactions of all of the agent types (Table 1) because they were programmed,
like neutrophils, to become activated by signals or pathogens in the environment,
rather than by specific interactions with other agents [75,76].
The overall lack of engagement for the other agent types is consistent with the real
functioning of the immune system, validating the behavioral rules for the agents of the
BIS_2010. Normal immune responses do not engage all of the cells of the immune sys-
tem and in fact, biological cond itio ns that involve overactive immune system engage-
ment are septic shock [96] or systemic inflammatory response syndrome [77]. These
conditions involve a systemic inflammatory response, with or without detectable infec-
tion, and a mortality rate near 50%.
Our goal was to determine what characteristics of the immune system’s communica-
tion metrics distinguished successful elimination of virus, or the win outcome, from
the loss outcome. Both the numbers of agents making contac ts (specific engagements)
as well as the numbers of specific contacts per agent were compared. Commun ication
between specific agents early in the simulation runs was found to be critical. Signifi-
cantlymorecontactsbetweenDendriticAgents and both TCell a nd BCell Agents,
occurring at 200 ticks or earlier, were associated with the win outcome (Figure 5). In
Zone 2, far more TCell Agents c ontacted BCell Agents and Dendritic Agents in the
first 100 ticks for the win outcomes (data not shown) , but the median numbers of
these specific contacts per TCe ll Agent di d not differ (Figure 5). The same was true
for the number of BCell Agents conta cting TCell Agents. Additional files 24 and 25
show the effector and memory TCell and BCell Agents generated by the specific con-
tacts that migrated to Zone 1 (via Zone 3). These results are consistent with the data
in Figure 3 showing that only the BCell Agents and TCell Agents had more agents
engaged during the simulation runs with the win outcome . The nec essity for rapid
communication, namely antigen presentation to lymphocyte agents, is valid simulation
behavior for a win outcome [56].
CTL Agents also had to make specific contact with Dendritic Agents in Zone 2
(additional file 19) and migrate to Zone 1 to kill infected Parenchymal Agents (addi-
tional file 20) [97-99]. Unexpectedly, early in the simulation, the numbers of Dendritic
Agent contacts with CTL Agents wa s not dif ferent (Figure 5). In the loss outcome,
CTL Agents did not encounter Dendritic Agents and proliferate soon enough, so more
Parenchymal Agents became infected (due to the continuous replication of virus) and
Folcik et al . Theoretical Biology and Medical Modelling 2011, 8:1
/>Page 18 of 25
significantly more CTL Agents became engaged. More effector CTL Agents made their
way to Zone 1 (via Zone 3) in the loss outcome (additional file 26).
The most striking emergent outcome was the difference in the number of links per
node in the win and loss outc omes for the Dendritic Agents (Figur e 6), as well as the
abundance of Dendritic Agents in Zone 2 in the loss outcome (Figure 4). The increase
in the numbers of Dendritic Agents in Zone 2 at the end o f the simulation runs with
the loss ou tcomes is consistent with the high median numbers of contacts between
these agents shown in Table 2, and the “lump” of points with more links per node in
Figure 8K at 1000 ticks, compared to Figure 7K at 400 ticks. This outcome is validated
by studies using in vivo using dual-laser microscopy [26]. Dendritic cells carry out tis-
sue surveillance, phagocytose and process antigens, and present them to lymphocytes
in the lymph node [56,100,101]. During inflammatory responses the lymph nodes
become engorged with cells, and dendritic cells have a role in tissue remodeling of the
lymph node to accommodate the influx [102]. They spread themselves al ong fibro-reti-
cular networks in lymph nodes [103]. This requires “ stepping” over other dendritic
cellsinthesearchforanopenspaceonafibroblast. As such, this migration process
involves contacting other dendritic cells. The searching for an open space behavior was
programmed into Dendritic Agents as normal behavior (additional file 8; [104]). The
structural organization in lymph nodes enhances the ability of dendritic cells to probe
incoming T-lymp hocytes to find an antigen-matched lymp hocyte [44,103]. T-lympho-
cytes travel from lymph node to lymph node [105], and must traverse the long pro-
cesses of dendritic cells that are probing them [104], a process which adds to the
contacts. The reason for the high numbers of contacts in the loss outcome for Dendri-
tic Agents was the abundance of infected Parenchymal Agents in Zone 1, and the sti-
mulation of more Dendritic Agen ts that traveled to Zone 2. This phenomenon is
emergent, and only occurs in the loss outcome, validating the agent behavior rules in
the BIS_2010.
As the previous model had shown [106], the Dendritic Agents represent the immune
cells that are the hubs of the immune system. One could hypoth esize that for prevent-
ing an undesired i mmune response such as transplant rejection, the best cellular target
for therapy would be dendritic cells leaving the transplant tissue. Testing such a
hypothesis would require a method for stopping the dendritic cells before they pre-
sented antigen in the lymph nodes. The dendritic cells also make signals that attract
other leukocytes to the tissue, so such signals would have to be neutralized as well.
This would be a difficult hypothesis to test, because both direct and indirect communi-
cation by the dendritic cells would have to be eliminated. In addition, only those den-
dritic cells presenting antigen from the graftshouldbetargeted,toavoiddiminishing
the immune response to other pathogens.
In summary, we found that recording and analyzing direct interactions between
agent types representing leukocytes using an a gent-based model recapitulated what is
believed to occur in vivo during an immune response. The results support the
immuno-ecology idea that the more rapid the initial response, the better, despite the
highly decentralized nature of the system’s components. In addition, effectiveness is
more important than efficiency for the immune system [1]. Agent-based modeling
allows the analysis of the dynamic interactions between the elements of complex sys-
tems, a unique approach for biology.
Folcik et al . Theoretical Biology and Medical Modelling 2011, 8:1
/>Page 19 of 25
Conclusions
To gain insight into complex systems like the immune system, it is necessary to
expand the types of approaches that we use to study them. An agent-based model of
any complex system could be used to study its dynamic network interactions. Here we
have used the agent-based modeling approach in combination with a dynamic network
analysis to virtua lly observe what cannot be observed in vivo. All dise ase processes
involve the immune system at some level. Any insight that can be gai ned through the
appli cation and combination of modeling and network analyses to the current body of
knowledge of the immune system is valuable info rmation. New techni ques for analyz-
ing collected scientific data in immunology are important for understanding disease
processes and finding new ways to intervene.
Availability and requirements
The new version, BIS_2010 is available as a Java archive file (jar) at: http://digitalunion.
osu.edu/r2/summer06/sass/download.html and as additional file 35. The BIS_2010.jar
file must be downloaded as well as the RepastJ launcher (Repast_J_3.1_Installer.exe),
available at: />The source code was written in Java and compiled with Eclipse [107] using Java Run-
time Environment 6, so a JRE version of at least 6.0 must be installed on the computer
used to run RepastJ and the BIS_2010. Once the necessary software is on the computer,
the RepastJ executable jar must be run as per the instructions included with the soft-
ware. The RepastJ toolbar w ill appear and one must click on the folder on the left. A
“Load Model” panel will appear, and in the “Demo Models” list one must scroll down
and choose “Other Models” ,then“Add”.The“Open” panel allows one to locate the
BIS_2010.jar and “Open” it. Then “Load” must be chosen in the “Load Model” panel to
make the Graphical User Interface (GUI) appea r. In the “Parameters” menu at least
three choices must be made. First, one must choose to set one of the challenges to the
immune system at the top of the list. “Set_ViralInfection:” and “Set_Bacti:” are the veri-
fied choices. A ‘1’ must be typed in to replac e the ‘0’ for one of the choices. Following
that are “StopSimulationAt:” and “CountIncrement”. If these are unchanged, the simula-
tion will run for 1001 ticks and collect contact data every 100 ticks. One text file will be
recorded with the quantities of all elements of the simulation at every tick if it reaches
the “StopSimulationAt:” tick. Two text files will be recorded every time the “countIncre-
ment” is passed. All of these files will appear in the RepastJ folder. To prevent many files
from being generated, the “CountIncrement” can be set equal to “StopSimulationAt:”.
Any other parameters may be altered, and the simulation is started with the triangle in
the toolbar. The simulation can be stopped with the square button in the toolbar.
The source code will only be made available through collaboration agreement with
the contact author.
Additional material
Additional file 1: Table of agents, cells, signals, and soluble mediators. The BIS_2010 agents and signals and
their corresponding cells and soluble mediators A table listing all of the elements in the simulation, with citations.
Additional file 2: Table of citations for agent behaviors. Summary of citations for agent behaviors. A table
listing the agents, their behaviors, and citations for the simulation rules regarding their behaviors.
Additional file 3: Zone 1: A generic tissue space. A screen-shot showing the appearance of the simulation
when it runs.
Folcik et al . Theoretical Biology and Medical Modelling 2011, 8:1
/>Page 20 of 25
Additional file 4: A list of all parameters. Initial parameter values. A list of all of the parameters in the
simulation, most of which are accessible from the GUI.
Additional file 5: Key to state diagrams. A key to the symbols and colors in the state diagrams.
Additional file 6: State diagram: Parenchymal Agents (PC), Zone 1. A state diagram of the potential PC
behavioral sequences in Zone 1.
Additional file 7: State diagram: Dendritic Agents (DCs) Zone 1. A state diagram of the potential DC
behavioral sequences in Zone 1.
Additional file 8: State diagram: Dendritic Agents (DCs), Zone 2. A state diagram of the potential DC
behavioral sequences in Zone 2.
Additional file 9: State diagram: Natural Killer Agents (NKs) in Zone 1. A state diagram of the potential NK
behavioral sequences in Zone 1.
Additional file 10: State diagram: Macrophage agents (MFs), Zone 1. A state diagram of the potential MF
behavioral sequences in Zone 1.
Additional file 11: State diagram: Macrophage Agents (MFs) Zone 2. A state diagram of the potential MF
behavioral sequences in Zone 2.
Additional file 12: State diagram: Macrophage Agents (MFs), Zone 3. A state diagram of the potential MF
behavioral sequences in Zone 3.
Additional file 13: State diagram: BCell Agents (Bs) in Zone 2 (Part 1). A state diagram of the potential B
behavioral sequences in Zone 2.
Additional file 14: State diagram: BCell Agents (Bs) in Zone 2 (Part 2). A state diagram of the potential B
behavioral sequences in Zone 2.
Additional file 15: State diagram: BCell Agents (Bs) in Zones 3 and 1. A state diagram of the potential B
behavioral sequences in Zones 3 and 1.
Additional file 16: State diagram: TCell Agents (Ts) in Zone 2 (Part 1). A state diagram of the potential T
behavioral sequences in Zone 2.
Additional file 17: State diagram: TCell Agents (Ts) in Zone 2 (Part 2). A state diagram of the potential T
behavioral sequences in Zone 2
Additional file 18: State diagram: T Cell agents (Ts) in Zone 1. A state diagram of the potential T behavioral
sequences in Zone 1.
Additional file 19: State diagram: Cytotoxic T Lymphocyte Agents (CTLs) in Zones 2 and 3. A state diagram
of the potential CTL behavioral sequences in Zones 2 and 3.
Additional file 20: State diagram: Cytotoxic T Lymphocyte Agents (CTLs) in Zone 1. A state diagram of the
potential CTL behavioral sequences in Zone 1.
Additional file 21: State diagram: Granulocyte Agents (GRAN) in Zones 3, 1. A state diagram of the potential
GRAN behavioral sequences in Zones 3 and 1.
Additional file 22: State diagram: Portal Agents (Portals). A state diagram describing the Portals.
Additional file 23: Percentage of win or loss outcomes and ticks to eliminate infected agents for different
starting conditions. A figure showing the outcomes when the initial number of Dendritic Agents is varied.
Additional file 24: The number of Effector and Memory TCell Agents in Zone 1 for the duration of the
simulation for the win and loss outcomes. A figure that shows the average numbers of TCell Agents in Zone 1
for the duration of the simulation.
Additional file 25: The number of Effector and Memory BCell Agents in Zone 1 for the duration of the
simulation for the win and loss outcomes. A figure that shows the average numbers of Effector and Memory
BCell Agents in Zone 1 for the duration of the simulation.
Additional file 26: The number of Effector and Memory CTL Agents in Zone 1 for the duration of the
simulation for the win and loss outcomes. A figure that shows the average numbers of Effector and Memory
CTL Agents in Zone 1 for the duration of the simulation.
Additional file 27: The number of Macrophage Agents in Zone 1 for the duration of the simulation for the
win and loss outcomes. A figure that shows the average numbers of Macrophage Agents in Zone 1 for the
duration of the simulation.
Additi
onal file 28: The number of Natural Killer Agents in Zone 1 for the duration of the simulation for
the win and loss outcomes. A figure that shows the average numbers of Natural Killer Agents in Zone 1 for the
duration of the simulation.
Additional file 29: The number of Granulocyte Agents in Zone 1 for the duration of the simulation for the
win and loss outcomes. A figure that shows the average numbers of Granulocyte Agents in Zone 1 for the
duration of the simulation.
Additional file 30: Additional file references. A list of references cited in all of the additional files.
Additional file 31: Frequency distributions of contacts for each immune agent type at 1000 ticks with a
starting condition of 20 Dendritic Agents. A figure that shows the frequency distribution of contacts for each
immune agent type at the end of the simulation (120 simulation runs combined; 20 Dendritic Agents starting
condition) with the win and loss outcomes separated.
Folcik et al . Theoretical Biology and Medical Modelling 2011, 8:1
/>Page 21 of 25
Additional file 32: Frequency distributions of contacts for each immune agent type at 1000 ticks with a
starting condition of 100 Dendritic Agents. A figure that shows the frequency distribution of contacts for each
immune agent type at the end of the simulation (120 simulation runs combined; 100 Dendritic Agents starting
condition) with the win and loss outcomes separated.
Additional file 33: Frequency distributions of contacts for each immune agent type at 1000 ticks with a
starting condition of 300 Dendritic Agents. A figure that shows the frequency distribution of contacts for each
immune agent type at the end of the simulation (120 simulation runs combined; 300 Dendritic Agents starting
condition) with the win and loss outcomes separated.
Additional file 34: Table of statistics for Figure 8 and additional files 31, 32, and 33. A table of statistics
including the number of data points, Spearman r value for correlation and the p-value for the correlation statistic
for all of the frequency distribution diagrams for each agent shown in Figure 8 and additional files 31, 32, and 33.
Additional file 35: An executable jar file for the simulation, BIS_2010.
List of Abbreviations and Definitions
Agent: the interactive entities of the model with rules for behavior; behavior: what the agents are programmed to
do, listed in additional file 2; BIS: Basic Immune Simulator; degree: the number of edges or links a node has with
other nodes; edge: a connection between two nodes, the same as a link; emergent behavior: behavior that occurs
as an unforeseen consequence of the combinations of rules from other agents; engaged : an agent that has made
one or more contacts, hub: a node in a network that has the most edges or links; imposed behavior: intentionally
programmed behavior (behavior necessary for a successful immune response); leukocyte: a white blood cell, all
leukocytes are part of the immune system; link: a connection between two nodes, the same as an edge; Moore
neighborhood: the eight adjacent locations to a central location in a rectangular matrix; node connectivity: the
number of edges or links a node has with other nodes; power-law distribution: a frequency distribution that fits the
funcion y = ax
b
; scale-free distribution: a frequency distribution that spans several powers of a base number; signal:
a representation of diffusing substances produced by the agents; state diagram: a diagram (directed graph) of a
finite state automaton; stigmergy: the indirect communication between agents allowed by changes to the
environment such as signal production; tick: a discrete time step in the simulation; zone : a virtual environment where
agents and signals interact.
Competing interests
The authors declare that they have no competing interests.
Authors’ contributions
VAF created, updated and modified the BIS_2010 to collect data for network analysis. She also conceived of the
AgentVerifier, and modified the BIS_2010 to produce output for the AgentVerifier created by CE, JD, SM, BB and MK.
VAF wrote the initial draft of the manuscript. GB and CBM made substantive intellectual contributions to the
manuscript and interpretation of data, as well as the drafting and revision of the manuscript. SM, JD, CE, BB and MK
designed and created specialized software for data analysis including and in addition to the AgentVerifier. CE, JD and
LD were involved in drafting parts of the manuscript. All authors were involved in revising the manuscript critically for
intellectual content, and have given their final approval for the version to be published.
Acknowledgements
The project described was supported by award number R21HL093675 and R01HL067176 from the National Heart,
Lung, and Blood Institute of the National Institutes of Health. The content is solely the responsibility of the authors
and does not necessarily represent the official views of the National Heart, Lung, and Blood Institute or the National
Institutes of Health.
Although the BIS_2010 runs on a personal computer, the IBM Opteron Cluster of the Ohio Supercomputer Center in
Columbus, Ohio [108] was used to perform the batch runs of the simulation.
Author details
1
Department of Internal Medicine, Division of Pulmonary, Allergy, Critical Care and Sleep Medicine, The Ohio State
University Medical Center, Davis Heart and Lung Research Institute, Columbus, OH, USA.
2
Department of Medicine,
University of Alberta, Edmonton, Alberta, Canada.
3
Department of Computer Science and Engineering, The Ohio State
University, Columbus, OH, USA.
4
Department of Medicine Administration, The Ohio State University Medical Center,
Columbus, OH, USA.
Received: 27 August 2010 Accepted: 19 January 2011 Published: 19 January 2011
References
1. Orosz CG: An introduction to immuno-ecology and immuno-informatics. In Design Principles for the Immune System
and Other Distributed Autonomous Systems. Edited by: Segel L, Cohen IR. New York: Oxford University Press; 2001:.
2. Fadok VA, Bratton DL, Konowal A, Freed PW, Westcott JY, Henson PM: Macrophages that have ingested apoptotic
cells in vitro inhibit proinflammatory cytokine production through autocrine/paracrine mechanisms involving TGF-
β, PGE2, and PAF. Journal of Clinical Investigation 1998, 101:890-898.
3. Haslett C: Granulocyte apoptosis and its role in the resolution and control of lung inflammation. American Journal
of Respiratory and Critical Care Medicine 1999, 160:S5-S11.
Folcik et al . Theoretical Biology and Medical Modelling 2011, 8:1
/>Page 22 of 25
4. Rydell-Tormanen K, Uller L, Erjefalt JS: Direct evidence of secondary necrosis of neutrophils during intense lung
inflammation. European Respiratory Journal 2006, 28:268-274.
5. Yamasaki S, Ishikawa E, Sakuma M, Hara H, Ogata K, Saito T: Mincle is an ITAM-coupled activating receptor that
senses damaged cells. Nature Immunology 2008, 9:1179-1188.
6. Barabasi A-L, Albert R: Emergence of Scaling in Random Networks. Science 1999, 286:509-512.
7. Jeong H, Tombor B, Albert R, Oltvai ZN, Barabasi A-L: The large-scale organization of metabolic networks. Nature
2000, 407:651-654.
8. Albert R, Jeong H, Barabasi A-L: Error and attack tolerance of complex networks. Nature 2000, 406:378-382.
9. Folcik VA, Orosz CG: An Agent-Based Model Demonstrates that the Immune System Behaves Like a Complex
System and a Scale-Free Network. Tenth Annual Swarm Agent-Based Simulation Meeting; Notre Dame University,
Indiana, USA 2006 [ />10. Tieri P, Valensin S, Franceschi C, Morandi C, Castellani GC: Memory and Selectivity in Evolving Scale-Free Immune Networks
Berlin Heidelberg: Springer-Verlag; 2003.
11. Frankenstein Z, Alon U, Cohen IR: The immune-body cytokine network defines a social architecture of cell
interactions. Biology Direct 2006, 1:32.
12. Tieri P, Valensin S, Latora V, Castellani GC, Marchiori M, Remondini D, Franceschi C: Quantifying the relevance of
different mediators in the human immune cell network. Bioinformatics 2005, 21:1639-1643.
13. Fuite J, Vernon SD, Broderick G: Neuroendocrine and immune network re-modeling in chronic fatigue syndrome:
An exploratory analysis. Genomics 2008, 92:393-399.
14. Grasse P-P: La reconstruction du nid et les coordinations inter-individuelles chez Bellicositermes Natalensis et
Cubitermes sp. La theoriede la stigmergie: Essai d’interpretation du comportement des Termites constructeurs.
Insect Sociology 1959, 6:41-80.
15. Bonabeau E, Dorigo M, Theraulaz G: Swarm Intelligence. From Natural to Artificial Systems New York, New York: Oxford
University Press; 1999.
16. Folcik VA, An GC, Orosz CG: The Basic Immune Simulator: An Agent- Based Model to study the interactions
between innate and adaptive immunity. Theoretical Biology and Medical Modelling 2007, 4:39.
17. Repast. Recursive Porous Agent Simulation Toolkit. [ />18. Roitt I, Brostoff J, Male D: Immunology. 6 edition. London: Mosby, Harcourt Publishers Ltd.; 2001.
19. Delves PJ, Martin SJ, Burton DR, Roitt IM: Roitt’s Essential Immunology. Eleventh edition. Malden, MA: Blackwell
Publishing Ltd.; 2006.
20. Mestecky J, Ogra P, McGhee J, Lambrecht BN, Strober W, Eds: Mucosal Immunology. Boston: Elsevier Academic Press;,
Third 2005.
21. Armstrong JD, Gluck EH, Crapo RO, Jones HA, Hughes JMB: Lung
tissue volume estimated by simultaneous
radiographic and helium dilution methods. Thorax 1982, 37:676-679.
22. Quint LE, Glazer GM, Orringer MB, Francis IR, Bookstein FL: Mediastinal lymph node detection and sizing at CT and
autopsy. American Journal of Radiology 1986, 147:469-472.
23. Rusch VW, Asamura H, Watanabe H, Giroux DJ, Rami-Porta R, Golstraw P: The IASLC Lung Cancer Staging Project: A
proposal for a new international lymph node map in the forthcoming seventh edition of the TNM classification
for lung cancer. Journal of Thoracic Oncology 2009, 4:568-577.
24. Bogle G, Dunbar PR: T cell responses in lymph nodes. Wiley Interdisciplinary Reviews: Systems Biology and Medicine 2009.
25. Cahalan MD, Gutman GA: The sense of place in the immune system. Nature Immunology 2006, 7:329-332.
26. Germain RN, Bajenoff M, Castellino F, Chieppa M, Egen JG, Huang AYC, Ishii M, Koo LY, Qi H: Making friends in out-of-
the-way places: how cells of the immune system get together and how they conduct their business as revealed
by intravital imaging. Immunological Reviews 2008, 221:163-181.
27. An G, Lee IA: Complexity, emergence and pathophysiology: Using agent based computer simulation to
characterize the non-adaptive inflammatory response. InterJournal Complex Systems 2000, Manuscript#[344].
28. An G: Complexity in ICU. Concepts for developing a collaborative in silico model of the acute inflammatory
response using agent-based modeling. Journal of Critical Care 2006, 21:105-110.
29. An G: Introduction of an agent-based multi-scale modular architecture for dynamic knowledge representation of
acute inflammation. Theoretical Biology and Medical Modelling 2008, 5:11.
30. North MJ, Collier NT, Vos JR: Experiences Creating Three Implementations of the Repast Agent Modeling Toolkit.
ACM Transactions on Modeling and Computer Simulation 2006, 16:1-25.
31. Langrish CL, Chen Y, Blumenschein WM, Mattson J, Basham B, Sedgwick JD, McClanahan T, Kastelein RA, Cua DJ: IL-23
drives a pathogenic T cell population that induces autoimmune inflammation. The Journal of Experimental Medicine
2005, 201:233-240.
32. Harrington LE, Hatton RD, Mangan PR, Turner H, Murphy TL, Murphy KM, Weaver CT: Interleukin 17-producing CD4+
effector T cells develop via a lineage distinct from the T helper type 1 and 2 lineages. Nature Immunology 2005,
6:1123-1132.
33. Park H, Li Z, Yang XO, Chang SH, Nurieva R, Wang Y-H, Wang Y, Hood L, Zhu Z, Tian Q, Dong C: A distinct lineage of
CD4 T cells regulates tissue inflammation by producing interleukin 17. Nature Immunology 2005, 6:1133-1141.
34. Mangan PR, Harrington LE, O’Quinn DB, Helms WS, Bullard DC, Elson CO, Hatton RD, Wahl SM, Schoeb TR, Weaver CT:
Transforming growth factor-B induces development of the Th17 lineage. Nature 2006, 441:231-234.
35. Hori S, Sakaguchi S: Foxp3: a critical regulator of the development and function of regulatory T cells. Microbes and
Infection 2004, 6:745-751.
36. Bacchetta R, Gregori S, Roncarolo M-G: CD4+
regulatory T cells: Mechanisms of induction and effector function.
Autoimmunity Reviews 2005, 4:491-496.
37. Bettelli E, Carrier Y, Gao W, Korn T, Strom TB, Oukka M, Weiner HL, Kuchroo VK: Reciprocal developmental pathways
for the generation of pathogenic effector T
H
17 and regulatory T cells. Nature 2006, 441:235-238.
38. Quintana FJ, Basso AS, Iglesias AH, Korn T, Farez MF, Bettelli E, Caccamo M, Oukka M, Weiner HL: Control of Treg and
Th17 cell differentiation by the aryl hydrocarbon receptor. Nature 2008, 453:65-72.
39. Feuerer M, hill JA, Mathis D, Benoist C: Foxp3+ regulatory T cells: differentiation, specification, subphenotypes.
Nature Immunology 2009, 10:689-695.
Folcik et al . Theoretical Biology and Medical Modelling 2011, 8:1
/>Page 23 of 25
40. Chtanova T, Tangye SG, Newton R, Frank N, Hodge MR, Rolph MS, Mackay CR: T follicular helper cells express a
distinctive transriptional profile, reflecting their role as non-Th1/Th2 effector cells that provide help for B cells. The
Journal of Immunology 2004, 173:68-78.
41. Bryant VL, Ma CS, Avery DT, Li Y, Good KL, Corcoran LM, deWaalMalefyt R, Tangye SG: Cytokine-mediated regulation
of human B cell differentiation into Ig-secreting cells: Predominant role of IL-21 produced by CXCR5+ T follicular
helper cells. The Journal of Immunology 2007, 179:8180-8190.
42. Law AM: Simulation Modeling and Analysis. 4 edition. Boston: McGraw-Hill; 2007.
43. Ekbote C, Doolittle J, Block B, Marsh C, Folcik VA: Verification of an agent-based model: Meeting the challenge of
verifying object-oriented code that executes stochastically. Swarmfest 2010; Santa Fe Complex, Santa Fe, New Mexico
2010 [ />_Meeting_the_Challenge_of_Verifying_Object-Oriented_Code_that_Executes_Stochastically].
44. Bajénoff M, Granjeaud S, Guerder S: The strategy of T cell antigen-presenting cell encounter in antigen-draining
lymph nodes revealed by imaging of initial T cell activation. J Exp Med 2003, 198:715-724.
45. Miller MJ, Hejazi AS, Wei SH, Cahalan MD, Parker I: T cell repertoire scanning is promoted by dynamic dendritic cell
behavior and random T cell motility in the lymph node. Proc Natl Acad Sci 2004, 101:998-1003.
46. Ingulli E, Mondino A, Khoruts A, Jenkins MK: In vivo detection of dendritic cell antigen presentation to CD4+ T cells.
Journal of Experimental Medicine 1997, 185:2133-2141.
47. Garside P, Ingulli E, Merica RR, Johnson JG, Noelle RJ, Jenkins MK: Visualization of specific B and T lymphocyte
interactions in the lymph node. Science 1998, 281:96-99.
48. Miga AJ, Masters SR, Durell BG, Gonzales M, Jenkins MK, Maliszewski C, Kikutani H, Wade WF, Noelle RJ: Dendritic Cell
longevity and T cell persistence is controlled by CD154-CD40 interactions. Eur J Immunol 2001, 31:959-965.
49. Bousso P, Robey E: Dynamics of CD8+ T cell priming by dendritic cells in intact lymph nodes. Nature Immunology
2003, 4:579-585.
50. Crotty S, Felgner P, Davies H, Glidewell J, Villarreal L, Ahmed R: Cutting edge: Long-term B cell memory in humans
after smallpox vaccination. The Journal of Immunology 2003, 171:4969-4973.
51. Mempel TR, Henrickson SE, vonAndrian UH: T-cell priming by dendritic cells in lymph nodes occurs in three distinct
phases. Nature 2004, 427:154-159.
52. Okada T, Miller MJ, Parker I, Krummel MF, Neighbors M, Hartley SB, O’Garra A, Cahalan MD, Cyster JG: Antigen-engaged
B cells undergo chemotaxis toward the T zone and form motile conjugates with helper T cells. PLoS Biology 2005,
3:e150.
53. Germain RN, Miller MJ, Dustin ML, Nussenzweig MC: Dynamic imaging of the immune system: progress, pitfalls and
promise. Nature Reviews Immunology 2006, 6:497-507.
54. Oppmann B, Lesley R, Blom B, Timans JC, Xu Y, Hunte B, Vega F, Yu N, Wang J, Singh K, Zonin F, Vaisberg E,
Churakova T, Liu M, Gorman D, Wagner J, Zurawski S, Liu Y-J, Abrams JS, Moore KW, Rennick D, de Waal-Malefyt R,
Hannum C, Bazan JF, Kastelein RA: Novel p19 protein engages IL-12p40 to form a cytokine, IL-23, with biological
activities similar as well as distinct from IL-12. Immunity 2000, 13
:715-725.
55.
Koch F, Stanzl U, Jennewein P, Janke K, Heufler C, Kampgen E, Romani N, Schuler G: High level IL-12 production by
murine dendritic cells: Upregulation via MHC Class II and CD40 molecules and downregulation by IL-4 and IL-10.
Journal of Experimental Medicine 1996, 184:741-746.
56. Hart DNJ: Dendritic Cells: Unique leukocyte populations which control the primary immune response. Blood 1997,
90:3245-3287.
57. Vieira PL, de Jong EC, Wierenga EA, Kapsenberg ML, Kalinski P: Development of Th1-inducing capacity in myeloid
dendritic cells requires environmental instruction. J Immunol 2000, 164:4507-4512.
58. Moser M, Murphy KM: Dendritic cell regulation of T
H
1-T
H
2 development. Nature Immunology 2000, 1:199-205.
59. Tanaka H, Demeure CE, Rubio M, Delespesse G, Sarfati M: Human monocyte-derived dendritic cells induce naïve T
cell differentiation into T helper cell type 2 (Th2) or Th1/Th2 effectors: Role of stimulator/responder ratio. J Exp
Med 2000, 192:405-411.
60. Anderson CF, Lucas M, Gutierrez-Kobeh L, Field AE, Mosser DM: T cell biasing by activated dendritic cells. J Immunol
2004, 173:955-961.
61. Boniface K, Blom B, Liu Y-J, deWaal-Malefyt R: From interleukin-23 to T-helper 17 cells: human T-helper cell
differentiation revisited. Immunological Reviews 2008, 226:132-146.
62. Couper KN, Blount DG, Riley EM: IL-10: The master regulator of immunity to infection. The Journal of Immunology
2008, 180:5771-5777.
63. Dubois B, Bridon J-M, Fayette J, Barthelemy C, Banchereau J, Caux C, Briere F: Dendritic cells directly modulate B cell
growth and differentiation. Journal of Leukocyte Biology 1999, 66:224-230.
64. Sixt M, Kanazawa N, Selg M, Samson T, Roos G, Reinhardt DP, Pabst R, Lutz MB, Sorokin L: The conduit system
transports soluble antigens from the afferent lymph to resident dendritic cells in the T cell area of the lymph
node. Immunity 2005, 22:19-29.
65. Lopes-Carvalho T, Foote J, Kearney JF: Marginal zone B cells in lymphocyte activation and regulation. Current Opinion
in Immunology 2005, 17:244-250.
66. Salazar-Mather TP, Orange JS, Biron CA: Early murine cytomegalovirus (MCMV) infection induces liver Natural Killer
(NK) cell inflammation and protection through Macrophage Inflammatory Protein 1α (MIP-1α)-dependent
pathways. J Exp Med 1998, 187:1-14.
67. Smyth MJ, Cretney E, Kelly JM, Westwood JA, Street SEA, Yagita H, Takeda K, van Dommelen SLH, Degli-Esposti MA,
Hayakawa Y: Activation of NK cell cytotoxicity. Molecular Immunology 2005, 42:501-510.
68. Ricevuti G: Host tissue damage by phagocytes. Annals of the New York Academy of Sciences 1997, 832:426-448.
69. Huynh M-LN, Fadok VA, Henson PM: Phosphatidylserine-dependent ingestion of apoptotic cells promotes TGF-β1
secretion and the resolution of inflammation. The Journal of Clinical Investigation 2002, 109:41-50.
70. Anderson CF, Mosser DM: Cutting edge: Biasing immune responses by directing antigen to macrophage Fcg
receptors. Journal of Immunology 2002, 168:3697-3701.
71. Barabasi A-L, Oltvai ZN: Network biology: Understanding the cell’s functional organization. Nature Reviews Genetics
2004,
5:101-113.
Folcik et al . Theoretical Biology and Medical Modelling 2011, 8:1
/>Page 24 of 25
72. Barabasi A-L, Bonabeau E: Scale-Free Networks. Scientific American 2003, May:60-69.
73. Barabasi A-L: Network medicine–from obesity to the “diseasome”. The New England Journal of Medicine 2007,
357:404-407.
74. Barabasi A-L: Scale-free networks: a decade and beyond. Science 2009, 325:412-413.
75. Segal AW: How neutrophils kill microbes. Annu Rev Immunol 2005, 23:197-223.
76. Parker LC, Whyte MKB, Dower SK, Sabroe I: The expression and roles of Toll-like receptors in the biology of the
human neutrophil. Journal of Leukocyte Biology 2005, 77:886-892.
77. Zhang Q, Raoof M, Chen Y, Sumi Y, Sursal T, Junger W, Brohi K, Itagaki K, Hauser CJ: Circulating mitochondrial DAMPs
cause inflammatory responses to injury. Nature 2010, 464:104-107.
78. Beltman JB, Maree AFM, Lynch JN, Miller MJ, deBoer RJ: Lymph node topology dictates T cell migration behavior. The
Journal of Experimental Medicine 2007, 204:771-780.
79. Lee I, Date SV, Adai AT, Marcotte EM: A probabilistic functional network of yeast genes. Science 2004, 306:1555-1558.
80. Almaas E, Oltvai ZN, Barabasi A-L: The activity reaction core and plasticity of metabolic networks. PLoS
Computational Biology 2005, 1:e68.
81. Zotenko E, Mestre J, O’Leary DP, Przytycka TM: Why do hubs in the yeast protein interaction network tend to be
essential: reexamining the connection between the network topology and essentiality. PLoS Computational Biology
2008, 4:1-16.
82. He X, Zhang J: Why do hubs tend to be essential in protein networks? PLoS Genetics 2006, 2:0826-0834.
83. Ortutay C, Vihinen M: Efficiency of the immunome protein interaction network increases during evolution.
Immunome Research 2008, 4:4.
84. Goh K-I, Cusick ME, Valle D, Childs B, Vidal M, Barabasi A-L: The human disease network. Proceedings of the National
Academy of Sciences 2007, 104:8685-8690.
85. Hidalgo CA, Blumm N, Barabasi A-L, Christakis N: A dynamic network approach for the study of human phenotypes.
PLoS Computational Biology 2009, 5:e1000353.
86. Lodoen MB, Lanier LL: Natural killer cells as an initial defense against pathogens. Current Opinion in Immunology
2006, 18:391-398.
87. Takeguchi O, Akira S: Innate immunity to virus infection. Immunological Reviews 2009, 227:75-86.
88. Beilhack A, Rockson SG: Immune traffic: A functional overview. Lymphatic Research and Biology 2003, 1:219-234.
89. Stetson DB, Mohrs M, Reinhardt RL, Baron JL, Wang Z-E, Gapin L, Kronenberg M, Locksley RM: Constitutive cytokine
mRNAs mark Natural Killer (NK) and NK T Cells poised for rapid effector function. J Exp Med 2003, 198:1069-1076.
90. Casadevall A, Pirofski L: Antibody-mediated regulation of cellular immunity and the inflammatory response. TRENDS
in Immunology 2003, 24:474-478.
91. Gallucci S, Lolkema M, Matzinger P: Natural Adjuvants: Endogenous activators of dendritic cells. Nature Medicine
1999, 5:1249-1255.
92. Srivastava P: Roles of heat shock protein in innate and adaptive immunity. Nature Reviews Immunology 2002,
2:185-194.
93. Shi Y, JE E, Rock KL: Molecular identification of a danger signal that alerts the immune system to dying cells. Nature
2003, 425:516-521.
94. Sansonetti PJ: The innate signaling of dangers and the dangers of innate signaling. Nature Immunology 2006,
7:1237-1242.
95. Matzinger P: Friendly and dangerous signals: is the tissue in control? Nature Immunology 2007, 8:11-13.
96. Nguyen HB, Rivers EP, Abrahamian FM, Moran GJ, Abraham E, Trzeclak S, Huang DT, Osborn T, Stevens D, Talan DA, ED-
SEPSIS Working Group: Severe sepsis and septic shock: Review of the literature and emergency department
management guidelines. Annals of Emergency Medicine 2006, 48:28-54.
97. Ridge JP, Rosa FD, Matzinger P: A conditioned dendritic cell can be a temporal bridge between a CD4+ T-helper
and a T-killer cell. Nature 1998, 393:474-478.
98. Bennett SRM, Carbone FR, Karamalis F, Flavell RA, Miller JFAP, Heath WR: Help for cytotoxic-T-cell responses is
mediated by CD40 signalling. Nature 1998, 393:478-480.
99. Schoenberger SP, Toes REM, vanderVoort EIH, Offringa R, Melief CJM: T-cell help for cytotoxic T lymphocytes is
mediated by CD40-CD40L interactions. Nature 1998, 393:480-483.
100. Banchereau J, Steinman RM: Dendritic cells and the control of immunity. Nature 1998, 392:245-252.
101. Mellman I, Steinman RM: Dendritic cells: Specialized and regulated antigen processing machines. Cell 2001,
106:255-258.
102. Webster B, Ekland EH, Agle LM, Chyou S, Ruggieri R, Lu TT:
Regulation of lymph node vascular growth by dendritic
cells. The Journal of Experimental Medicine 2006, 203:1903-1913.
103. Katakai T, Hara T, Lee J-H, Gonda H, Sugai M, Shimizu A: A novel reticular stromal structure in lymph node cortex: an
immuno-platform for interactions among dendritic cells, T cells and B cells. International Immunology 2004,
16:1133-1142.
104. Lindquist RL, Shakhar G, Dudziak D, Wardemann H, Eisenreich T, Dustin ML, Nussenzweig MC: Visualizing dendritic cell
networks in vivo. Nature Immunology 2004, 5:1243-1250.
105. Miller MJ, Wei SH, Cahalan MD, Parker I: Autonomous T cell trafficking examined in vivo with intravital two-photon
microscopy. Proceedings of the National Academy of Sciences 2003, 100:2604-2609.
106. Folcik VA, Orosz CG: An Agent-Based Model Demonstrates that the Immune System Behaves Like a Complex
System and a Scale-Free Network. Swarmfest 2006, Tenth Annual Swarm Agent-Based Simulation Meeting Notre Dame
University, Indiana, USA;[ />107. Eclipse. [].
108. Ohio Supercomputing Center. [].
doi:10.1186/1742-4682-8-1
Cite this article as: Folcik et al.: Using an agent-based model to analyze the dynamic communication network of
the immune response. Theoretical Biology and Medical Modelling 2011 8:1.
Folcik et al . Theoretical Biology and Medical Modelling 2011, 8:1
/>Page 25 of 25