Báo cáo y học: " Using an expiratory resistor, arterial pulse pressure variations predict fluid responsiveness during spontaneous breathing: an experimental porcine study" pdf
Bạn đang xem bản rút gọn của tài liệu. Xem và tải ngay bản đầy đủ của tài liệu tại đây (394.99 KB, 9 trang )
Open Access
Available online />Page 1 of 9
(page number not for citation purposes)
Vol 13 No 2
Research
Using an expiratory resistor, arterial pulse pressure variations
predict fluid responsiveness during spontaneous breathing: an
experimental porcine study
Michael K Dahl, Simon T Vistisen, Jacob Koefoed-Nielsen and Anders Larsson
Anaesthesia and Intensive Care Medicine, North Denmark Region, Aalborg Hospital – Aarhus University Hospitals, Hobrovej 18-22, DK-9000
Aalborg, Denmark
Corresponding author: Michael K Dahl,
Received: 23 Oct 2008 Revisions requested: 14 Jan 2009 Revisions received: 11 Feb 2009 Accepted: 20 Mar 2009 Published: 20 Mar 2009
Critical Care 2009, 13:R39 (doi:10.1186/cc7760)
This article is online at: />© 2009 Dahl et al.; licensee BioMed Central Ltd.
This is an open access article distributed under the terms of the Creative Commons Attribution License ( />),
which permits unrestricted use, distribution, and reproduction in any medium, provided the original work is properly cited.
Abstract
Introduction Fluid responsiveness prediction is difficult in
spontaneously breathing patients. Because the swings in
intrathoracic pressure are minor during spontaneous breathing,
dynamic parameters like pulse pressure variation (PPV) and
systolic pressure variation (SPV) are usually small. We
hypothesized that during spontaneous breathing, inspiratory
and/or expiratory resistors could induce high arterial pressure
variations at hypovolemia and low variations at normovolemia
and hypervolemia. Furthermore, we hypothesized that SPV and
PPV could predict fluid responsiveness under these conditions.
Methods Eight prone, anesthetized and spontaneously
breathing pigs (20 to 25 kg) were subjected to a sequence of
30% hypovolemia, normovolemia, and 20% and 40%
hypervolemia. At each volemic level, the pigs breathed in a
randomized order either through an inspiratory and/or an
expiratory threshold resistor (7.5 cmH
2
O) or only through the
tracheal tube without any resistor. Hemodynamic and
respiratory variables were measured during the breathing
modes. Fluid responsiveness was defined as a 15% increase in
stroke volume (ΔSV) following fluid loading.
Results Stroke volume was significantly lower at hypovolemia
compared with normovolemia, but no differences were found
between normovolemia and 20% or 40% hypervolemia.
Compared with breathing through no resistor, SPV was
magnified by all resistors at hypovolemia whereas there were no
changes at normovolemia and hypervolemia. PPV was
magnified by the inspiratory resistor and the combined
inspiratory and expiratory resistor. Regression analysis of SPV or
PPV versus ΔSV showed the highest R
2
(0.83 for SPV and 0.52
for PPV) when the expiratory resistor was applied. The
corresponding sensitivity and specificity for prediction of fluid
responsiveness were 100% and 100%, respectively, for SPV
and 100% and 81%, respectively, for PPV.
Conclusions Inspiratory and/or expiratory threshold resistors
magnified SPV and PPV in spontaneously breathing pigs during
hypovolemia. Using the expiratory resistor SPV and PPV
predicted fluid responsiveness with good sensitivity and
specificity.
Introduction
It may be difficult to assess whether a spontaneously breath-
ing patient would hemodynamically benefit from intravenous
fluid administration [1,2]. The oldest and most common proce-
dure is observing whether blood pressure will drop by an
upright tilt test – and the reverse to this procedure, leg raising,
has recently been shown to accurately predict fluid respon-
siveness [3-5]. This procedure should be performed passively,
however, and it is therefore not possible to perform with all
beds or stretchers [4,5]. Static measures such as the central
venous pressure or the pulmonary artery wedge pressure, if
not extremely low, are not useful for assessment of fluid
responsiveness [6-8]. A fluid challenge may tip patients with
borderline cardiac insufficiency into an overt pulmonary
edema, necessitating ventilatory support.
During controlled mechanical ventilation using relatively large
tidal volumes with the patient deeply sedated and muscle-
relaxed, dynamic measures such as pulse pressure variation
(PPV) and systolic pressure variation (SPV) predict fluid
PPV: pulse pressure variation; SPV: systolic pressure variation; SV: stroke volume.
Critical Care Vol 13 No 2 Dahl et al.
Page 2 of 9
(page number not for citation purposes)
responsiveness well [8-10]. These variations are caused by
tidal changes in the intrathoracic pressure induced by positive
pressure ventilation. During spontaneous breathing the
changes in intrathoracic pressures are minimal and often the
normal increase in arterial pressure during expiration is difficult
to discern [11]. In pathological situations where the left heart
filling is hampered during inspiration, such as cardiac tampon-
ade, or when the right heart filling is reduced during expiration
by high intrathoracic pressure, for example at acute exacerba-
tion of chronic obstructive lung disease or asthma, however,
the normal respiratory variations in arterial pressure may be
enhanced, creating pulsus paradoxus [11,12]. In addition, pul-
sus paradoxus has been reported as a sign of severe hemor-
rhagic shock [12].
We hypothesized that a low level of expiratory resistance –
reducing right heart filling and, some beats later (during the
inspiratory phase), reducing the left ventricular stroke volume
(SV) – or an inspiratory resistance – enhancing the right heart
filling and, some beats after, enhancing the left ventricular SV
– could induce high arterial pressure variations at hypovolemia
and low arterial pressure variations at normovolemia and hyp-
ervolemia. The SPV or PPV might therefore predict fluid
responsiveness during spontaneous breathing when expira-
tory and/or inspiratory resistances are used. In addition, we
hypothesized – because an expiratory resistance would theo-
retically give similar changes as repeated short Valsalva
maneuvers (that is, initial augmentation of the arterial pressure
followed by a depression) – that tidal changes in arterial pres-
sure caused by an expiratory resistor might give similar or bet-
ter information about fluid responsiveness than an inspiratory
resistor or an inspiratory/expiratory resistor.
The aim of this study was to test in a porcine experimental
model whether the SPV and the PPV would be magnified by
an expiratory resistor, an inspiratory resistor or a combined
inspiratory/expiratory resistor during hypovolemia, normovo-
lemia and hypervolemia, and to test whether the SPV or PPV
when using an expiratory resistor would predict the hemody-
namic effect of subsequent fluid loading.
Materials and methods
The study was approved by the national animal ethics commit-
tee, and the National Institutes of Health principles of labora-
tory care were followed. Eight pigs, weighing 25 to 30 kg,
were premedicated with apazerone 80 mg intramuscularly and
midazolam 10 mg intramuscularly. Anesthesia was induced by
remifentanil 1 μg/kg intravenously and propofol 3 mg/kg intra-
venously. A tracheotomy was performed and the trachea was
intubated with a Portex 9.0 ID tube (Smiths Medical, London,
UK). The lungs were ventilated by a Servo 900 C ventilator
(Siemens-Elema, Solna, Sweden) with volume control, tidal
volume of 8 ml/kg, positive end-expiratory pressure of 5
cmH
2
O and a fraction of inspired oxygen of 1.0. The inspira-
tory time was 35%, the end-inspiratory pause time was 10%
and the ventilatory rate was adjusted to achieve an arterial pH
of approximately 7.4. Anesthesia was maintained with keta-
mine 10 mg/kg/hour, remifentanil 0.5 μg/kg/hour and propofol
10 mg/kg/hour. Ringer's acetate 20 ml/kg was infused during
the instrumentation phase. In one animal, a bolus of Ringer's
acetate 10 ml/kg was administered to stabilize circulation
before the main experiment. Monitoring with electrocardiogra-
phy and pulse oximetry (placed on the tail) was initiated.
Catheters were placed in the right carotid artery, in a femoral
artery, and in the right internal jugular vein for sampling of
blood gases, monitoring of intravascular pressures and obtain-
ing the pulse contour cardiac output. A pulmonary artery cath-
eter (Swan-Ganz CCO mbo CCO/SvO
2
7.5 Fr; Edwards
Lifescience, Irvine, CA, USA) was placed via the right external
jugular vein to monitor the pulmonary artery and central venous
pressures. A suprapubic urinary catheter was inserted for
monitoring diuresis.
An air-filled 6 Fr catheter was inserted in the tracheal tube with
the end-hole 1 cm below the distal opening of the tracheal
tube for airway pressure monitoring. The distal esophageal
pressure was measured via a latex balloon catheter (Viasys
Healthcare, Hochberg, Germany) and an adequate position
was ensured as previously described [13]. The tracheal and
esophageal catheters were connected to transducers
(Edwards Lifesciences) and the signals were transferred to a
monitor (S/5 Avance Carestation; GE Healthcare, Chalfont St
Giles, UK).
The pulse contour cardiac output was obtained through the
catheter (Pulsiocath, 4 Fr, 16 cm; Pulsion Medical Systems,
Munich, Germany) placed in a femoral artery connected to the
PiCCO monitor (Pulsion Medical Systems). The pulse contour
cardiac output measurement was calibrated in triple with the
transpulmonary arterial thermodilution technique using cold
saline injectate (3 × 10 ml) immediately after induction of
anesthesia and before each measurement sequence. In addi-
tion, the intrathoracic blood volume and PPV were obtained
from the PiCCO device.
During the entire study period, electrocardiography, the car-
diac output, blood pressures, the heart rate, and the airway
and esophageal pressures were recorded continuously for
later analyses. Blood gases were sampled from the right
carotid and the pulmonary artery and were analyzed by an ABL
710 (Radiometer, Copenhagen, Denmark).
Experimental protocol
The outline of the experiment is shown in Figure 1. After instru-
mentation, the animal was placed prone and an interval of 20
minutes was allowed before spontaneous breathing was
attempted; the ventilatory rate was reduced to one-half, the
triggering level of the ventilator was set at -1 cmH
2
O, the
remifentanil infusion was stopped, and the ketamine and pro-
Available online />Page 3 of 9
(page number not for citation purposes)
pofol infusions were halved and then adjusted to maintain ade-
quate anesthesia (no movement and no reaction to painful
stimulation of the anterior toes). When spontaneous breathing
attempts began (the animal started to initiate breaths by trig-
gering the ventilator), the ventilator was set to low-level pres-
sure support (2 cmH
2
O above the positive end-expiratory
pressure). After about 2 minutes, the animal was connected to
a spontaneous breathing device consisting of a Y-piece with
inspiratory and expiratory valves and an anesthesia balloon
with a valve regulating the oxygen flow from a flowmeter con-
nected to a central pressurized oxygen source. The balloon
was attached proximal to the inspiratory valve and the oxygen
flow was regulated manually, keeping the balloon slightly
expanded but still flaccid. In a bench test, the valves and the
Y-piece generated <1 cmH
2
O resistance to inspiratory and
expiratory flow.
In the main experiment, when testing the effect of an expiratory
resistance, the expiratory valve was replaced with a 7.5
cmH
2
O threshold resistor (CPAP; Philips Respironics,
Herrshing, Germany); when the effect of an inspiratory resist-
ance was tested, the inspiratory valve was replaced with a 7.5
cmH
2
O threshold resistor (CPAP; Philips Respironics); and
when the effect of both expiratory and inspiratory resistances
was tested, both resistors were connected as described
above. In a bench test before the experiment, with the connec-
tors used, the inspiratory resistor gave a resistance of 8.5
cmH
2
O and the expiratory resistor gave a resistance of 7.5
cmH
2
O.
Baseline data were obtained during spontaneous breathing
without a resistor. Thereafter, the main experiment was initi-
ated. Measurements were performed when the animals
breathed without a resistor, with the expiratory resistor, with
the inspiratory resistor and with the inspiratory/expiratory
resistor at four volemic levels: 30% hypovolemia, normovo-
lemia, and 20% and 40% hypervolemia. The order of breathing
modes was randomized by computer randomization. Hypovo-
lemia was achieved by venesection of 30% of the estimated
blood volume, normovolemia was achieved by replacing the
depleted blood with a starch solution (Voluven; Fresenius
Kabi, Uppsala, Sweden), and 20% and 40% hypervolemia
were achieved by infusion of corresponding volumes of the
starch solution.
The blood volume was estimated as 179 × body weight
(0.73)
,
which is about 8% of the body weight [14]. The sequence of
intravascular volume levels was always hypovolemia, normov-
olemia, and 20% and 40% hypervolemia. Each infusion or
blood removal was performed over 5 to 10 minutes. During
these procedures the animal breathed with pressure support
using the settings as described above. This was followed by a
5-minute stabilization period with spontaneous breathing
before a new measurement sequence was performed. Electro-
cardiography, the cardiac output, systolic arterial blood pres-
sures, the heart rate, the pulmonary artery wedge pressure, the
central venous pressure, the intrathoracic blood volume, and
the SPV and PPV were registered 3 minutes after the resistor
change. Blood gases were sampled, and the airway and
esophageal pressures were obtained for calculation of the
transpulmonary pressure and respiratory intrathoracic pres-
sure variations.
After the experiment, the animal was killed by an overdose of
thiopental and potassium chloride intravenously.
Calculations
Fluid responsiveness was defined as an increase in the SV of
15% after fluid loading.
Before the study, we decided to manually calculate the PPV
and the SPV from the pressure tracings, because we have pre-
viously found a significant variation in the PiCCO monitor's
stated SPV and PPV values during controlled ventilation of
pigs [15]. We had problems with measuring the PPV correctly,
however, and therefore the PPV was obtained automatically
from the PiCCO device. The SPV was calculated over six res-
piratory cycles as previously described by Michard and col-
leagues [16].
The SV was obtained as the ratio of cardiac output/heart rate.
Airway pressure variations were calculated as the mean values
for six respiratory cycles of maximal airway pressure (expira-
tion) minus minimum airway pressure (inspiration). The same
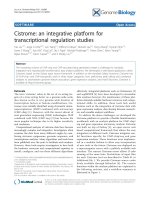
Figure 1
Outline of the experimentOutline of the experiment. The experimental procedure. Venesection,
venesection of 30% of the estimated blood volume. Fluids, intravenous
infusion of a starch solution of first 30% and then 20% of the estimated
blood volume. Measurements, measurements of hemodynamic and res-
piratory variables. Tests were performed with the different resistors in a
randomized order (see text). End, end of the experiment.
Critical Care Vol 13 No 2 Dahl et al.
Page 4 of 9
(page number not for citation purposes)
calculations were carried out regarding the pleural (esopha-
geal) pressure. The transpulmonary pressure was obtained as
the airway pressure minus esophageal pressure at similar time
points, and the variations were registered simultaneously with
the airway pressure.
Statistical analysis
The statistical analyses were performed using the SigmaStat
3.5 program (Systat Inc., Point Richmond, CA, USA). Results
are presented as the mean and standard deviation, if not oth-
erwise indicated. P < 0.05 was considered significant. Normal
distribution of the data was checked with the Kolmogorov–
Smirnov test.
The overall changes in cardiac output, SV, central venous
pressure and intrathoracic blood volume between the different
volemic levels for no resistor were analyzed by one-way analy-
sis of variance and the Tukey test. The overall changes in PPV
and SPV between the different volemic levels with the different
resistors in place were analyzed by two-way analysis of vari-
ance and the Tukey test. The differences in hemodynamics
and in respiratory pressures caused by the different resistors
at 30% hypovolemia were analyzed by one-way analysis of var-
iance and the Tukey test. The relation between the SV and the
SPV or PPV was analyzed by linear regression, and the sensi-
tivity and specificity were calculated by standard formulas after
inspection of the receiver operating characteristic curves (Sig-
maPlot 11.0; Systat Inc.).
Results
Hemodynamics without a resistor
The cardiac output, the SV, the central venous pressure and
the intrathoracic blood volume were significantly lower during
hypovolemia than during normovolemia, whereas there were
minor or insignificant changes between the other volemic
steps (Table 1). The SPV was similar at all volemic levels,
whereas the PPV was significantly higher at -30% hypovo-
lemia (Table 1).
Effects of resistors on airway and esophageal pressures
The airway and esophageal pressure swings were generally
higher with resistors than without a resistor (Table 2). The
transpulmonary pressure swings were somewhat higher with
the inspiratory/expiratory resistor compared with no resistor,
indicating larger tidal volumes.
Table 1
Central hemodynamics and arterial pressure variations at the four volemic levels
-30% hypovolemia 0% normovolemia +20% hypervolemia +40% hypervolemia
No resistor
Cardiac output (l/min) 3.2 ± 0.7 7.5 ± 1.6* 7.9 ± 2.0 7.7 ± 2.2
Stroke volume (ml) 24 ± 5 65 ± 11* 63 ± 10 62 ± 10
Central venous pressure (mmHg) 0 ± 2 6 ± 2* 7 ± 2* 8 ± 2*
Intrathoracic blood volume (ml) 485 ± 88 814 ± 177* 849 ± 156 924 ± 213
Central venous oxygen saturation 0.89 ± 0.05 0.99 ± 0.04* 1 ± 0.02 0.98 ± 0.04
Lactate (mmol/l) 1.2 ± 1.3 2.4 ± 1.8 1.9 ± 1.2 1.2 ± 0.8
Base excess (mmol/l) 4.1 ± 1.5 2.2 ± 1.7 2.2 ± 1.6 3.0 ± 1.9
Systolic pressure variation
No resistor (%) 5 ± 2 3 ± 2 2 ± 1 2 ± 1
Inspiratory resistor (%) 10 ± 5
†
4 ± 2* 5 ± 2 4 ± 2
Expiratory resistor (%) 11 ± 2
†
4 ± 2* 4 ± 1 3 ± 2
Inspiratory/expiratory resistor (%) 13 ± 5
†
5 ± 3* 5 ± 2 4 ± 2
Pulse pressure variation
No resistor (%) 17 ± 5 12 ± 2* 12 ± 4 12 ± 1
Inspiratory resistor (%) 25 ± 6
†
16 ± 4*
†
16 ± 6
†
15 ± 5
†
Expiratory resistor (%) 25 ± 6 13 ± 6* 12 ± 3 11 ± 3
Inspiratory/expiratory resistor (%) 26 ± 7
†
14 ± 6*
†
14 ± 5
†
13 ± 6
†
Data presented as the mean ± standard deviation. *P < 0.05 compared with the previous volemic level.
†
P < 0.05 compared with no resistor at
the same volemic level.
Available online />Page 5 of 9
(page number not for citation purposes)
Hemodynamic consequences at each volemic level of
applying the resistors
At each volemic level, the cardiac output, the SV, the mean
arterial pressure and the heart rate did not change when apply-
ing the resistors, whereas the swings in pulmonary artery
wedge pressure were slightly related to the swings in airway
pressure (R
2
= 0.12) (Table 2).
At 30% hypovolemia, as compared with no resistor, the SPV
was magnified by all resistors, whereas no changes were
found at normovolemia and at 20% and 40% hypervolemia.
The PPV was magnified by the inspiratory resistor and the
inspiratory/expiratory resistor (Table 1).
Correlations between changes in stroke volume and
systolic or pulse pressure variation using the different
resistors
The regression analyses between the change in SV and the
SPV or PPV using the different resistors are presented in
Table 3. The R
2
value was generally higher when the expiratory
resistor was applied with the highest correlation (R
2
= 0.83)
for the SPV.
Table 2
Respiratory pressures and hemodynamics at 30% hypovolemia
No resistor Inspiratory resistor Expiratory resistor Inspiratory/expiratory resistor
Airway pressure (AP)
Inspiratory (cmH
2
O) -1 ± 4 -7 ± 2* -3 ± 4 -5 ± 2*
Expiratory (cmH
2
O) 3 ± 5 1 ± 2 5 ± 2 5 ± 2
ΔAP (cmH
2
O) 4 ± 1 8 ± 1* 8 ± 2* 11 ± 4*
Esophageal pressure (EP)
Inspiratory (cmH
2
O) -4 ± 2 -9 ± 3* -6 ± 3 -8 ± 2*
Expiratory (cmH
2
O) -2 ± 1 -3 ± 3 -1 ± 2 -2 ± 3
ΔEP (cmH
2
O) 3 ± 1 6 ± 1* 5 ± 2* 6 ± 2*
Transpulmonary pressure (TP)
Inspiratory (cmH
2
O) 3 ± 4 2 ± 4 4 ± 2 3 ± 4
Expiratory (cmH
2
O) 5 ± 5 5 ± 4 6 ± 1 7 ± 3
ΔTP (cmH
2
O) 1 ± 2 3 ± 1 2 ± 1 4 ± 3*
Heart rate (/min) 130 ± 21 133 ± 12 138 ± 18 137 ± 23
Cardiac output (l/min) 3.2 ± 0.7 3.3 ± 0.4 3.3 ± 0.5 3.2 ± 0.5
Stroke volume (ml) 25 ± 5 25 ± 4 24 ± 4 24 ± 5
PAWP during inspiration (mmHg) -2 ± 5 -7 ± 4 -3 ± 4 -5 ± 3
PAWP during expiration (mmHg) 4 ± 3 6 ± 2 8 ± 2* 7 ± 2
Mean arterial pressure (mmHg) 55 ± 6 59 ± 5 60 ± 7 59 ± 5
Central venous pressure (mmHg) 0 ± 2 -1 ± 3 1 ± 3 1 ± 3
Data presented as the mean ± standard deviation. *P < 0.05 compared with no resistor. PAWP, pulmonary artery wedge pressure.
Table 3
Correlation of systolic pressure variation and pulse pressure variation versus the change in stroke volume
Systolic pressure variation Pulse pressure variation
No resistor 0.37 0.37
Inspiratory resistor 0.45 0.36
Expiratory resistor 0.83 0.52
Inspiratory/expiratory resistor 0.50 0.31
Data presented as R
2
values obtained by linear regression for systolic pressure variation or pulse pressure variation versus the increase in stroke
volume by a subsequent fluid loading with no resistor and with the inspiratory, expiratory, and inspiratory/expiratory resistors.
Critical Care Vol 13 No 2 Dahl et al.
Page 6 of 9
(page number not for citation purposes)
Performances of systolic pressure and pulse pressure
variations for each resistor
Using a 15% increase in SV as the definition of fluid respon-
siveness, the sensitivity and specificity for SPV and PPV were
as shown in Table 4. The highest sensitivity was found for the
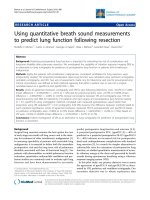
expiratory resistor. The SPV gave sensitivity and specificity of
100% for a SPV cutoff value of 7% with the expiratory resistor,
and sensitivity and specificity of 63% and 94%, respectively,
for a cutoff value of 4% without a resistor (Figures 2 and 3).
Corresponding values for the PPV were sensitivity and specif-
icity of 100% and 81%, respectively, and sensitivity and spe-
cificity of 88% and 69%, respectively, for PPV cutoff values of
16% and 13%, respectively (Figures 2 and 3).
Central venous oxygen saturation, lactate and blood
gases
The central venous oxygen saturation increased from normov-
olemia, whereas the partial arterial tension of oxygen and the
partial arterial tension of carbon dioxide (data not shown) as
well as the base excess and lactate were stable during the
experiment, with no significant changes between the volemic
levels or respiratory modes.
Discussion
We have shown in this exploratory study in spontaneously
breathing pigs that inspiratory and/or expiratory threshold
resistors magnified arterial pressure variations markedly during
hypovolemia, whereas changes in arterial pressure variations
were minor during normovolemia and hypervolemia; that the
expiratory resistor gave a better relation between the SPV or
PPV and the change in SV by subsequent fluid loading than
the inspiratory resistor or the inspiratory/expiratory resistor;
and that the SPV and PPV using the expiratory resistor pre-
dicted fluid responsiveness with good sensitivity and specifi-
city.
We manipulated the intrathoracic pressure to magnify the nor-
mal swings in arterial pressure. This concept has long been
used clinically during controlled mechanical ventilation [8-10].
The ventilator-induced cyclic changes in intrathoracic pres-
sure produce significant arterial pressure variations if the cir-
culation is fluid responsive. The tidal volume, however, has to
be above 8 ml/kg predicted body weight [17], which is higher
than recommended in critically ill, ventilated patients [18]. Fur-
thermore, the patient should have normal right heart function,
no atrial fibrillation, and no spontaneous breathing activity [8-
Figure 2
Linear regression for systolic pressure variation and pulse pressure variationLinear regression for systolic pressure variation and pulse pressure variation. Systolic pressure variation and pulse pressure variation before fluid
administration versus the change in stroke volume following fluid loading without and with the expiratory resistor. Regression lines are indicated. All
measurement points are used in the regression analyses. Horizontal lines, relevant change in stroke volume (15%); vertical lines, cutoff values used.
Available online />Page 7 of 9
(page number not for citation purposes)
10]. Indeed, if the patient is breathing in a spontaneous venti-
lator mode, the arterial pressure variations will not give any
information about fluid responsiveness [19].
In spontaneously breathing, hemodynamically unstable
patients, Soubrier and colleagues found a sensitivity and spe-
cificity for predicting the effect of a subsequent fluid adminis-
tration of 63% and 92%, respectively, for the PPV, and a
sensitivity and specificity of 47% and 92%, respectively, for
the SPV – as discussed in the accompanying editorial [20] –
agreeing well with our results without resistors. Our study
therefore confirms that arterial pressure variations during nor-
mal spontaneous breathing are not useful for fluid responsive-
ness prediction, mainly because of low sensitivity. Soubrier
and colleagues also investigated whether a forceful inspiration
and expiration (with no resistance) would improve the ability of
the SPV and the PPV to predict fluid responsiveness [21]. The
sensitivity was even lower, however, with this maneuver [21].
Indeed, we found a somewhat lower sensitivity with the expir-
atory/inspiratory resistor for SPV than with the other resistors.
In the editorial to the paper by Soubrier and colleagues, de
Backer and Pinsky discussed whether manipulation of the
intrathoracic pressure by a Valsalva maneuver – that is, a
forceful expiration against a resistance – could be used to
generate arterial pressure variations that could predict fluid
responsiveness [20]. In fact, this has now been shown in a
very recent study by Garcia and colleagues [22]. A Valsalva
maneuver causes an immediate increase in cardiac output by
squeezing blood from the pulmonary circulation to the left
heart, but this is very quickly followed by a marked reduction in
cardiac output due to reduced right heart filling [23]. As the
Valsalva maneuver may induce a pronounced drop in blood
pressure during hypovolemia, it may be difficult to perform in a
patient distressed by circulatory compromise or pain – and the
maneuver may induce changes in the heart rate. Moreover, the
Valsalva maneuver may generate quite different intrathoracic
pressures dependent on the patient's effort.
On the other hand, breathing against an expiratory resistance
could be considered to give short, intermittent Valsalva
maneuvers. This will cyclically reduce right heart filling and
induce variations in arterial blood pressure that theoretically
would be more pronounced when the circulation is fluid
responsive. Indeed, in our study when using the expiratory
resistor, the SPV was markedly enhanced during hypovolemia
and became normalized during normovolemia; in addition, the
SPV and the PPV could be used to predict fluid responsive-
ness. The minor difference in performance between the PPV
and the SPV in our study is probably due to differences in
obtaining these variables. The PPV was obtained from the
PiCCO device and the SPV was obtained manually from the
pressure tracings (see Calculations).
The inspiratory resistor and the inspiratory/expiratory resistor
did also magnify the arterial pressure variations. Both of these
resistors, however, gave inferior precision for fluid responsive-
ness prediction compared with the expiratory resistor. An
explanation could be the different changes in intrathoracic
pressures induced by the resistors; the expiratory resistor
mainly increases the intrathoracic pressure during expiration,
whereas the inspiratory resistor decreases the intrathoracic
pressure during inspiration (Table 2). This decrease in the
inspiratory intrathoracic pressure decreases left heart filling by
reducing the pressure difference between the pulmonary ves-
sels and the left atrium (as reflected in the markedly negative
inspiratory pulmonary artery wedge pressure; Table 2), but
simultaneously it improves right heart filling and thus, some
beats afterwards, improves the left heart filling and the SV.
Because of anatomical reasons the caval veins should be
more affected by the pleural pressure than by the airway or the
transpulmonary pressures, and thus the right heart filling
should be dependent on the difference between the vein pres-
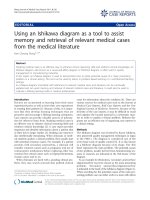
Figure 3
Receiver operating characteristic curves for systolic pressure variation and pulse pressure variationReceiver operating characteristic curves for systolic pressure variation
and pulse pressure variation. Receiver operating characteristic curves
for (a), (b) systolic pressure variation and (c), (d) pulse pressure varia-
tion, with the four different respiratory interventions, for predicting a
15% increase in stroke volume by subsequent fluid loading. SPV 0,
systolic pressure variation with no resistor; SPV I, systolic pressure var-
iation with the inspiratory resistor; SPV E, systolic pressure variation
with the expiratory resistor; SPV I/E, systolic pressure variation with the
combined inspiratory and expiratory resistor; PPV 0, pulse pressure var-
iation with no resistor; PPV I, pulse pressure variation with the inspira-
tory resistor; PPV E, pulse pressure variation with the expiratory
resistor; PPV I/E, pulse pressure variation with the combined inspiratory
and expiratory resistor; AUC, area under the curve.
Critical Care Vol 13 No 2 Dahl et al.
Page 8 of 9
(page number not for citation purposes)
sure and the pleural (esophageal) pressure. In fact, the inspir-
atory resistor reduced the inspiratory esophageal pressure
and theoretically improved the right heart filling, whereas the
expiratory device increased the expiratory esophageal pres-
sure and theoretically reduced the right heart filling. The inspir-
atory/expiratory device had a combined effect.
The difference between the inspiratory and inspiratory/expira-
tory resistors could therefore be explained by the Frank–Star-
ling heart function curve. With an expiratory resistor the filling
becomes lower, causing the heart function to work on the
steeper left part of the curve; whereas an inspiratory resistor
improves filling, causing the heart function to work on the right
less steep part of the curve. This would make the pressure var-
iations with the expiratory resistor somewhat higher than with
the inspiratory resistor, and the signal would be more pro-
nounced. According to this reasoning, the inspiratory/expira-
tory resistor – making the heart work on a wider part of the
Frank–Starling curve – would give highest pressure variations,
agreeing with our result.
Inspiratory resistors have been found to improve cardiac out-
put in experimental settings of hypovolemia [24,25]. We could
not confirm this finding. The resistance level used in our study,
however, was less than in the studies investigating the effect
on cardiac output by inspiratory threshold resistors [24,25].
The use of an expiratory resistor connected to a nose–mouth
mask is feasible in the clinic. It is used commonly for breathing
physiotherapy in patients in the intensive care unit and in
patients before and after surgery [26].
Our study has several limitations and caution should therefore
be taken when translating the results to patients. First, we
studied a limited number of young healthy animals with normal
heart function and with no arrhythmias. Second, because we
did not a priori know the effect on the arterial pressure varia-
tions by hypovolemia and volume challenges, both the hypov-
olemic level and the volume challenges were substantial and,
furthermore, two different volume challenges were used. Third,
the level of expiratory resistance used might not be optimal in
patients. We chose these resistors because 5 to 10 cmH
2
O
is commonly used as expiratory impedance clinically (for exam-
ple, for positive end-expiratory pressure or continuous positive
airway pressure) and are accepted by most patients. Fourth,
some values used in the receiver operating characteristic and
linear regression analyses were dependent, making these
analyses less strong.
Conclusions
The present exploratory animal study shows that arterial pres-
sure variations predict fluid responsiveness during spontane-
ous breathing with an expiratory resistor.
Competing interests
The authors declare that they have no competing interests.
Authors' contributions
MKD and AL participated in the design, laboratory work, data
analyses and writing of the manuscript. STV, JK-N participated
in the design, the laboratory work and in the finalizing of the
manuscript.
References
1. Magder S: Predicting volume responsiveness in spontane-
ously breathing patients: still a challenging problem. Crit Care
2006, 10:165.
Key messages
• Using an expiratory resistor, fluid responsiveness can
be predicted by assessment of arterial pressure varia-
tions during spontaneous breathing.
Table 4
Sensitivity, specificity, positive and negative predictive values for the pressure variations with different respiratory interventions
Sensitivity (%) Specificity (%) Positive predictive value (%) Negative predictive value (%)
Systolic pressure variation
No resistor 63 94 83 83
Inspiratory resistor 88 88 78 93
Expiratory resistor 100 100 100 100
Inspiratory/expiratory resistor 75 94 86 88
Pulse pressure variation
No resistor 88 69 58 92
Inspiratory resistor 88 69 58 92
Expiratory resistor 100 81 73 100
Inspiratory/expiratory resistor 88 94 88 94
Available online />Page 9 of 9
(page number not for citation purposes)
2. Coudray A, Romand J-A, Treggiari M, Bendjelid K: Fluid respon-
siveness in spontaneously breathing patients: a review of
indexes used in intensive care. Crit Care Med 2005,
33:2757-2762.
3. Knopp R, Claypool R, Leonardi D: Use of the tilt test in measur-
ing acute blood loss. Ann Emerg Med 1980, 9:72-75.
4. Monnet X, Rienzo M, Osman D, Anguel N, Richard C, Pinsky MR,
Teboul JL: Passive leg raising predicts fluid responsiveness in
the critically ill. Crit Care Med 2006, 34:1402-1407.
5. Teboul J-L, Monnet X: Prediction of volume responsiveness in
critically ill patients with spontaneous breathing activity. Curr
Opin Crit Care 2008, 14:334-339.
6. Marik PE, Baram M, Vahid B: Does central venous pressure pre-
dict fluid responsiveness? A systematic review of the litera-
ture and the tale of seven mares. Chest 2008, 134:172-178.
7. Michard F, Teboul JL: Predicting fluid responsiveness in ICU
patients. A critical analysis of the evidence. Chest 2002,
121:2000-2008.
8. Bendjelid K, Romand JA: Fluid responsiveness in mechanically
ventilated patients: a review of indices used in intensive care.
Intensive Care Med 2003, 29:352-360.
9. Michard F: Changes in arterial pressure during mechanical
ventilation. Anesthesiology 2005, 103:419-428.
10. Perel A: Assessing fluid responsiveness by the systolic pres-
sure variation in mechanically ventilated patients. Systolic
pressure variation as a guide to fluid therapy in patients with
sepsis-induced hypotension. Anesthesiology 1998,
89:1309-1310.
11. Dornhorst AC, Howard P, Leathart GL: Pulsus paradoxus. Lan-
cet 1952, 1:746-748.
12. Cohn JN, Pinkerson AL, Tristani FE: Mechanism of pulsus para-
doxus in clinical shock. J Clin Invest 1967, 46:1744-1755.
13. Ingimarsson J, Thorsteinsson A, Larsson A, Werner O: Lung and
chest wall mechanics in anesthetized children.
Am J Respir
Crit Care Med 2000, 162:412-417.
14. von Englehardt W: Swine cardiovascular physiology: a review.
In Swine in Biomedical Research Edited by: Bustad LK, Mclellan
RO. Seattle, WA: Frayn; 1966:307-329.
15. Lambert P, Sloth E, Smith B, Hansen LK, Koefoed-Nielsen J, Tøn-
nesen E, Larsson A: Does a positive end-expiratory pressure-
induced reduction in troke volume indicate preload respon-
siveness? An experimental study. Acta Anaesthesiol Scand
2007, 51:415-425.
16. Michard F, Boussat S, Chemla D, Anguel N, Mercat A, Lecarpen-
tier Y, Richard C, Pinsky MR, Teboul J-L: Relation between respi-
ratory changes in arterial pulse pressure and fluid
responsiveness in septic patients with acute circulatory fail-
ure. Am J Respir Crit Care Med 2000, 162:134-138.
17. De Backer D, Heenen S, Piagnerelli M, Koch M, Vincent JL: Pulse
pressure variations to predict fluid responsiveness: influence
of tidal volume. Intensive Care Med 2005, 31:517-523.
18. Girard TD, Bernard GR: Mechanical ventilation in ARDS: a
state-of-the-art review. Chest 2007, 131:921-929.
19. Heenen S, De Backer D, Vincent J-L: How can the response to
volume expansion in patients with spontaneous respiratory
movements be predicted? Crit Care 2006, 10:R102.
20. de Backer D, Pinsky MR: Can one predict fluid responsiveness
in spontaneously breathing patients? Intensive Care Med
2007, 33:1111-1117.
21. Soubrier S, Saulnier F, Hubert H, Delour P, Lenci H, Onimus T,
Nseir S, Durocher A: Can dynamic indicators help the predic-
tion of fluid responsiveness in spontaneously breathing criti-
cally ill patients? Intensive Care Med 2007, 33:1117-1124.
22. Garcia MIM, Cano AG, Monrové JC: Arterial pressure changes
during the Valsalva maneuver to predict fluid responsiveness
in spontaneously breathing patients. Intensive Care Med 2009,
35:77-84.
23. Zema MJ, Restivo B, Sos T, Sniderman KW, Kline S: Left ventricu-
lar dysfunction bedside Valsalva manoeuvre. Br Heart J 1980,
44:560-569.
24. Lurie KG, Zielinski TM, Scott H, McKnite BS, Idris AH, Yannopou-
los D, Raedler CM, Sigurdsson G, Benditt DG, Voelckel WG:
Treatment of hypotension in pigs with an inspiratory imped-
ance threshold device: a feasibility study. Crit Care Med 2004,
32:1555-1562.
25. Yannopoulos D, McKnite S, Metzger A, Lurie KG: Intrathoracic
pressure regulation improves 24-hour survival in a porcine
model of hypovolemic shock. Anesth Analg 2007,
104:157-162.
26. Westerdahl E, Lindmark B, Almgren SO, Tenling A: Chest physi-
otherapy after coronary artery bypass graft surgery – a com-
parison of three different deep breathing techniques. J
Rehabil Med 2001, 33:79-84.