Báo cáo y học: "Disruption of cell wall fatty acid biosynthesis in Mycobacterium tuberculosis using a graph theoretic approach" pptx
Bạn đang xem bản rút gọn của tài liệu. Xem và tải ngay bản đầy đủ của tài liệu tại đây (2.2 MB, 13 trang )
RESEARC H Open Access
Disruption of cell wall fatty acid biosynthesis in
Mycobacterium tuberculosis using a graph
theoretic approach
Veeky Baths
1*
, Utpal Roy
1
and Tarkeshwar Singh
2
* Correspondence:
1
Department of Biological Sciences,
Birla Institute of Technology &
Science (BITS) Pilani K K BIRLA Goa
Campus, Goa 403 726, India
Full list of author information is
available at the end of the article
Abstract
Fatty acid biosynthesis of Mycobacterium tuberculosis was analyzed using graph
theory and influential (impacting) proteins were identified. The graphs (digraphs)
representing this biological network provide information concerning the connectivity
of each protein or metabolite in a given pathway, providing an insight into the
importance of various components in the pathway, and this can be quantitatively
analyzed. Using a graph theoretic algorithm, the most influential set of proteins (sets
of {1, 2, 3}, etc.), which when eliminated could cause a significant impact on the
biosynthetic pathway, were identified. This set of proteins could serve as drug
targets. In the present study, the metabolic network of Mycobacterium tuberculosis
was constructed and the fatty acid biosynthesis pathway was analyzed for potential
drug targeting. The metabolic network was constructed using the KEGG LIGAND
database and subjected to graph theoretical analysis. The nearness index of a protein
was used to determine the influence of the said protein on other components in the
network, allowing the proteins in a pathway to be ordered according to their
nearness indices. A method for identifying the most strategic nodes to target for
disrupting the metabolic networks is proposed, aiding the development of new
drugs to combat this deadly disease.
Background
Thecompletegenomesequenceofthebest-characterizedstrainofMycobacterium
tuberculosis, H37Rv, has been determined and analyzed, improving understanding of
the biology of this slow-growing pathogen and aiding the development of new prophy-
lactic and therapeutic interventions [1]. The genome information concerning the
H37Rv strain was used in this study.
Graph representation of the entire metabolism of the bacterium demonstrates the
variousclustersofproteinsandtheirconnectivity [2]. Furthermore, analyzing a well-
connected cluster of proteins linked to several pathways enables the specific pathway
concerned with mycolic acid synthesis to be targeted [3]. The bacterium possesses a
thick layer of lipid on the outer surf ace that protects it from noxious chemicals and
the host’s immune system [3]; these lipids are also present in the Corynebacterium-
Mycobacterium-Nocardia group. They give rise to important characteristics including
resistance to chemical injury and dehydration, low permeability to antibiotics, viru-
lence, acid-fast staining and the ability to persist within a host. Mycolic acids are the
Baths et al. Theoretical Biology and Medical Modelling 2011, 8:5
/>© 2011 Baths et al; licensee BioMed Central Ltd. This is an Open Acc ess a rticle distributed under the terms of the Cre ative C ommons
Attribution License ( which permits unre stricted use, distribution, and reproduction in
any medium, provided the original work is properly cited.
major constituents of this protective layer [4] and they play important roles as struc-
tural components of the cell wall and envelope [5]. In p articular, the cyclopropane
rings of mycolic acids in M. tubercul osis contribute to the structural integrity of the
cell wall complex and protect the bacillus from oxidative stress (hydrogen peroxide)
[3]. The lack of drug compliance, the appearance of multi-drug-resistant strains and
the AIDS epidemic are factors that have led to a resurgence of tuberculosis infection.
Drug resistance follows inadequate compliance, and AIDS patients with a weakened
immunesystemareverysusceptibletoM. tuberculosis and it is a common cause of
death [3].
Various grap h theory approaches have been used to analyze metabo lism in bacteria.
In the present study, construction of a metabolome-based reaction network of Myco-
bacterium tuberculosis was attempted using the KEGG LIGAND database, and graph
spectral analysis of the network was carried out to identify hubs and the sub-clustering
of reactions. Another approach used for drug targeting was the identification of t he
‘load points’ and ‘ choke points’ in metabolic networks (graphs representing metabo-
lism). In order to identify potential drug targets (based on the biochemical lethali ty of
metab olic networks), the concept of choke points and load points was used to identify
enzymes (edges) that uniquely consume or produce a particular metabolite (node) [6].
Complete genome sequences describe the range of metabolic reactions possible for an
organism, but they cannot quantitatively describe the behavior of these reactions. In
this study, a novel method for modeling metabolic states using whole cell measure-
ments of gene expression is presented. The method, called E-Flux (a combination of
Flux and Expression), extends the technique o f Flux Balance Analysis by modeling
maximum flux constraints as a function of measured gene expression [7].
Methods
A Graph Theoretic Approach
An ordered pair G = (V, E), where V is a non-empty set whose elements are called
vertices (nodes or points), and E is a set of two distinct elements that are a subset of
V, whose elements are called edges (links or li nes) [8]. Furthermore, a graph G is said
to be fini te if V is finite, otherwise it is termed infinite. Two vertices, u and v, are said
to be adjacent in G if u and v are joined by an edge, otherwis e they are non-adjacent.
An edge e and a vertex u are said to be incident if u is one of the end vertices of the
edge e. Two edges, e
1
and e
2
, are said to be adjacent if both have the same end ver-
tices. The cardinality of V is denoted by |V| = p: = number of vertices in V, is called
the order of the graph G. Similarly, the cardinality of E i.e. |E| = q is called the size of
G. The graph can be represented using diagrams and matrice s. On t he basis of adja-
cency and incidence relationships among edges and vertices, adjacency and incidence
matrices can be determined [8].
The adjacency matrix of a graph G, with vertex set V = {v
1
,v
2
, ,v
p
}, is denoted A(G)
=[a
i,j
]
p×p
,wherea
i,j
= 1 if there is an edge between v
i
to v
j
and 0 otherwise. It is a
binary (0, 1) - square symmetric matrix. The incidence matrix of a graph G is denoted
I(G)=[b
i, j
]
p×q
,whereb
i, j
=1ife
i
is incident to v
i
, and 0 otherwise. A graph H =
(V
1
,E
1
) is said to be a sub-graph of the graph G = (V, E) if V
1
is a subset of V and E
1
is a subset o f E. When V
1
= V then the sub-graph H is termed a spanning sub-graph
of G. A directed graph (digraph in short) D i s an ordered pair D = (V, A), where V is
Baths et al. Theoretical Biology and Medical Modelling 2011, 8:5
/>Page 2 of 13
known as a vertex set of D and A is an ordered pair of two distinct elements of V,
known as an arc set of D. The order and size of a digraph D is the number of vertices
and arcs in D, respectively. In a digraph, if there is an arc a = (u, v), then u is the
initial vertex and v is the terminal vertex of the arc a. A graph G is said to be con-
nected if one vertex can be reached from another vertex by a path (alternating
sequence of vertices and edges, i.e. u = u
0
,e
0
,u
1
,e
1
,u
2
, , u
n-1
,e
n-1
,u
n
= v), otherwise
it is considered to be disconnected.
A digraph is said to be strongly connected if a vertex of D can be reached from other
vertices of D by a directed path. A digraph D is said to be weakly connected if its under-
lying graph (undirected graph) is connected. Deletion of a vertex v from the digraph D
(graph G) refers to the removal of a vertex v from V and all arc s (edges) for which v is
either the in itial vertex or the terminal vertex of an arc in D. Deletion of an arc (edge)
from a digraph (graph) refers to th e removal of the arc (edge) from the digraph (graph).
If S is a subset of the vertex set V of the digraph (graph), then D - S is the digraph
(graph) obtained by removing vertices of S and arcs (edges) for which one of the end
vertices are in S from the D. If there are more than two connected components, then S
is referred to as the separating set of D. Let [S, V-S] = {(u,v): u ε Sandvε V-S}; if all
arcs (edges) of [S, V-S] are removed from the digraph (graph) and the resultant digraph
(graph) is not connected, then [S, V-S] is termed an edge-cut of D.
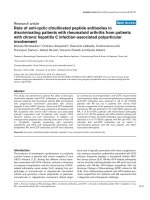
The mycolic acid network [9] was modeled using a digraph (Figure 1) in which ver-
tices represent the metabolites and reactions/interactions between any two metabolites
are represented by arcs (Figure 2). Let D = (V, A) be the digraph with vertex set V =
{v
1
,v
2
,v
3
, ,v
49
} and there are four other metabolic cycles connected to the vertices
v
1
,v
10
and v
40
of the digraph D and arc set A = {e
1
,e
2
,e
3
, ,e
80
}. By selecting the ver-
tices with maximum out-degree (i.e. number of arcs radiating from the vertex) first, a
set S = {v
11
,v
10
,v
39
,v
15
,v
19
,v
24
,v
29
,v
34
,v
46
} can be generated in D. Deleting this set
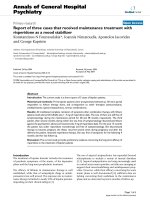
Figure 1 Fatty acid Biosynthesis (Source KEGG pathway database). Fatty Acid Synthesis Pathway in
Mycobacterium tuberculosis H37rv. The pathway was downloaded from the KEGG Database. Starting from
Acetyl-CoA at the bottom left of the figure, the metabolites are numbered left to right and then bottom
to top.
Baths et al. Theoretical Biology and Medical Modelling 2011, 8:5
/>Page 3 of 13
S from the digraph D refers to deleting all the vertices of S from D and arcs that have
one end vertex in S. Let D* = (V*, A*) be the resultant digraph obtained, where V* =
V-S and A* is the set of all arcs remaining in A, which has more than four compo-
nents in D*, a disconnected digraph.
Determination of nearness index
The nearness index for a vertex (protein) is the sum of all the inverses of the mini-
mum path lengths to every other vertex in the graph [2]. For a particular vertex v
i
,the
eccentricity of v
i
is the length of the path from the farthest vertex in the graph and
would contribute least to the nearness index of v
i
because the inverse of the path
length is added equivalently; vertices with more eccentricity have a lower nearness
index. If the degree of vertex v
i
(i
th
vertex of given graph G) is denoted by d
i
, then the
nearness index of v
i
is given by:
N
i
=
(
1/d
i
)
The data were parsed using a java program that uses the list of minimum path
lengths (obtained from visANT) as the input.
Results
Data for assessing the pathway are available in the KEGG (Kyoto Encyclopedia of
Genes and Genomes) pathway database and were used to obtain a flowchart of the
fatty acid biosynthesis pathway of Mycobacterium tuberculosis H37Rv. The green
squares in the flowchart (Figure 1) represent proteins identified from the genome
sequence of the bacterium. The genome sequence for this bacterium is complete.
Therefore, the information concerning the participating proteins is also complete [10].
Figure 2 Fatty acid Biosynthes is modeled using Graph.(Vertexv
3
corresponds to Acetyl- [acp], Vertex
v
10
corresponds to Malonyl-CoA and Vertex v
11
corresponds to Malonyl-[acp]). Blue boxes correspond to
other pathways.
Baths et al. Theoretical Biology and Medical Modelling 2011, 8:5
/>Page 4 of 13
The proteins involved in the mycolic acid biosynthesis pathway [9] were inputted
into visANT software [11]. This free software can be used to identify interactions
between proteins and the result is displayed as a graph. visANT can be downloaded
from Programming for assessing the results was carried out using
java (version 1.6.0_01). NetBeans IDE 6.9.1 was the IDE (Integrated Development
Environment) used [12]. The name of the organism was selected and the list of pro-
teins entered in the input area provided. Clicking the search button provides the inter-
actions among the proteins given as the input. A graph is obtained and when the
layout “spring embedded” is selected, the following is produced: Figure 3.
visANT represents proteins as vertices and t he interactions between them as edges.
Therefo re, an undirected graph of the interactions of proteins involved in the fatty acid
biosynthesis pathway is obtained. The graph is not directed as demonstrated in Figure 4.
This result as shown in Figure 5. can be stored in a text file and parsed to obtain the
path distance (starting protein and the ending protein). For example, for the line
Shortest path (2)::RV1384-RV2967C-RV0263C, the shortest path from protein RV1384
to protein RV0263C, is of length 2. This datum can be used to obtain the degree of
each vertex. Therefore, when all the degrees have been determined, the amount of
influence a protein possesses, using the concept of nearness index, can be calculated.
Nearness index
The nearest vertex (with sma ll ecentricity) would contribute most to the nearness
index. Therefore, when calculatin g the nearness inde x, all the vertices of the graph
were taken into account as were their differing levels of influence. The total sum repre-
sents the influence of the protein represented by v
i
on the compl ete pathway, which is
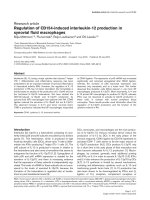
Figure 3 Protein interaction network. Nodes have been colour coded and proteins which are closer
are clustered together.
Baths et al. Theoretical Biology and Medical Modelling 2011, 8:5
/>Page 5 of 13
Figure 4 Protein network demonstrating dense inter-connectivity . visANT possesses a tool to identify
the shortest paths between all the pairs of vertices in a graph. Selecting all the vertices of this small graph
identifies the shortest paths. The shortest paths are given in the following format:
Figure 5 Shortest Pathway analysis. The shortest paths between al l the pairs of ver tices in a graph
(Source: visANT).
Baths et al. Theoretical Biology and Medical Modelling 2011, 8:5
/>Page 6 of 13
represented as a graph. Another interaction between proteins concerns one protein
helping in the production of a metabolite, which is converted to another metabolite by
a second protein (2). In this case, the first protein influences the second protein. The
second protein relies o n the first protein functioning so that it obtains the metabolites.
The graph obtained from protein-pro tein influencesofthiskindwillbeadirected
graph. Reversible reactions are represented as edges to and from the two proteins.
From this, the influence of each protein can be estimated by calculating its nearness
index (Table 1). The result of shortest paths obtained from visANT can be copied and
stored in a file called shortpath,whichisgivenasanargumentforrunningthejava
program. A java code like that shown below was written to calculate the nearness
index with the file shortpath as the input.
package nearnessindex;
import java.util.Scanner;
import java.util.regex .*;
import java.io.*;
/**
*
* @author Veeky
*/
public class Main {
static double i,iT=0;
static String p1=“”,p2=“”,pT=“”, topper;
public static void main(String[] args){
//calculate nearness Index!
try{
PrintStream out = new PrintStream(new FileOutputStream(“indices”));
System.setOut(out);
Scanner s = new Scanner(new File(args[0]));
Table 1 Protein nearness index
Protein N
i
(Nearness Index)
RV2501C 15
RV2967C 15
RV0973C 15
Rv3285 14.5
RV0263C 12
RV3280 11.5
RV2502C 11.5
RV3799C 11.5
RV0974C 11.5
RV2247 11.5
RV2888C 10
RV3375 10
RV3011C 10
RV1263 10
RV2363 10
RV1384 9
Baths et al. Theoretical Biology and Medical Modelling 2011, 8:5
/>Page 7 of 13
while (s.hasNextLine()) {
s.findInLine(“Shortest path\\((\\d+)\\)::(\\w+).*-(\\w+)”);//at each line, look
for this pattern
MatchResult result = s.match();//results from
if ((p1.equals( result.group(2)))&&(!p2.equals(result.group(3)))) {
i = i +(1/Double.parseDouble(result.group(1)));
p2 = result.group(3);
}
else if (!p1.equals(result.group(2))) {
if (!p1.equals(“”)) {
out.println(p1 + “: “ + i);
if (iT<i){
topper = p1;//to pper is the string that would hold th e proteins with
highest nearness index
iT = i;
}
else if (iT==i){
topper = topper + “, “ + p1;
}
}
i =(1
/Double.parseDouble(result.group(1)));
p1 = result.group(2);
p2 = result.group(3);
}
s.nextLine();
}
out.println(p1 + “: “ + i);
out.println(“Protein(s)
with highest nearness index (” + iT + “): “ + topper);
s.close();
out.close();
}
catch (FileNotFoundException e){
System.out.print(“cannot find file”);
}
}
}
Computation of nearness index with Java code
In the main method of the program, a new PrintStream object was used to print to an
output file called indices.Ascanner object was used to read from the input file, short-
path, line by line. A while loop was used to check if shortpath was read up t o the last
line.
Inside the while loop, for each line a regex function (Shortest path\\((\\d+)\\)::(\\w+).
*-(\\w+)) was used to identify the starting protein of the path, the ending protein and
the path length. For instance, for the line Shortest path(2)::RV1384-RV2967C-
RV0263C,wewouldobtaintheresultgroup(1)as2,resultgroup(2)asRV1384and
Baths et al. Theoretical Biology and Medical Modelling 2011, 8:5
/>Page 8 of 13
result group(3) as RV0263C. The shortest paths from each protein were calculated and
according to the formula for the nearness index, the inverses of the s hortest path
length could be added. Redundant data concer ning the various paths from one protein
to another were discarded:
Shortest path(2)::RV2380C-RV2246-RV0099
Shortest path(2)::RV2380C-RV2245-RV0099
Shortest path(2)::RV2380C-RV1454C-RV0099
Shortest path(2)::RV2380C-RV0149-RV0099
Shortest path(2)::RV2380C-RV2381C-RV0099
Therefo re, only one of these paths was considered as they were all considered to be
the shortest.
Using visANT, the shortest path from each protein in to all the other proteins (of
the form Shortest path(2)::RV1384-RV2967C-RV0263 C) were obtained. This shortest
path was use d as an input for the java program to calculate the nearness index pre-
sented in Table 1.
The proteins in Figure 6 with the highest nearness index of 15 were RV2501C,
RV2967C and RV0973C. According to computational factors (namely domain fusion,
gene neighborhood and phylogenetic profiling), these were the most influential pro-
teins in this particular sub-graph. Among these proteins, RV2501C is directly involved
in the fatty acid biosynthesis.
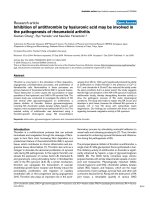
For the largest sub-graph (Figure 7), the proteins with the largest nearness index of
104.4167 were RV2524C (FAS), RV2245 and RV2246. Of these proteins, FAS is directly
involved in the pathway as shown in Table 2.
Discussion
One of the pathways of Mycobacterium tuberculosis con cerns fatty acid biosynthesis,
and contributes to the synthesis of mycolic acid. The outer lipid layer (cell wall) of the
bacterium makes it difficult for broad spectrum antibiotics to have any effect [4], and a
major component of the cell wall is mycolic acid. Therefore, when synthesis of mycolic
acid is reduced, broad spectrum antibiotics would be more effective owing to cell wall
Figure 6 Protein networks and their interactions (Source: visANT).
Baths et al. Theoretical Biology and Medical Modelling 2011, 8:5
/>Page 9 of 13
damage. Mycolic acid synthesis is the target of well-known anti-tuberculosis drugs
including isoniazid, ethionamide and thiocarlide[9].Thissuggeststhatanyreactions
that contribute to synthesis and processing of mycolic acids are viable targets for new
drug discovery. visANT represents proteins as vertices and the interactions between
them as edges, and there are various i nteractions between proteins involved in t he
fatty acid biosynthesis pathway.
Ranking proteins by the topological properties of the human protein-protein interac-
tion net-work is one strategy for drug-target identification [13]. Another approach
characterizes the interaction properties in protein-protein complexes; for example,
identifying the domains involved in binding or analyzing the 3D structure. Comparison
of domain-domain interactions and interfaces across an interactome can identify selec-
tive drug ta rget s or d rugs targetin g multiple proteins (to block parallel pathways in a
network) [14]. Structural analysis can be carried out to identify pockets where drugs
could bind and to compare their properties with binding pockets on other prot eins in
the network [15].
The shortest and alternate paths in the reaction networks were examined. In an ear-
lier study, sub-cluster profiling demonstrated that reactions in the mycolic acid p ath-
wayofmycobacteriaformatightly connected sub-cluster. Identification of hubs
rev ealed tha t reactio ns involving glutamate were central to mycobacterial metabolism,
and those involving pyruvate were at the centre of the E. coli metabolome. The analysis
of shortest paths between reactions has revealed several paths that a re shorter than
well-established pathways. Using a dir ected graph to represent pathways would enable
researchers to determine the importance of various proteins in a pathway and how
their removal would affect that pathway [11].
The graph nodes represent metabolites and the edges represent enzymes. Based on
an extended form of the graph theory model of metabolic networks, metabolite
Figure 7 The largest sub-graph. This graph was used to calculate the nearness index of proteins.
Baths et al. Theoretical Biology and Medical Modelling 2011, 8:5
/>Page 10 of 13
structural informatio n was used to calculate the k-shortest paths between metabolites
(the presence of more than one competing path between substrate and product). On
the basis of these paths and connectivity information, load points were calculated and
used empirically to rank the importance of metabolites/enzymes in the metabolic
Table 2 Nearness Index For the largest sub-graph
Protein N
i
(Nearness
Index)
Protein N
i
(Nearness
Index)
Protein N
i
(Nearness
Index)
RV2524C 104.4167 RV3826 75.25 RV0533C 60.85
RV2245 101.4167 RV1925 74.75 RV1108C 60.35
RV2246 100.9167 RV2941 74.75 RV3246C 59.35
RV2048C 91.25 RV0166 74.75 RV2884 59.35
RV2935 91.25 RV3801C 74.75 RV3765C 59.35
RV2934 91.25 RV1427C 74.75 RV0903C 59.35
RV2933 91.25 RV1058 74.75 RV0491 59.35
RV2932 91.25 RV3515C 74.75 RV1027C 59.35
RV2931 91.25 RV1206 74.75 RV0981 59.35
RV3825C 91.25 RV2383C 74.68333 RV0757 59.35
RV2940C 91.25 RV3561 72.25 RV0602C 59.35
RV3800C 91.25 RV1185C 71.75 RV1033C 59.35
RV1181 91.25 RV2948C 71.75 RV0818 59.35
RV0405 91.25 RV2930 71.75 RV2783C 58.68333
RV1527C 91.25 RV0035 71.75 RV2727C 58.68333
RV1664 91.25 RV2950C 71.75 RV3907C 58.18333
RV1662 91.25 RV1193
71.75 RV3105C 58.18333
RV1661 91.25 RV0404 71.75 RV1630 58.18333
RV2381C 90.75 RV1013 71.75 RV2539C 56.85
RV2048C_1
2 90.75 RV3667 71.68333 RV3607C 56.35
RV2946C 90.75 RV2590 71.68333 RV1409 56.35
RV2382C 89.08333 RV2505C 71.25 RV2244 54.18333
RV2947C 89.08333 RV3506 71.25 RV2214C 54.08333
RV1180 89.08333 RV1750C 71.25 RV3389C 53.08333
RV1483 87.33333 RV0542C 71.25 RV3538 53.08333
RV1663 86.18333 RV0551C 71.25 RV1938 51.75
RV3141 84.68333 RV1345 71.25 RV3617 51.75
RV3777 84.68333 RV2384 70.18333 RV0134 51.75
RV0149 84.68333 RV2380C 69.68333 ACCD3 47.33333
RV1454C 84.68333 RV0101 69.68333 RV0769 39.78333
RV1912C 84.68333 RV3513C 68.75 RV3559C 39.78333
RV2048C_11 80.18333 RV2187 68.68333 RV0242C 39.78333
RV0099 77.25 RV1550 68.68333 RV3502C 36.61667
RV0214 77.25
RV2379C 66.68333 RV1350 36.61667
RV1529 76.75 fabd 64.85 RV0768 28.93333
RV3089 76.25 RV2457C 63.85 RV0241C 28.93333
RV0270 76.25 RV3606C 63.35 RV3560C 28.93333
RV0119 76.25 RV1629 63.35
RV1521 76.25 RV1018C 60.85
Baths et
al. Theoretical Biology and Medical Modelling 2011, 8:5
/>Page 11 of 13
network. The load point analysis emphasized the role that the biochemical structure of
a metabolite, rather than its connectivity (hubs), plays in the conversion pathway.
Conclusions and scope
The graph of the fatty acid biosynthesis of Mycobacteri um tuberculosis H37Rv had two
major sub-graphs. The largest sub-graph had greater influence and its proteins would
be better drug targets than the smaller sub-graph. When analyzed, this large sub-graph
demonstrated that the protein that most influe nces the pathway is FAS (Fatty Acid
Synthase).
As demonstrated in Figure 2, the nearness indices of the proteins involved in the
digraph can be determined. This process can be carried out on the directed graph
obtained from protein dependences based on metabolites. For this, using visANT
would require a line of input for each edge and this would be a cumbersome task.
Therefore, alternative software such as Cytoscape is utilized. The KEGGraph library of
R language provided by Bioconductor can be used to assess KEGG pathways in the
form of graphs. This library takes KGML data for a given pathway and parses it to pro-
vide graphs. Using the resources available through visANT, t he data of any biological
pathway that is present in the KEGG database ca n be analyzed, and using a simple
java program the most influential proteins in the pathway can be identified in silico.
Acknowledgements
We would like to thank our host organization Bits-Pilani K.K.Birla Goa Campus for providing us facilities and resources
for carrying out this research.
Author details
1
Department of Biological Sciences, Birla Institute of Technology & Science (BITS) Pilani K K BIRLA Goa Campus, Goa
403 726, India.
2
Department of Mathematics, Birla Institute of Technology & Science (BITS) Pilani K K BIRLA Goa
Campus, Goa 403 726, India.
Authors’ contributions
VB contributed in pathway modelling, programming and applying graphs in biology. UR analysed the biological data.
TK was involved in applying graph theoretic approach. All authors read and approved the final manuscript.
Competing interests
The authors declare that they have no competing interests.
Received: 6 January 2011 Accepted: 31 March 2011 Published: 31 March 2011
References
1. Cole ST, Brosch R, Parkhill J, Garnier T, Churcher C, Harris D, Gordon SV, Eiglmeier K, Gas S, Barry CE, Tekaia F, Badcock K,
Basham D, Brown D, Chillingworth T, Connor R, Davies R, Devlin K, Feltwell T, Gentles S, Hamlin N, Holroyd S,
Hornsby T, Jagels K, Krogh A, McLean J, Moule S, Murphy L, Oliver K, Osborne J, Quail MA, Rajandream MA, Rogers J,
Rutter S, Seeger K, Skelton J, Squares R, Squares S, Sulston JE, Taylor K, Whitehead S, Barrell BG: Deciphering the
biology of Micobacterium tuberculosis from the complete genome sequence. Nature 1998, 393:537-544.
2. Karthik R, Vashisht R, Nagasuma C: Strategies for efficient disruption of metabolism in Mycobaterium Tuberculosis
from network analysis. Mol BioSyst 2009, 5:1740-1751.
3. Colijn C, Brandes A, Zucker J: Interpreting expression data with metabolic flux models: predicting Mycobacterium
tuberculosis mycolic acid production. PLoS Comput Biol 2009, 5(8):e1000489.
4. Winder FG: Mode of action of the antimycobacterial agents and associated aspects of the molecular biology of the
mycobactria. In The biology of the mycobacteria, Physiology, identification and classification. Volume 1. Academic Press, N.
Y; 1982:353-438.
5. Takayama K, Wang C, Gurdyal SB: Pathway to Synthesis and Processing of Mycolic Acids in Mycobacterium
tuberculosis. Clinic Microbiol Rev 2005, 18:81-101.
6. Syed AR, Schomburg D: Observing local and global properties of metabolic pathways: ‘load points’ and ‘choke
points’ in the metabolic networks. Bioinformatics 2006, 22:1767-1774.
7. Yuan Y, Zhu Y, Crane D, Barry C: The effect of oxygenated mycolic acid composition on cell wall function and
macrophage growth in Mycobacterium tuberculosis. Mol Microbiol 1998, 29:1449-1458.
8. West DB: Introduction to Graph Theory New York: Prentice Hall Publication; 2009.
9. Karthik R, Rajagopalan P, Nagasuma C: Hallmarks of mycolic acid biosynthesis: A comparative genomics study.
Proteins 2007, 69:358-368.
Baths et al. Theoretical Biology and Medical Modelling 2011, 8:5
/>Page 12 of 13
10. The KEGG databases at GenomeNet. [ />11. Hu Z, Mellor J, Wu J, DeLisi C: VisANT: data-integrating visual framework for biological networks and modules. Nucl
Acids Res 2005, 33:W352-W357.
12. Java web applications. [ />13. Zhu M, Gao L, Li X, Liu Z, Xu C, Yan Y, Walker E, Jiang W, Su B, Chen X, Lin H: The analysis of the drug-targets based
on the topological properties in the human protein-protein interaction network. J Drug Target 2009, 17:524-532.
14. Keskin O, Gursoy A, Ma B, Nussinov R: Towards drugs targeting multiple proteins in a systems biology approach.
Curr Top Med Chem 2007, 943-951.
15. Nobuyoshi S, Kazuyoshi I, Toshiyuki T, Shizu T, Jun O, Yoshiko I, Akiko S, Atsushi T, Hideki N, Tadayuki T, Satoru K,
Yoshiyuki S, Takao I: An integrative in silico approach for discovering candidates for drug-targetable protein-protein
interactions in interactome data. BMC Pharmacol 2007, 7:10.
doi:10.1186/1742-4682-8-5
Cite this article as: Baths et al.: Disruption of cell wall fatty acid biosynthesis in Mycobacterium tuberculosis using
a graph theoretic approach. Theoretical Biology and Medical Modelling 2011 8:5.
Submit your next manuscript to BioMed Central
and take full advantage of:
• Convenient online submission
• Thorough peer review
• No space constraints or color figure charges
• Immediate publication on acceptance
• Inclusion in PubMed, CAS, Scopus and Google Scholar
• Research which is freely available for redistribution
Submit your manuscript at
www.biomedcentral.com/submit
Baths et al. Theoretical Biology and Medical Modelling 2011, 8:5
/>Page 13 of 13