Báo cáo y học: "A mathematical model of quorum sensing regulated EPS production in biofilm communities" pptx
Bạn đang xem bản rút gọn của tài liệu. Xem và tải ngay bản đầy đủ của tài liệu tại đây (906.84 KB, 29 trang )
RESEARCH Open Access
A mathematical model of quorum sensing
regulated EPS production in biofilm communities
Mallory R Frederick
1*
, Christina Kuttler
2
, Burkhard A Hense
3
and Hermann J Eberl
1*
* Correspondence:
;
1
Department of Mathematics and
Statistics, University of Guelph, 50
Stone Rd E, Guelph ON Canada
N1G 2W1
Full list of author information is
available at the end of the article
Abstract
Background: Biofilms are microbial communities encased in a layer of extracellular
polymeric substances (EPS). The EPS matrix provides several functional purposes for
the biofilm, such as protecting bacteria from environmental stresses, and providing
mechanical stability. Quorum sensing is a cell-cell communication mechanism used
by several bacterial taxa to coordinate gene expression and behaviour in groups,
based on population densities.
Model: We mathematically model quorum sensing and EPS production in a growing
biofilm under various environmental conditions, to study how a developing biofilm
impacts quorum sensing, and conversely, how a biofilm is affected by quorum
sensing-regulated EPS production. We investigate circumstances when using
quorum-sensing regulated EPS production is a beneficial strategy for biofilm cells.
Results: We find that biofilms that use quorum sensing to induce increased EPS
production do not obtain the high cell populations of low-EPS producers, but can
rapidly increase their volume to parallel high-EPS producers. Quorum sensing-
induced EPS production allows a biofilm to switch behaviours, from a colonization
mode (with an optimized growth rate), to a protection mode.
Conclusions: A biofilm will benefit from using quorum sensing-induced EPS
production if bacteria cells have the objective of acquiring a thick, protective layer of
EPS, or if they wish to clog their environment with biomass as a means of securing
nutrient supply and outcompeting other colonies in the channel, of their own or a
different species.
Background
Biofilms, quorum sensing, and EPS
Biofilms are microbial communities encased i n a layer of extracellular polymeric sub-
stances (EPS), adhered to biotic or abiotic surfaces. Bacteria preferentially reside in bio-
films, rather than in isolation as planktonic cells. In a biofilm, bacteria are protected by
the EPS matrix from external stresses, and carry out a wide range of reactions which
are relevant in many disciplines, such as environmental engineering, food processing,
and medicine [1].
Quorum sensing is generally interpreted as a cell-cell communication mechanism
used by several bacterial taxa to coordinate gene expression and behaviour in groups,
based on population densities [2]. Initially,bacteriacellsproduceandreleaselow
amounts of signalling molecules, called autoinducers (e.g., acyl-homoserine lactones
(AHL) in Gram-negative bacteria). Concurrently, the cells meas ure the environmental
Frederick et al. Theoretical Biology and Medical Modelling 2011, 8:8
/>© 2011 Frederick et al; licensee BioMed Ce ntral Ltd. This is an Open Access article distributed under the terms of the Creative
Commons Attribut ion License ( /licenses/by/2.0), which permits unrestrict ed use, distribution, and
reproduction in any medium, provided the original work is properly cited.
concentration of the autoinducer. When a critical concentration is reached, changes in
gene expressions are induced. In most bacterial autoinducer systems, the autoinducer
synthase gene itself is upregulated, initiatin g positive feedback, and the bacteria subse-
quently produce AHL molecules at an increased rate. As a number of traits in bacterial
biofilms relevant for human and plant health are regulated via autoinducers [3,4], a
comprehensive understanding of quorum sensing systems is highly desirable. EPS is
composed of organ ic molecules such as polysaccharides, proteins, and lipids. The EPS
matrix provides several functional purposes for the biofilm, such as protectin g bacteria
from environmental threats, providing mechanical stability, and degrading macromole-
cules to be used by the cells [5]. EPS is thought to indirectly stor e nutrients, which
could later be converted to an available form and used as an energy source during per-
iods of low nutrient availability [6-9].
Modelling of biofilms and quorum sensing
Biofilms are complex systems that can be viewed simultaneously as microbial ecologi-
cal communities and as mechanical objects. Traditional one-dimensional biofilm mod-
els w ere formulated as free boundary value problems of semi-linear diffusion reaction
systems (see [10]). Newer models take the spatially heterogeneous structure of biofilms
into account and are formulated as spatia lly multi-dimensional models. A host of
mathematical modelling techniques has been proposed to model biofilms, including
stochastic individual based models, stochastic cellular automata models, and a variety
of deterministic partial differential equation models. Some examples for such
approaches are: [11-25]. These models of biofilm structure are usually coupled with
diff usion-reaction model s for growth controlling substrat es such as nutrients and oxy-
gen. This le ads to hybrid models which are mathematically difficult to analy se and
often only amendable to computational simulations. In most biofilm models, EPS is
not explicitly included but implicitly subsumed in the variables that describe biomass
and biofilm structure. Some early exceptions are the one-dimensional model of [26],
the hybrid individual-continuum model of [11], the hydrogel model of [20], and the
diffusion-reaction model [27].
For our study we bui ld on the prototype biofilm model of [16], in which the biofilm
structure is described by a determinstic, density-dependent diffusion-reaction equation
with two nonlinear diffusion effects: porous medium degeneracy and a super-diffusion
singularity. This model has been extended to explicitly account for EPS in [27] based
on [26], and to model quorum sensing in [28]. In the current study, we combine both
effects.
Although the various multi-di mensional biofilm models are based on fundamentally
different assumptions, such as ecological vs. mechanical properties of biofilms, and
although they utilise different mathematical concepts, such as discrete stochastic vs
deterministic continuous descriptions, they have been shown to predict similar biofilm
structures in [10]. More recently it was formally shown that the prototype density-
dependent diffusion-reaction biofilm model, on which our study is based, can be
derived from a s patially disc rete lattice model that is related to cellular automata bio-
film models [29]. In [28], it was also shown that the same prototype density-dependent
diffusion-reaction model can likewise be derivedfromathesamehydrodynamic
description of biofilms that underlies the biofilm model introduced by [15]. Thus, the
Frederick et al. Theoretical Biology and Medical Modelling 2011, 8:8
/>Page 2 of 29
density-dependent diffusion model of biofilms can be understood as bridge between
ecological and continuum mechanical views in biofilm modelling. The idea of using
nonlinear diffusion processes, in the form of modified Cahn-Hilliard equations, to
describe the propagation of the biofilm/water interface, is also used in current, physi-
cally more involved phase field models, as introduced in [24].
Initial mathematical models of quorum sensing describe the phenomena in sus-
pended bacteria cultures [30-32]. These models focus on predicting the rapid switch in
proportions of down- and upregulated sub-populations of bacteria in a batch culture,
which is the characteristic positive-feedback feature of quorum sensing systems. Papers
[33-35] extended the work of early models to study quorum sensing in a growing bio-
film, identifying key physical kinetics parameters required for induction. More recent
models describe growth in tw o dimensions [28], and include the effects of hydrody-
namics [28,36,37]. A variety of applications motivate development of specific quorum
sensing and biofilm models. F or example, papers [34,35] determine the critical d epth
the biofilm must grow to, as a function of pH, in order for i nduction to occur. The
models of [38-40] detail biochemical pathways in quorum sensing systems, also
describing anti-quorum sensing treatments for applications in the medical field. The
role of convective and diffusive transport of signal molecules in inter-colony communi-
cation within biofilm communities is investigated in [28].
These models share a common element: autoinducer molecules (e.g., AHL) are pro-
duced by downregulated bacteria, and AHL production is greatly enhanced when the
characteristic switch (change from low to high quorum sensing activity) rapidly occurs
throughout the biofilm.
Much mathematical modelling research has been conducted to understand when bio-
films partake in quorum sensing acti vity, for example, determining population thresh-
olds [30,31], critical biofi lm depth [34,35], and the influence of the hydrodynamic and
nutritional environment [28,36,41]. There have, however, been few studies that look at
the reverse effect - the e ffect of quorum sensing induction on biofilms. Once biofilm
cells are upregulated, AHL is produced at an increased rate, but the question of
whether the biofilm behaves differently, g rows differently, or undergoes some other
functional change, remains largely unanswered.
We expand on the works of [38-40,42]. Study [42] analyzes the effectiv eness of the
modelled anti-quorum sensing therapies by comparing growth rates of the biofilms,
and states that quorum sensing activity may be detected by EPS production and asso-
ciated enhanced bi ofilm growth. Based on the findings of [43 ], it is assumed in [42]
that EPS production is regulated by quorum sensing, and models significantly
enhanced EPS production by upregulated cells. With our model, we will study in detail
how the process of quorum sensing-regulated EPS production impacts biofilm growth
and development in a two-dimensiona l patchy biofilm community with slow back-
ground flow, under various environmental conditions. Our objective is to understand
the relationship between quorum sensing, biofilm growth, and EPS production, a nd
investigate the benefits a biofilm receives by using quorum sensing-regulated EPS
production.
To validate the claim that quorum sensing controls EPS production, and to what
degree, we turn to the experimental literature. In many studies, quorum sensing has
been found to impact the quality of EPS. For example, study [44] showed differences
Frederick et al. Theoretical Biology and Medical Modelling 2011, 8:8
/>Page 3 of 29
in biofilm appearance with and without expression of the pelA gene, which is essent ial
for the production of the EPS matrix. In a later study of the quorum sensing-regulated
expression of the PelA enzyme, it was shown that pel-genes are required for EPS pro-
duction [45]. On the other hand, [46] found many factors which affect the quality of
the EPS matrix to be regulated by quorum sensing in the e arly development stage,
such as channel production within the biofilm, swarming activity, and lipid production.
Also, many studies have shown the connection between quorum sensing and mucosity
[47-49]. Quorum sensing regulates components of EPS (e.g., EPS II, polysaccharides)
which contribute to the mucosity, thus impacting the biofilm matrix. These studies
support the idea that the amount of EPS production per cell might be influenced by
quorum sensing, but do not show to what degree.
There are some examples of bacteria species, mostly plant pathogens, in which a
quantitative increase of EPS production by quorum sensing regulation has been
demonstrated. In [50], quorum sensing was found to r egulate alginate production in
Pseudomonas syringae. Alginate is an important component of EPS, and without
quorum sensing, alginate levels were 70% lower. However, the impact on biofilm thick-
ness is not described, so conclusions cannot be drawn regarding whether overall EPS is
significantly reduced by the drop in alginate levels.
In [51] it is concluded that the amount of EPS production per cell in a Pantoea
stewartii biofilm is increased by quorum sensing, though the degree of production
is not given. Similarly, in [52] is claimed that q uorum sensing upregulated EPS pro-
duction in t he plant pathogen Erwinia amylovora, but do not provide quantitative
data. However, images are shown, from which the upregulated EPS may be esti-
mated as a factor five to ten increase. This is supported by the experiments in [53],
in which an approximately ten-fold increase of EPS production in a Pantoea stewar-
tii biofilm upon QS induction was discovered. Though many studies have estab-
lished connections between quorum sensing activity and qualitative changes in EPS
or other structural components, there are very few quantitative studies which inves-
tigate the amount of EPS produced through quorum sensing regulation. We choose
to use the direct values for change in EPS production as reported in [53] as an esti-
mate for t he difference i n downregulated and upregulated cell production rates in
our system.
Aim of study
In previous research, we developed a two-dimensional model of quorum sensing in
patchy biofilm communities in an early development stage to study how the hydrody-
namic environment and nutrient conditions contribute to biofilm growth, spatiotem-
poral quorum sensing induction patterns, and flow-facilitated intercolony
communication [28].
In this paper, we will extend this model to include a response from the biofilm once
quorum sensing has been induced. The upregulated cells not only produce AHL at
increased rates, but produce EPS at an increased rate as well. We wish to investigate
whether QS regulated EPS production provides a benefit (i n some sense) over a EPS
production strategy at fixed rate. In order to do so , we address two main research
questions with our model:
Frederick et al. Theoretical Biology and Medical Modelling 2011, 8:8
/>Page 4 of 29
1. How does quorum sensing-regulated EPS production impact the growing biofilm?
2. Why is it beneficial for the biofilm to regulate EPS production using a quorum
sensing mechanism?
Answers to these questions will be sought through numerical experiments that simu-
late the growth of biofilms in microfluidic chambers.
Mathematical Model and Simulation Design
Model assumptions
We formulate a math ematical model that describes quorum sensing in a growing bio-
film community in a narrow conduit which consists of several colonies, mimicking
conditions that occur in soil pores or plant/blood vessels. The biofilm is assumed to
consist of bacterial cells and EPS, and it is described by the local densities of its consti-
tuents. The biofilm proper is the region in which these densities are not zero; it is sur-
rounded by the bulk liquid. The biofilm expands due to cell growth and EPS
production, both of which are coupled to the availability of a carbon nutrient. The
nutrient is assumed to be dissolved. In the aqueous phase surrounding the biofilm, the
nutrient is transported by bulk flow convection and by Fickian diffusion. In the biofilm
itself it diffuses, although at reduced rate due to the increased diffusive resistance of
the EPS and cells. Nutrients are degraded in the biofilm by the growing cells for
growth and EPS production.
We distinguish between down- and upregulated bacterial cells. Upregulation and
downregulation are controll ed by the local concentration of AHL. Upregulation occurs
locally when and where the AHL concentration exceeds a threshold. If the AHL con-
centration in a (partially) upregulated biofilm colony drops below this critical thresh-
old, the upregulated cells become downregulated. AHL is also assumed to be dissolved.
AHL is transported by convection and diffusion in the surrounding aqueous phase, and
by diffusion in the biofilm, also at a reduced rate. After AHL is produced by the bac-
teria, it diffuses into the aqueous phase. Upregulated cells produce AHL at a higher
rate (by one order of magnitude) than downregulated cells, and decay abiotically, at a
rate much slower than they are produced.
We assume that up- and downregulated cells grow at the same rate, but upregulated
cells produce EPS at much higher r ates (tenfold). Moreover, we a ssume that the aver-
agecellsizefordown-andupregulatedbacteria is the same, i.e., the maximum cell
and EPS density is the same for both cell types. The increased production of EPS
implies an increased nutrient consumption of upregulated cells. Based on t he para-
meters for EPS production kinetics and stoichiometry of [26], we estimate with a sim-
pleruleofproportionsthatupregulated cells consume approximately twice the
amount of nutrients that down-regulated cells consume. We do not distinguish
between the EPS that is produced by each type of bacteria, but combine them into one
EPS fraction.
In addition to bacteria that engage in quorum sensing, i.e., switch between down-
and upregulated states, we also consider non-quorum sensing bacteria species, which
behave as either downregulated or upregulated cells, in regards to parameters for
growth, consumption, and EPS production. These non-quorum sensing cells carry an
AHL-receptor mutation and cannot be upregulated or produce any AHL. Although
Frederick et al. Theoretical Biology and Medical Modelling 2011, 8:8
/>Page 5 of 29
they are technically mutant cells, we will refer to these non-quorum sensing bacteria as
different species throughout the paper.
We formulate this model in the framework of the density-dependent nonlinear diffu-
sion model for biofilms which was originally introduced for a prototype single species
biofilm in [16], and has since been extended to multi-species systems. Quorum sensing
was first included in this model in our earlier study [28]. In the current study, we
expand on this model by explicitly accounting for EPS, which was previously implicitly
subsumed in the biomass fractions. Our model of EPS production is based on the one-
dimensional biofilm model of [26]. Some authors suggest that under conditions of
severe nutrient limitations, EPS could be broken down and converted into nutrients by
the cells [6-9,54]. Following [26], we include this process as an option in our model
and investigate whether it affects quorum sensing activity and biofilm composition.
Governing equations
The mathematical model for biofilm growth,quorumsensing,andEPSproduction,
based on the above assumptions, is fo rmulated as a differential mass balance for the
bacterial biomass fraction, EPS, growth-promoting nutrient su bstrate and quorum sen-
sing molecules.
Following the usual convention of biofilm modelling, the density of the particulate
substances (bacterial cells and EPS), is expressed in terms of the volume fraction that
they occupy [10]. We denote the volume fraction l ocally occupied by downregulated
quorum sensing cells by M
0
[-], the volume fraction of upregulated quorum sensing
cells by M
1
[-]. Their densities are accordingly M
0
*M
max
and M
1
*M
max
,wherethe
constant M
max
[gm
-3
] is the maximum biomass density, in terms of m ass COD per
unit volume.
The non-quorum sensing bacteria are accordin gly expressed in terms of the volu me
fractions M
2
(downregulated cells) and M
3
(upregulated cells). A summary of the cell
types and behaviours is given in Table 1.
Similarly, EPS density is expressed in terms of its variable volume fraction EPS [-]
and the constant maximum EPS density EPS
max
[gm
-3
], as EPS * EPS
max
.
The dissolved growth controlling nutrient substrates and the dissolved quorum sen-
sing molecules are described in terms of their concentrations C [gm
-3
] and AHL [nM].
The differential mass balances for the dependent variables M
0,1,2,3
, EPS, C, AHL are
obtained as:
∂
t
M
0
= ∇(D
M
(M)∇M
0
)+
+
κ
3
CM
0
κ
2
+ C
− κ
4
M
0
− κ
5
AHL
n
M
0
+ κ
5
τ
n
M
1
(1)
Table 1 Summary of the cell types and functions used in the model
Cell Type Description
M
0
downregulated QS, low EPS producer
M
1
upregulated QS, high EPS producer
M
2
non-QS, low EPS producer
M
3
non-QS, high EPS producer
Cells are classified as quorum sensing (QS) or non-quorum sensing (non-QS), and low or high EPS producers.
Frederick et al. Theoretical Biology and Medical Modelling 2011, 8:8
/>Page 6 of 29
∂
t
M
1
= ∇(D
M
(M)∇M
1
)+
+
κ
3
CM
1
κ
2
+ C
− κ
4
M
1
+ κ
5
AHL
n
M
0
− κ
5
τ
n
M
1
(2)
∂
t
M
2
= ∇(D
M
(M)∇M
2
)
+
+
κ
3
CM
2
κ
2
+ C
− κ
4
M
2
(3)
∂
t
M
3
= ∇(D
M
(M)∇M
3
)
+
+
κ
3
CM
3
κ
2
+ C
− κ
4
M
3
(4)
∂
t
C = ∇(D
C
(M)∇C) −∇(wC)
−
−
3
i
=
0
κ
1i
CM
i
κ
2
+ C
+
ˆ
δκ
6
EPS
κ
6
+ C
(5)
∂
t
AHL = ∇(D
AHL
(M)∇AHL)) −∇(wAHL)−
− σAHL + αM
max
M
0
+
(
α + β
)
M
max
M
1
(6)
∂
t
EPS = ∇(D
M
(M)∇EPS)+
+
3
i
=
0
γ
i
CM
i
κ
2
+ C
−
δκ
6
EPS
κ
6
+ C
(7)
where in the mass balances for the particulate substances, the constant densities
M
max
and EPS
max
cancelled. The total volume fraction occupied by the biofilm is
denoted by M, where
M = M
0
+ M
1
+ M
2
+ M
3
+ EP
S.
The two-dimensional computational domain Ω consists of a liquid phase with no
biomass, Ω
1
(t)={(x, y) Î Ω : M(t, x, y) = 0}, and the solid biofilm phase, Ω
2
(t)={(x,
y) Î Ω : M(t, x, y) > 0}.
These regions change as the biofilm grows.
The diffusion coefficient for the biomass fractions (D
M
(M)) is density dependent,
and is formulated according to [16] as
D
M
(M)=d
M
M
a
(
1 − M
)
b
.
The diffusion coefficient can be assumed to be the same for all bacterial fractions
and the EPS because we do not distinguish the cells with respect to size and growth
behaviour, and because EPS and cells diffuse tog ether. The biomass motility coefficient
d
m
[m
2
d
-1
] is positive but much smaller than the diffusion coefficients of the dissolved
substrates. Exponents a >1[-]andb > 1 [-] ensure biofilm expansion when M
approaches 1 (implying all available space is filled by biomas s), and little or no expan-
sion provided M is small. This choice of diffusion coefficient ensures a separation of
the biofilm and its surrounding aqueous phase, and that the maximum cell density will
Frederick et al. Theoretical Biology and Medical Modelling 2011, 8:8
/>Page 7 of 29
not be exceeded. The latter effect is of the type of a superdiffusion singularity, the for-
mer of the type of the porous medium equation degeneracy.
The diffusion coefficients for C and AHL are lower in the biofilm than in the sur-
rounding aqueous phase [55]. We let
D
C
(M)=D
C
(0) + M(D
C
(1) − D
C
(0)),
D
AHL
(
M
)
= D
AHL
(
0
)
+ M
(
D
AHL
(
1
)
− D
AHL
(
0
)),
where D
C
(0) and D
AHL
(0) are the diffusion coefficients in water, and D
C
(1) and D
AHL
(1) are the diffusion coefficients in a fully developed biofilm [m
2
d
-1
]. Although these
diffusion coefficients depend on the biomass density as well, they do so in a non criti-
cal way. Since D
C, AHL
(0) and D
C, AHL
(1) are positive constants within one order mag-
nitude, substrate diffusion is essentially Fickian.
The model inc ludes diffusive transport of carbon substra te and AHL in the biofilm,
and both convective and diffusive transport in the surroun ding aqueous phase of the
biofilm. The convective contribution to transport of C and AHL in the aqueous phase
is controlled by the flow velocity vector w =(u, v), where u and v [md
-1
]aretheflow
velocities in the x-andy- directions. The flow in t he aqueous phase is described by a
thin-film approximation to the incompressible Navier-Stokes equations [56]. In order
to drive the flow in the channel, we specify the volumetric flow rate in terms of the
non-dimensional R eynolds number Re. The growth and decay processes incorporated
into our model are:
• growth of bacterial cells, controlled by the local availability of carbon substrate, in
equations (1)-(4): the ma ximum specific growth rate is denoted by
3
[d
-1
], depen-
dency on C is described by standard Monod kinetics where
2
[gm
-3
] is the half
saturation concentration.
• natural cell death, at rate
4
[d
-1
], in equations (1)-(4),
• upregu lation of downregula ted biomass, i.e. the conversion of M
0
cells into M
1
cells in equations (1) a nd (2), as a consequence of AHL concentration inducing a
change in gene expression, and a constant rate of back-conversion. The parameter
5
[d
-1
nM
-n
] is the quorum sensing regulation rate – therateatwhichdownregu-
lated bacteria become upregulated, and vice versa. τ [nM] is the threshold AHL con-
centration locally required for quorum sensing induction to occur. The coefficient n
(n > 1) describes the degree of p olymerisation in the synthesis of AHL. We model
the dimerisation process for AHL, assuming that dimers of receptor-AHL complexes
are necessary for the transcription of the AHL-synthase gene. Assuming mass acti on
law kinetics, this process gives n = 2, however, the value of n used here is slight ly
higher, as further synergistic effects are lumped into this parameter as well [28].
• production of EPS by the bacterial cells at rates proportional to the bacterial
growth rates, in equation (7): the EPS production rate is
γ
i
= κ
3
∗ Y
i
∗ M
max
EPS
max
, i = 0, ,
3
in [d
-1
] where the yield coefficients Y
i
(EP S) [-] describe the amount of EPS pro-
duced per unit bacterial biomass of type M
0,1,2,3
.
Frederick et al. Theoretical Biology and Medical Modelling 2011, 8:8
/>Page 8 of 29
• nutrient consumption by bacterial biomass in (5): the maximum specific substrate
consumption rates are denoted by
κ
1i
= κ
3
M
max
Y
i
, i = 0, , 3
,
in [gm
-3
d
-1
], where M
max
is the maximum cell density, and Y
i
[-] are the yield coef-
ficients that incorporate both, the amount of nutri ent required for biomass growth
and for EPS production
• abiotic AHL decay, at rate s [d
-1
], in equation (6)
• AHL production by both quorum-sensing cell types M
0
and M
1
in (6) at different
rates: the AHL production rate of downregulated quorum sensing bacteria is a
[nM/(gm
-3
d
-1
)], and the increased production rat e of upregulated quorum sensing
bacteria is a + b [nM d
-1
]
• when carbon becomes limited, EPS may be used as a food source, in equations
(5) and (7). This process is represented by an inhibition term, in which EPS is
transformed into carbon at rate δ [d
-1
], with i nhibition constant
6
[gm
-3
]; the rate
ˆ
δ
[g
m
−3
d
−1
]
in (5) is related to δ by a yield coefficient and a constant conversion
factor, see [26]; to neglect the EPS consumption process, we let δ = 0 and
ˆ
δ =
0
.
For the numerical treatment, the above model is non-dimensionalized with the
choices:
˜
x =
x
L
,
˜
t = tκ
3
,
where L is the flow channel length, and
1
κ
3
is the characteristic time scale for bio-
mass growth. The new dimensionless concentration variables are:
˜
C =
C
C
bulk
, A =
A
HL
τ
,
where C
bulk
is the bulk substrate concentration (the amount of substrate C supplied
at the inflow boundary). Note that the volume fractions M
i
, i =0, ,3andEPS were
originally defined as dimensionless variables. The new reaction parameters are:
˜κ
1i
=
M
max
Y
i
C
bulk
, i =0, ,3;
˜κ
2
=
κ
2
C
bulk
; ˜κ
3
=1; ˜κ
4
=
κ
4
κ
3
;
˜κ
5
=
κ
5
τ
n
κ
3
; ˜κ
6
=
κ
6
C
bulk
;
˜σ =
σ
κ
3
; ˜α =
αM
max
κ
3
T
;
˜
β =
βM
max
κ
3
T
˜
δ =
δ
κ
3
;
˜
ˆδ =
δ
κ
3
C
bulk
;
˜γ
i
=
Y
0EPS
M
max
EPS
max
, i =0, ,3.
Frederick et al. Theoretical Biology and Medical Modelling 2011, 8:8
/>Page 9 of 29
The dimensionless diffusion coefficients become:
˜
D
C
=
D
C
L
2
κ
3
;
˜
D
AHL
=
D
AHL
L
2
κ
3
;
˜
D
M
=
D
M
L
2
κ
3
.
The non-dimensionalized equations are then:
∂
˜
t
M
0
=
˜
∇(
˜
D
M
(M)
˜
∇M
0
))
+
˜κ
3
˜
CM
0
˜κ
2
+
˜
C
−˜κ
4
M
0
−˜κ
5
˜
A
n
M
0
+ ˜κ
5
M
1
∂
˜
t
M
1
=
˜
∇(
˜
D
M
(M)
˜
∇M
1
))
+
˜κ
3
˜
CM
1
˜κ
2
+
˜
C
−˜κ
4
M
1
+ ˜κ
5
˜
A
n
M
0
−˜κ
5
M
1
∂
˜
t
M
2
=
˜
∇(
˜
D
M
(M)
˜
∇M
2
))
+
˜κ
3
˜
CM
2
˜κ
2
+
˜
C
−˜κ
4
M
2
∂
˜
t
M
3
=
˜
∇(
˜
D
M
(M)
˜
∇M
3
))
+
˜κ
3
˜
CM
2
˜κ
2
+
˜
C
−˜κ
4
M
3
∂
˜
t
˜
C =
˜
∇(
˜
D
C
(M)
˜
∇
˜
C)) −
˜
∇(w
˜
C)
−
˜
C
˜κ
2
+
˜
C
r
i=0
˜κ
1i
M
i
+
˜
ˆδ ˜κ
6
˜
E
˜κ
6
+
˜
C
∂
˜
t
˜
A =
˜
∇(
˜
D
˜
A
(M)
˜
∇
˜
A)) −
˜
∇(w
˜
A)
−˜σ
˜
A + ˜αM
0
+
˜
βM
1
∂
˜
t
˜
E =
˜
∇(
˜
D
M
(M)
˜
∇
˜
E)
+
˜
C
˜κ
2
+
˜
C
3
i
=
0
˜γ
i
M
i
−
˜
δ ˜κ
6
˜
E
˜κ
6
+
˜
C
The parameters used in o ur simulat ions and their non-dimensional values are listed
in Table 2. The biofilm growth parameters, t he EPS production parameters, and the
substrate diffusion coefficients were chosen from the range of standard values in bio-
film modelling literature [10,26], and the biomass diffusion coe fficient values (d
M
, a, b)
were selected from [56]. The quorum sensing parameters
5
, a, b, g and n were
derived from experiments on the kinetics of suspended P. putida IsoF cultures and the
AHL molecule 3-oxo-C10-HSL [57]. In experimental quorum sensing literature, the
threshold AHL concentration requi red for induction, τ, ranges from less than 5 nM to
above 200 nM. Following [58], we have chosen the relatively low value of τ = 10 nmol/
L to allow for induction to occur at an early stage of biofilm growth. We have selected
these parameters in order to analyze the general behaviour of a system of biofilms and
quorum sensing, i.e., the analysis is not specific to P. putida and AHL. The flow velo-
city is Re = 10
-4
, which is well within the creeping flow regime. At this low flow rate,
the dimensionless Peclet number, which estimates the relative contributions of convec-
tive and diffusive mass transport, is Pe ≈ 1.0, indicating that the system is neither con-
vection- nor diffusion-dominated. In particular, in convection dominated cases (Pe >>
1), it has been shown that AHL can be washed out without contributing to up-
Frederick et al. Theoretical Biology and Medical Modelling 2011, 8:8
/>Page 10 of 29
regulation [28,37]. Moreover, following [56], biofilm deformation and shear induced
detachment can be neglected at these low flow velocities.
Computational approach
The numerical solution of the density-dependent diffusion-reaction model is computed
using a semi-implicit finite difference-based finite volume scheme, formulated for the
concentrations in the centers of the grid cells. Time integration uses a non-local
(semi-implici t) discretization in the fashion of non-standard finite difference methods.
The time-step size is variable and chosen in order to ensure stability, positivity, bound-
edness (by 1), and a finite speed of interface propagation [59]. In our application, the
computational domain is discretized on a uniform rectangular grid of size 2000 × 200.
In each time step six sparse, banded diagonal linear algebraic systems (one for each
of M
0
, M
1
, M
2/3
, C, AHL,andEPS) are solved with the stabil ized biconjugate gradient
method. The flow field is calculated using the analytical approximation of [56].
The numerical method was first introduced for s ingle-species biofilms in [59] and
then extended to biofilm systems with several microbial species in [60] and [61], the
latter also containing a stability analysis. A computational conver gence study can be
found in [62]. These results carry over qualitatively to the study at hand. The method
is implemented in OpenMP for execution o n multi-core and shared memory multi-
Table 2 Model parameters in the high nutrient case
Parameter Description Source Value
10
Rate of C consumption by M
0
W 923
11
Rate of C consumption by M
1
W 1846
12
Rate of C consumption by M
2
W 923
13
Rate of C consumption by M
3
W 1846
2
Monod half sat. const. W 0.02
3
Max specific growth rate of bacteria H 1.0
4
Bacterial lysis rate W 0.2083
5
Quorum sensing upregulation rate F 2.5
6
Monod half sat. const. H 0.04
δ EPS conversion to C rate (C equation), if included H 0.28
ˆ
δ
EPS conversion to C rate (EPS equation), if included H 11.2
s Abiotic degradation rate of AHL F 0.1109
a Constitutive production rate of AHL F 920
b Induced production rate of AHL F 9200
n Degree of polymerisation F 2.5
g
0
M
0
EPS production rate H 0.84
g
1
M
1
EPS production rate H 8.4
g
2
M
2
EPS production rate H 0.84
g
3
M
3
EPS production rate H 8.4
M
max
Maximum cell density H 24·10
3
EPS
max
Maximum EPS density H 4·10
3
D
C
(0), (1) Substrate diffusion coefficients ES 0.67, 0.54
D
AHL
(0), (1) AHL diffusion coefficients HR 0.52, 0.26
a Diffusion coefficient parameter ES 4.0
b Diffusion coefficient parameter ES 4.0
d
M
Biomass motility coefficient ES 6.67e-09
H/L Channel aspect ratio ES 0.1
References: ES = [56], H = [26], HR = [64], F = [57], W = [10]
Frederick et al. Theoretical Biology and Medical Modelling 2011, 8:8
/>Page 11 of 29
processor architectures; the parallelization behaviour is documented in [61]. The simu-
lations were conducted on an Intel Itanium based SGI Altix 450, typically using 12
cores concurrently.
Simulation setup
Three d ifferent types of biofilms will be studied: quorum sensing (M
0
, M
1
cells only),
non-quorum sensing (M
2
or M
3
cells only), and mixed ( M
0
, M
1
,andoneofM
2
or M
3
cells). Two nutrient conditions are tested: high and low (differing by a factor of two),
and simulations are performed with and without the biological process of EPS con-
sumption; the parameters δ an d
ˆ
δ
are set equal to zero when EPS consumption is
excluded. A summary of the simulation experiments is given in Table 3. Our simula-
tions will give us qualitative information aboutquorumsensingandbiofilmsystems.
Numerical results, including time, are described using non-dimensional measures, and
should not be deemed as quantitative conclusions.
Our biofilm model is on a mesoscopic scale, and so the computational domain is
considered to be a small portion, or open subdo main, existing within a larger reactor.
The boundary conditions we choose describe both the reactor type and the operating
conditions in which the experiment is co nducted, and connect the computatio nal
domain to the outside physical envi ronment. Our computational domain is representa-
tive of a microfluidics chamber which receives fluid at the left (inflo w) bounda ry from
a large, well mixed reactor. Carbon is supplied into the channel from the upstream
boundary, but no AHL may enter into the flow channel from upstream. AHL and car-
bon in the dissolved liquid phase Ω
1
may exit the system via convective transport.
Specifically, the following boundary conditions are imposed on our domain Ω =[0,
L]×[0, H]:
• For M
0
, M
1
, M
2
, M
3
and EPS, no flux conditions everywhere (n is the direction of
the outward normal): ∂
n
M
0
=0,∂
n
M
1
=0,∂
n
M
2
=0∂
n
M
3
=0,∂
n
EPS =0on∂Ω
• For C and AHL, no diffusive flux c onditions everywhere except for on inflow,
where we specify the bulk concentration: C =1,A = 0 for x =0,∂
n
C =0,∂
n
A =0
everywhere else.
The initial conditions used are:
• An inoculation of the bottom surface of the channel with 16 colonies, each with a
density o f 0.3. Biofilm colonies are pl aced randomly along the channel, at an offset
from the channel entrance and exit, to avoid unphysical boundary effects. This ran-
dom p lacement mimics experimental difficulties in controlling where bacteria set-
tle. The type of cell inoculated depends on the biofilm being grown: either quorum
Table 3 Summary of the simulation experiments
Biofilm Name Biofilm Type Nutrient Case EPS consumption
QS M
0
, M
1
high, low yes, no
M
2
non-QS M
2
high, low yes, no
M
3
non-QS M
3
high, low yes, no
M
2
mixed M
0
, M
1
, M
2
high yes, no
M
3
mixed M
0
, M
1
, M
3
high yes, no
Frederick et al. Theoretical Biology and Medical Modelling 2011, 8:8
/>Page 12 of 29
sensing (16 M
0
cells), non-quorum sensing (16 M
2
or M
3
), or mixed (8 M
0
and 8
M
2
,or8M
0
and 8 M
3
)
• AHL = 0, EPS = 0; initially, biomass consists of cells only, but EPS and AHL pro-
duction begins immediately upon the start of the simulation
• C=1.
The simulations finish when an imposed stopping criterion is met: the biofilm height
reaches 80% of the channel height. This ensures the simulation stops before clogging
effects take place; when the biofilm height approaches the top of the channel, local
flo w velocities and shear forces increase to the level that detachment processes would
no longer be negligible, leading to a breakdown of the biofilm growth model.
Analysis
To interpret the results of computer simulations o f our model, we will provide two-
dimensional visualizations of the simulations, and use the fol lowing quantitative mea-
sures. The volume fraction of the domain occupied by the biofilm (cells and EPS), or
the occupancy, is a simple measure of biofilm size. The occupancy is averaged over the
whole regarded volume:
Occupancy(t): =
1
LH
2
(
t
)
dxdy
.
The total downregulated quorum sensing cell biomass in the system, M
0total
,isthe
volume fraction of M
0
multiplied by maximum cell density:
M
0total
(t ):=M
max
M
0
(t , x, y)dxdy
.
The total M
1
, M
2
,andM
3
cell biomasses, and the EPS biomass, are computed simi-
larly. The total biomass is therefore:
M(t )=M
0total
(t )+M
1total
(t )+
+ M
2total
(
t
)
+ M
3total
(
t
)
+ EPS
total
(
t
).
The occupancy and total cell and EPS biomass measures will be used to compare the
growth and composition of the biofilm over time.
We will use the follow ing abbreviations: quorum sensing (QS) , non-quorum sensing
(non-QS).
Results
The results of the simulation experiments summarized in Table 3 will be described in
the following sequence:
• Example simulation of QS controlled EPS production in a biofilm: an example
simulation of a quorum sensing biofilm under high nutrient conditions.
• Simulations without the EPS consumption process: simulations of biofilms that do
not include the process of EPS consumption. First, QS and M
2
and M
3
non-QS
biofilms are compared under high and low nutrient conditions. Second, M
2
and M
3
mixed biofilms are regarded.
Frederick et al. Theoretical Biology and Medical Modelling 2011, 8:8
/>Page 13 of 29
• Simulations with the EPS consumption process: the experiments of the previous
section are repeated, but the process of EPS consumption is included. QS and M
2
,
M
3
non-QS biofilms under high and low nutrient conditions are described first, fol-
lowed by M
2
and M
3
mixed biofilms.
• Effect of random colony placement in mixed biofilms: a discussion on the effects
of random initial colony placement in M
2
and M
3
mixed biofilms on quorum sen-
sing induction.
Example simulation of QS controlled EPS production in a biofilm
To simulate growth of a QS biofilm, the bottom surface of the channel is inoculated
with sixteen M
0
colonies. A high supply of substrate enters the channel from the
inflow boundary, and the process of EPS consumption is neglected.
The growth period begins with biomass in the inoculated colonies growing and spa-
tially spreading when the total biomass (M
0
+ M
1
+ EPS) locally approaches the maxi-
mumdensity,1.0.Intime,someneighbouring colonies begin to merge. Figure 1(a)
depicts the biofilm before induction occurs; the colonies consist almost entirely of M
0
cells.
AHL accumulates over time in the channel as it is produced by the growing colonies.
Molecules produced by the colonies diffuse into the liquid region, and are transported
downstream by convection and diffusion, causing AHL conce ntration s to incre ase in
the main flow direction. The maximum AHL concentration found at t he downstream
boundary is a typical effect of flow facilitated convective transport [37]. In Figure 1(b),
the switch to QS is occuring. Upregulation occurs locally when the non-dimensional
AHL concentration reaches 1.0. Positive feedback in the quorum sensing system is
then initiated – upre gulated cells produc e AHL at ten times the d ownregulated rate,
leading rapidly to large increases in AHL concentrations, and further upregulation of
cells throughout the domain.
The downstream colonies begin to upregulate first, followed b y the upstream colo-
nies. This is an observation of flow-facilitated inter-colony communication – AHL
molecules produced by the large, upstream colonies are transported by convection and
diffusion, contributing to upregulation in the smaller downstream colonies [28].
The biofilm in Figure 1(c) is fully upregulated, and EPS production has increased by
a factor of ten. The biofilm grows and expands rapidly, until the flow channel becomes
clogged with biomass and the maximum predetermined biofilm height is obtained.
In Figure 2, the biofilm is shown again before and after induction, with the colour
scale representing the proportion of cellular biomass (the fraction (M
0
+ M
1
)/(M
0
+
M
1
+ EPS)), along with the concentration of the carbon nutrient C. Carbon concentra-
tions decrease in the flow direction, due to consumption b y biomass. In later time-
steps, mid-channel and downstream colonies experience severe substrate limitations
due to substrate consumption by the larger upstream colonies.
Prior to induct ion (Figure 2(a)), the b iofilm composition by mass is approximatel y
15% EPS, 85% cells. Following induction (Figure 2(b)), EPS production rates are upre-
gulated, resulting in a change in biofilm composition to 60-65% EPS. The large,
merged, upstream colonies experienced the greatest increase in volume - in order for
colonies to have increased growth due to upregulated EPS production rates, both
Frederick et al. Theoretical Biology and Medical Modelling 2011, 8:8
/>Page 14 of 29
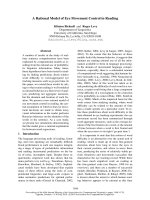
Figure 1 Example simulation: QS biofilm in the case of high nutrient conditions, and no EPS
consumption. The colour scale (E) in the subfigures represents the fraction of downregulated cells in the
biofilm (M
0
/(M
0
+ M
1
)). AHL concentration lines are shown in black and white, equidistantly distributed
between zero and the maximum AHL value at each time. A non-dimensional value of AHL = 1.0 is
required for upregulation. (A) shows the QS biofilm, before induction occurs (t = 5.0, max AHL = 0.44). In
(B), the downstream colonies have upregulated (t = 6.0, max AHL = 1.71). (C) shows the biofilm after
induction has occurred (t = 8.0, max AHL = 14.1).
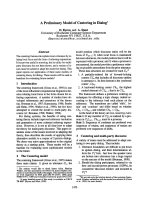
Figure 2 Example simulation: QS biofilm in the case of high nutrient conditions, and no EPS
consumption. The colour scale in the subfigures represents the fraction of EPS biomass in the biofilm
((EPS)/(M
0
+ M
1
+ EPS)), showing mass composition of the biofilm. Carbon concentrations are normalized
with respect to the value of the incoming carbon concentration (the non-dimensional parameter C
bulk
). (A)
shows the QS biofilm at an early stage of growth, before induction (t = 5.0). (B) shows the biofilm after
induction (t = 9.5). The carbon concentration colour scale is given in (C).
Frederick et al. Theoretical Biology and Medical Modelling 2011, 8:8
/>Page 15 of 29
upregulated cells and adequate nut rients are required. So although the downstream
colonies are first to upregulate, these colonies lack the nutrients needed to e xpand
quickly.
In Figure 3, the spatially averaged measures introduced in the “Analysis” Section are
plotted, describing biofilm growth and EPS production i n time. The biofilm occupancy
(inclusive of cellular and EPS biomass) is plotted in Figure 3(a). The slope of the occu-
pancy curve increases at t = 6.0, corresponding to induction, after which biofilm
growth continues at an enhanced rate. The total M
0
, M
1
, and EPS biomass constituting
the biofilm is shown in Figure 3(b). It is primarily the downregulated cell populations
which grow in the initial time period, until induction occurs. Subsequently, M
0
cells
are rapidly upregulated to M
1
cells, and the total M
0
biomass in the biofilm declines
while M
1
cell representation increases. Upon completion of the simulation, the biofilm
is fully upregulated. M
1
produces EPS at the induced rate, so EPS biomass increases
substantially after the switch as well.
Simulations without the EPS consumption process
Quorum sensing and non-quorum sensing biofilms
In the first simulation experiment, QS biofilms (M
0
, M
1
cells), the low-EPS producing
M
2
non-QS biofilms and high-EPS producing M
3
non-QS biofilms were grown under
high and low nutrient conditions, using the same initial distribution of colonies. Under
the low nutrient condition, the concentration of incoming carbon (C
bulk
) is lowered,
which affects the following non-dimensional parameters:
10
= 1846,
11
= 3692,
12
=
1846,
13
= 3692,
2
= 0.04,
ˆ
δ =22
.4
.
Figure 4 shows the spatially averaged results for these biofilm simulations. The nutri-
ent supply directly influences growth rates, and so the simulations finish earliest for
the high nutrient case. The occupancies of the biofilms are shown in Figures 4(a, b);
note that occupancy is inclusive of both cells and EPS. The high-EPS producing M
3
non-QS biofil m had the greatest occupancy, followed by the QS biofilm, and the low-
EPS producing M
2
non-QS biofilm had the lowest occupancy. In contrast, the M
3
non-
QS biofilm had the lowest bacteria cell population, and the M
2
non-QS biofilm had the
highest cell population (Figures 4(c, d)). The high values of QS and M
3
non-QS biofilm
occupancies are therefore not due to additional bacteria cells, but are due to the pre-
sence of EPS produced at the induced rates. This is verified in Figures 4(e, f), which
demo nstrates the enhanced EPS production by the QS biofilm. The spatial patterns of
Figure 3 Spatially averaged results for the example simulation. The (A) occupancy and (B) M
0
, M
1
, and
M
2
biomass of the quorum sensing biofilm with high nutrient supply, excluding EPS consumption.
Frederick et al. Theoretical Biology and Medical Modelling 2011, 8:8
/>Page 16 of 29
colony size discussed in the Section “Example simulation of QS controled EPS produc-
tion in biofilm” are observed in these simulationsaswell;theupstreamcolonies
experience the most cellular and EPS growth, whereas the cells in nutrient-poor down-
stream colonies produce less EPS and are slow-growing. These results a re consistent
under both the high and low nut rient regimes, though the low nutrient regime yielded
lower occupancies, cell populations, and total EPS. Because the threshold AHL
Figure 4 Spatially averaged results for QS and non-QS biofilms under the high and l ow nutrient
condition. EPS consumption was excluded. The biofilm occupancy is shown in (A, B), total cell biomass in
(C, D), total EPS in (E, F), and fraction of EPS in (G, H) for the high and low nutrient conditions, respectively.
Frederick et al. Theoretical Biology and Medical Modelling 2011, 8:8
/>Page 17 of 29
concentration i s surpassed before nutrient limitations occur, induction occurs at the
same time in both the high and low nutrient regimes.
The composition of the biofilm over time is shown in Figures 4(g, h). After the initial
time period in which EPS prod uction begins, the low-EPS producing non-QS biofilm
(M
2
) remains composed of less than 20% EPS by mass, whereas the high- EPS produ-
cing non-QS biofilm (M
3
) is approximately 65% EPS. The QS biofilm switches its com-
position by mass after induction from predominantly bacteria cells to EPS. In
summary, the QS biofilms obtained greater cell populations than M
3
non-QS biofilms,
and occupied more volume in the channel than M
2
non-QS biofilms.
The quorum sensing mechanism is used to switch behaviours from the M
2
like mode
of low EPS production and faster cell growth to the M
3
like mode of high EPS produc-
tion at the expense of slower bacterial growth. This transition takes place rapidly after
induction occurs and is almost completed after a period of time that is about twice as
long as the characteristic time scale of biomass growth. Eventually the entire biofilm
behaves like a high-EPS producing M
3
biofilm.
Mixed biofilms
A series of simulations were performed to simulate the gro wth of mixed biofilms with
a high nutrient supply. Mixed biofilms contain both QS cells and M
2
or M
3
non-QS
cells in the channel. A n example of growth of a M
2
mixed biofilm is shown in Figure
5. The colour represents the fraction of QS (M
0
, M
1
) cells in the biofilm, relative to all
cells ((M
0
+ M
1
)/(M
0
+ M
1
+ M
2/3
)). Isolines of AHL concentration are given as well;
wherever concentrations are greater than the induction threshold, QS cells have upre-
gulated from M
0
to M
1
. Figure 5(a) s hows the biofilm at an early development stage.
Figure 5 Simulation of the growth of a M
2
mixed biofilm (M
0
, M
1
, M
2
) under high nutrient
conditions. The process of EPS consumption was excluded. The biofilm is shown at three different time
steps throughout the simulation, with contour lines showing the AHL concentrations. Colonies are
coloured to represent the fraction of cells which are QS: ((M
0
+ M
1
)/(M
0
+M
1
+M
2
)); the legend is given in
(D). (A) shows an early development stage of a M
2
mixed biofilm (t = 5.0). In (B), QS and M
2
non-QS
colonies are growing and merging (t = 8.0). A late development stage is shown in (C) (t = 11.0).
Frederick et al. Theoretical Biology and Medical Modelling 2011, 8:8
/>Page 18 of 29
The colonies are approximately equal in size, as carbon supply is sufficient for maximal
growth at this time. Because QS induction has not yet occurred, and C is not l imited,
all QS and M
2
non-QS colonies produced EPS equivalently, at the low rate. In Figure
5(b), merging of QS and non-QS colonies is prevalent upstream and in the mid-chan-
nel, though colonies at the downstream extent of the biofilm remain exclusively QS or
M
2
non-QS. AHL concentrations have surpassed the induction threshold in the mid-
channel and downstream, indicating that QS cells in those regions of the domain have
upregulated to M
1
, and are consuming nutrients at an increased rate. Merging of colo-
nies continues into the late developme nt stage (Figure 5(c)). At the end of the simula-
tion, QS cell populations are slightly higher than M
2
non-QS cell populations. The
large, merged, upstream colony experiences the most growth, due to its proximity to
the nutrient source, enabling both cell population growth and induced EPS production
by upregulated QS cells. Note that in this example, the colony closest to the inflow
boundary is a QS colony, and several of the furthest downstream colonies, where nutri-
ent deficiencies are highest, are M
2
non-QS colonies.
Because the resulting final QS and non-QS cell populations may be impacted by the
stochastic distribution of cells in the initial inoculation, particularly, whether a QS or
non-QS colony is located closest to the nutrient-rich upstream boundary, this M
2
mixed biofilm experiment was repeated for a total of ten simulations, each using a dif-
ferent initial distribution. An additional ten simulations were conducted to test the
growth of M
3
mixed biofilms, which include the high-EPS producing M
3
non-QS cells
instead of M
2
non-QS cells. The total QS and non-QS biomass averaged over all ten
simulations for the M
2
and M
3
biofilmsisshowninFigures6(a,d),andtheQSand
non-QS cellular biomass for each of the individual simulations are shown in Figures 6
(b, c, e, f). It was found that on average, low-EPS producing M
2
non-QS cells outnum-
bered QS cell populations in the M
2
mixed simulations. The high-EPS producing M
3
non-QS cell populations were approximately equivalent to QS cell populations in the
M
3
mixed simulations. In analyzing each of the twenty mixed simulations, it was found
that the colony placed most upstream in the random initial inoculation ultimately grew
the largest cell population in that simulation, just as was observed in the example M
2
-
Figure 6 Biomass of QS and M
2
and M
3
non-QS colonies in mixed biofilms. High nutrient case, EPS
consumption excluded. Figure (A) shows the average biomass and standard deviation for the ten M
2
-
mixed simulations; and total M
0
+ M
1
(B) and M
2
(C) cell biomass for each individual simulation are shown
as well. Similarly, the results for the ten M
3
-mixed biofilms are shown in (D)-(F).
Frederick et al. Theoretical Biology and Medical Modelling 2011, 8:8
/>Page 19 of 29
mixed simulation shown in Figure 5. This shows the strong effect of nutrient availabil-
ity and mass transfer on biofilm structure, which can dominate quorum sensing effects.
In some cases, the upstream colonies utilized so much of the incoming nutrient that
cells in the downstream colonies experienced cell death (this is evident by the decreas-
ing curves in the cell biomass plots Figures 6(b, c, e, f)). In accordance with the results
of the previo us section, populations of high-EPS producing biofilms are lower than
populations of low-EPS producing biofilms.
Simulations with the EPS consumption process
An additional complexity was considered in our biofilm simulations, which accounts
for the utilization of EPS by bacteria cells as a secondary source of the carbon nutrient
when limitations occur. The experiments of the subsections “Quorum sensing and
non-quorum sensing biofilms” and “Mixed biofilms” were repeated, but with considera-
tion of this biological process.
Quorum sensing and non-QS biofilms
QS and non-QS biofilms were grown in the channel using the same initial distribution
of colonies as the first simulation experiment, under high and low nutrient conditions.
The trend discussed there is present here as well: QS biofilms have higher cell popula-
tions than M
3
non-QS biofilms, and higher occupancies than M
2
non-QS biofilms. Cell
populations w ere approximately equivalent to those in the biofilms that did not con-
sume EPS, however, occupancy was considerably lower, due to EPS lost through
consumption.
When QS biofilms induced, they increased their volume from that of a M
2
non-QS
biofilm to match the size of a M
3
non-QS biofilm. These trends are also present under
the low nutrient regime, though cell populations and occupancies are lower than when
the high nutrient regime was used.
Differences in the biofilm composition were found when biofilms consumed EPS as
an additional nutrient source, in comparison to biofilms which do not consume EPS.
Figure 7(a) shows the total EPS produced by th e biofilms over time for the simulations
with a high nutrient supply. In contrast to the non-EPS consuming biofilms in Figure
4, the total net EPS production of these biofilms is much lower, and production is
impaired when nutrient deficiencies emerge at approximately t =6.0,whenEPScon-
sumption is triggered. Induction of the QS biofilm also occurs at t = 6.0, so its total
EPS is increased to the levels of the M
3
non-QS bio film. The fraction of EPS biomass
in the biofilm over time for the simulations with a high nutrient supply is shown in
Figure 7(b). After the initial time period in which EPS pr oduction begins, the low-EPS
producing M
2
non-QS biofilm is composed of 10% EPS by mass, whereas the high-EPS
producing M
3
non-QS biofilm is about 50% EPS. The QS biofilm switches its composi-
tion by mass after induction from predominantly bacteria cells to EPS. When EPS con-
sumption increases, EPS declines to 20% in the M
3
non-QS and QS biofilms, and to
almost zero in the M
2
non-QS bio film. Biofilms that use EPS as a nutrient source are
predominantly composed of cellular biomass, or entirely by cellular biomass, in
extreme nutrient deficiencies.
However, the most notable difference in biofilms that consumed EPS was in the bio-
film composition. The EPS consumption process promotes more pronounced spatial
differences in biofilm composition. In Figure 8(a), a QS biofilm with the same initial
Frederick et al. Theoretical Biology and Medical Modelling 2011, 8:8
/>Page 20 of 29
inoculation of Figure 2 is shown at an early development stage, when nutrient supply is
abundant, and composition i s uniformly 10% EPS. In Figure 8(b), induction has
occurred, and the large, merged upstream colony has experienced growth and
enhanced EPS production by upregulated M
1
cells. Only the most upstre am portion of
this colony contains both cells and EPS. Here, as indicated by the carbon isolines,
upregulated cells have access to the nutrients required to produce EPS at the induced
rate, and therefore do not need to consume local EPS for additional nutrients. Else-
where, the cells are starved of n utrients and are forced to consume their entire EPS
supply.
After QS induction occurs, the biofilm undergoes a transition from a low EPS produ-
cing M
2
like state to a state that is essentially entirely M
3
like, i.e. it becomes a fast
EPS producer at the expense of slower bacterial growth. After this transition is com-
plete, within a time period that compares to the characteristic timescale of biomass
growth, no remainders of the down-regulated past are evident. This corresponds to the
observations of the previous sections.
Mixed biofilms
Twenty additional simulations of mixed biofilms under the high nutrient condition
were performed (ten M
2
-mixed and ten M
3
-mixed biofilms), each using a different
Figure 7 QS and non-QS biofilms under the high nutrient condition, for the EPS consumption case.
(A) shows the total EPS, and (B) shows the fraction of EPS biomass in the biofilms.
Figure 8 An example of a QS biofilm under high nutrient conditions, EPS consumption case.The
composition of the biofilm by EPS biomass is shown (A) before and (B) after induction. The carbon
concentration scale is given in (C).
Frederick et al. Theoretical Biology and Medical Modelling 2011, 8:8
/>Page 21 of 29
initial inoculation, with the inclusion of the EPS consumption process. Figure 9 (a, d)
shows the average biomass of the QS and non-QS colonies, as well as the total cell
biomass in time for every simulation in Figures 9(b, c, e, f). In c omparison to the
mixed biofilms that excluded EPS consumpti on, a higher varia nce in final cell popula-
tions was observed. This is in part due to an increased occurrence of cell populations
either remaining constant or declining in time. Again, the average QS and non-QS cell
populations are not higher than the mixed biofilms which excluded EPS consumption.
Similar to the previous mixed simulations, biofilms with low-EPS producing M
2
non-
QS cells obtained higher cell populations than biofilms with high-EPS producing M
3
non-QS cells. In every case, the colony located closest to the nutrient source experi-
enced the most growth in the particular simulation. Decline of cell populations,
observed in some of the simulations, is attributed to a high distribution of those colo-
nies in the nutrient-poor mid-channel and downstream regions. Spatial gradients in
biofilm compositi on by EPS, as discussed in subsection “Quorum sensing and non-QS
biofilms” (in “Simulations with the EPS consumption process”), were also prevalent,
resulting in biofilms with little to no EPS in the downstream colonies.
Effect of random colony placement in mixed biofilms
In subsections “Mixed Biofilms”,inboth“Si mulations without the EPS consumption
process” and “Simulations with the EPS consumption process”, variations in the total
QSandnon-QSbiomasswerefoundfortheM
2
-andM
3
-mixed biofilms. To investi-
gate whether these variations are attributed to nutrient limitations or to QS, the M
1
biomass was studied for all forty mixed biofilm simulations, plotted in Figure 10.
The positive feedback feature of QS systems leads to a very rapid upregulation of QS
cells in the biofilm – after ind uction occurs, M
1
cell populations quickly rise. The
switching time represents this u pregulation period. In Figures 10(a, b), the M
2
-and
M
3
-mixed biofilms that exclude EPS consumption have a switc hing time between 7.5
and 8.5. The M
2
and M
3
mixed biofilms that consume EPS (Figures 10(c, d)) switch
between 7.5 and 8.0. Tho ugh the variation in switching time is small, we can conclude
that the random initial placement of colonies does have a small effect of the time at
Figure 9 Biomass of QS and non-QS colonies in mixed biofilms. High nutrient case, EPS consumption
included. Figure (A) shows the average biomass and standard deviation for the ten M
2
-mixed simulations;
and total M
0
+ M
1
(B) and M
2
(C) cell biomass for each individual simulation are shown as well. Similarly,
the results for the ten M
3
-mixed biofilms are shown in (D)-(F).
Frederick et al. Theoretical Biology and Medical Modelling 2011, 8:8
/>Page 22 of 29
which QS induction occurs. After induction, nutrient limitations arise, and the variabil-
ity in total M
1
cell biomass increases. Nutrient shortages occur not only because the
biofilm is larger, but also because the upregulated M
1
cells have a higher cons umption
rate. In each simulation, nutrient limitations cause M
1
cell growth rates to decrease,
and in some cases, the cell populations remain constant or even decline.
Discussion
The first question that motivated our study was: how does QS-regulated EPS produc-
tion impact the growing biofilm? In particular, what does the biofilm look like over
time, with respect to distribution and composition of cells and EPS? The answers to
these questions were obtained by studying biofilm composition and the upstream clog-
ging effect.
It was found that colony growth was so greatly enhanced with high-EPS producing
non-QS biofilms, and in induced QS biofilms, that these biofilms rapidly fill th e chan-
nel with biomass. When high-EPS producing cells are located in a region where nutri-
ent supply is abundant, these cells have access to the nutrients required for enhanced
EPS production. If these cells are located in a region of nu trient scarcity, induced EPS
production reactions cannot occur, and so colonies cannot undergo enhanced expan-
sion. In all the simulations, spatial gradients of biofilm size were prevalent – large,
merged upstream colonies have full access to available nutrients, grow and fill the
channel, and cause the downstream colonies to remain small. At low EPS production
rates, the biofilm is composed by majority of cells, at high EPS production rates, the
biofilm is predomin antly EPS. When QS biofilms induce, they switch their proportions
of cellular and EPS biomass. The composition differs greatly if the EPS consumption
process is modelled. In regions of nutrient deficiencies, EP S may be completely con-
sumed by the bacteria cells, to the extent that the biofilm consists only of cells
Figure 10 M
1
biomass in the mixed biofilm simulations. (A) and (C) are M
2
-mixed biofilms, without and
with EPS consumption. (B) and (D) are M
3
mixed biofilms, with and without EPS consumption.
Frederick et al. Theoretical Biology and Medical Modelling 2011, 8:8
/>Page 23 of 29
(generally in the mid- to do wnstream region), and only the portion of the biofilm clo-
sest to the inflow boundary contains a protective layer of EPS.
We were also interested in investigating, is it beneficial for the biofilm to regulate
EPSproductionusingaQSmechanism?Several factors are considered in determining
whether one biofilm was more successful than another, including occupancy and total
cell biomass. High-EPS producing biofilms have higher occupancies than low-EPS pro-
ducing biofilms, as a result of increased levels of EPS. They may furthermore benefit,
for example, by pro tection from environmental hazards, such as detachment, a ntibio-
tics or grazers. Low-EPS producing non-QS cells which have merged with upregulated
QS colonies (in mixed simulations) thereforeexperiencebenefitsfromthethickEPS
layer as well. If EPS consumption is occurring, non-QS cells in mixed colonies also
benefit by consuming the additional nutrients produced.
However, in all simulations, low-EPS producing cells on average outnumbered the
QS cells. This occurred in comparing QS with low EPS-producing non-QS biofilms,
and mixed biofilms, with and without the EPS consumption process. These findings
show that EPS production does not provide a benefit to the biofilm in regards to
achieving a high cell population, which is one potential objective of the bacteria cells
residing in a biofilm. To produce EPS at the induced rate, bacteria cells have a high
nutrient demand, and if this demand is not met, colony growth cannot occur. Another
cause of low populations of high-E PS producing cells is that these expanding colonies,
with high proportions of EPS, quickly clog the channel. In contrast, low-EPS producing
non-QS biofilm colonies take much longer to grow to the point that the channel is
clogged, but the biofilm is composed primarily of cells.
In the mixed biofilm simulations, success of QS or non-QS populations was deter-
mined by proximity to the nutrient source, largely an effect of the random initial distri-
bution. In a mixed environment , clogging of the c hannel by upstream colonies may
prevent downstream colonies from rec eiving nutrients, in some cases causing their
populations to suffer declines. Resource requirements are considerably higher for high-
EPS producing cells. If an adequate nutrient supply can be secured, either by locating
a c olony near the nutrient source o r utilizing EPS as a secondary food source, then it
is possible for QS cell populations to be greater than low-EPS producing cell
populations.
Under the investi gate d conditions, we found that overall, QS-regulated EPS produc-
tion rarely provides a benefit to a biofilm with the objective of achieving a high cell
population, in compariso n to biofilms with low EPS-producing non-QS cells. However,
maximizing offspring generation is not necessarily the best strategy under all condi-
tions. EPS production would be beneficial if the objective of the bacteria cells in the
biofilm is to clog the channel. A QS biofilm colony located near the nutrient source
may use QS to increase its volume, clog the channel, and secure its supply of nutrients
while starving downst ream colonies, a nd potentially force the downstream colony to
deplete their EPS supply. This is a competitive advantage for a colony, whether it is
located in a QS biofilm (indicating intra-species competition), or i n a mixed biofilm
(inter-species competition). In any space-limited environment, such as fine sediment or
small vessels in higher organisms, channelcloggingmaybeconsideredabeneficial
strategy for bacteria cells to use. In the study [51], it was shown that biofilms develop-
ing in plants stems used QS to clog the plant vessel used for water and nutrient
Frederick et al. Theoretical Biology and Medical Modelling 2011, 8:8
/>Page 24 of 29
transportation, the so-called xylem, securing nutrients for t hemselves. Individual colo-
nies in patchy biofilm communities have an antagonistic interaction (some colonies
benefit at the expense of others) through utilization of an exploitative competition
strategy - the upstream colonies reduce nutrient resources in the environment, d eplet-
ing the resource required by the downstream colonies. If cells wish to outcompete
another cell population in a biofilm, of their own species or a different species, (QS-
controlled) EPS production can provide an advantage. The drawback is that nutrient
supply must be abundant, as high-EPS producing cells have a high nutrient demand.
Downstream cells are upregulated (partly) by AHL produced by upstream colonies.
However, it is not obvious how upstream colonies could contribute to a potential ben -
efit (e.g. protection) for downstream cells through EPS production. In this sense,
downstream cells seem to be fooled into a premature EPS production, which they
might not even be able to realize due to nutrient depletion.
The results showed that on a population level, high-EPS producing biofil ms suffered
lower cell populations. However , the spatial distributions in the 2D visualizations
demonstrated that for individual colonies, clogging the channel with biomass may be a
beneficial strategy. Individual cells within microcolonies are genetically related, and
have the ultimate objective of maintaining their own genes and reproducing in the
futur e. To optimize survival of their genes in the colonies, and ens ure survival of their
offspring, bacteria cells would be interested in supp ressing other colonies. In the event
of a structural reorganization or detachment/reattachment, the upstream colony has an
advantage, in that their genetically similar offspring will continue to succeed.
The nutrient supply, random placement of colonies, and QS had various impacts on
the resulting biofilms. QS and high-EPS producing non-QS biofilms had almost
equivalent total cell biomass under both the high and low nutrient regimes, indicating
that total cell population at the end of the simulation is predominantly controlled by
nutrients and mass transfer in the a queous phase, and not quorum sensing, which is
also supported by the experimental findings of [63]. It was found that the random pla-
cement of colonies in the initial i noculation had a small impact on when induction
occurred. Nutrient limitations succeeded induction, and led to greater variability in
total cell biomass. The impact of QS was most prominent in regards to biofilm occu-
pancy and composition. QS induction occurs very rapidly, and likewise, the QS b io-
films were able to rapidly increase their occupancy and change their composition from
that of a low EPS-producing to high EPS-producing non-QS biofilm.
We argued that EPS production benefits cells under certain conditions. The question
arisesofwhyEPSproductionwouldbeassociatedwithquorumsensing,thatis,why
would cells wait until upregulation to pr oduce EPS at higher rates, versus always pro-
ducing EPS at enhanced levels? A minimum thickness of an EPS layer is required for
effective protection of cells from a hazard, such as antibiotics and washout. If a cell
population is small, much energy would be expended to produce a layer of EPS which
may not provide adequate protection. Coupling EPS production with quorum sensing
ensures that a sufficient colony size is obtained such that the cost to produce EPS is
returned by the benefits of a protective layer. QS may then be considered a mechanism
for switching to a mode of high-EPS production once a certain num ber of cells is pre-
sent, ensuring the bacteria can protect thems elves efficiently. Rather than existing in a
Frederick et al. Theoretical Biology and Medical Modelling 2011, 8:8
/>Page 25 of 29