Báo cáo y học: "Improving the prediction of yeast protein function using weighted protein-protein interactions" pps
Bạn đang xem bản rút gọn của tài liệu. Xem và tải ngay bản đầy đủ của tài liệu tại đây (1.2 MB, 17 trang )
RESEARCH Open Access
Improving the prediction of yeast protein
function using weighted protein-protein
interactions
Khaled S Ahmed
1,3†
, Nahed H Saloma
2†
and Yasser M Kadah
3*
* Correspondence: ymk@k-space.
org
3
Department of Biomedical
Engineering, Cairo University, Giza,
(12613), Egypt
Full list of author information is
available at the end of the article
Abstract
Background: Bioinformatics can be used to predict protein function, leading to an
understanding of cellular activities, and equally-weighted protein-protein interactions
(PPI) are normally used to predict such protein functions. The present study provides
a weighting strategy for PPI to improve the prediction of protein functions. The
weights are dependent on the local and global network topologies and the number
of experimental verification methods. The proposed methods were applied to the
yeast pro teome and integrated with the neighbour counting method to predict the
functions of unknown proteins.
Results: A new technique to weight interactions in the yeast proteome is presented.
The weights are related to the network topology (local and global) and the number
of identified methods, and the results revealed improvement in the sensitivity and
specificity of prediction in terms of cellular role and cellular locations. This method
(new weights) was compared with a method that utilises interactions with the same
weight and it was shown to be superior.
Conclusions: A new method for weighting the interactions in protein-protein
interaction networks is presented. Experimental results concerning yeast proteins
demonstrated that weighting interactions integrated with the neighbor counting
method improved the sensitivity and specificity of prediction in terms of two
functional categories: cellular role and cell locations.
Background
Determining protein functions is an important challenge in the post-genomic era and
Automated Function Prediction is currently one of the most active resear ch fields. Pre-
viously, researchers have attempted to dete rmine protein functions using the structure
of the protein and comparing it with similar proteins. Similarities between the protein
and homologues from other organisms have been investigated to predic t functions.
However, the diversity of homologues meant that these time-consuming methods were
inaccurate. Other techniques to predict protein functions including analyzing g ene
exp ression patterns [1, 2], phylogenetic profiles [3-5], protein sequences [6,7] and pro-
tein domains [8,9] have been utilised, but th ese technologies have high error rates,
leading to the use of integrated multi-sources [10,11]. The comp utational approach
was designed to resolve the inaccur acy of protein prediction, using information gained
from physical and genetic interaction maps to predict protein functions. Recently,
Ahmed et al. Theoretical Biology and Medical Modelling 2011, 8:11
/>© 2011 Ahmed et al; licensee BioMed Central Ltd. This is an Open Access article distribute d under the terms of the Creative Commons
Attribution License ( which permits unrestricted use, distribution, and reproduction in
any medium, provided the origina l work is prop erly cited.
researc hers have introduced various techniques to determine the probability of protein
function prediction using information extracted from PPI. Results from these trials
have been promising, but they do not address eff ective problems including function
correlation [12-14], network topology and strength of interaction.
Network topo logy represents an interaction between proteins and the mechanism of
that interaction. Therefore, much information can be extracted from these networks
with regards to the strength of the interaction and its contribution to new function
prediction, i.e. weighted contribution. A PPI network can be described as a complex
system of proteins linked by interactions, and the computational analysis of PPI net-
works begins w ith the representation of the PPI network structure [15,16]. The sim-
plest representation takes the form of a network graph consisting of nodes and edges
[17]. Proteins are represented as nodes and two proteins that interact physically are
represented as adjacent nodes connect ed by an edge [18]. On the basis of th is graphi-
cal representation, various computational approaches including data mining, machine
learning and statistical methods can be performed to reveal the PPI networks at differ-
ent levels.
The computational analysis of PPI networks is challenging and faces major problems.
The first problem concerns the unreliability of protein interactions derived from large-
scale experiments, which have yielded numerous false positive results (Y2H). Secondly,
a protein can have more than one function and could be considered in one or more
functional groups, leading to overlapping function clusters. The third problem con-
cerns the fact that proteins with different functions may interac t. Therefore, a PPI has
connections between proteins in different functional groups, leading to expansion of
the topological complexity o f the PPI networks. Neighbour counting is a method pro-
posed by Schwi kowski et a l. [19] to infer the functions of an un-annotate d protein
from the PPI. This method l ocates the neighbour proteins and predicts their assigned
functions and the frequency of these functions; the functions are arranged in descend-
ing order according to their frequencies. The first k functions are considered and
assigned to the un-annotated protein . Some papers used this technique with k equal-
ling three. This method makes use of information from th e neighbours, but it has sev-
eral drawbacks: (1) it considers the intera ctions to be of equal wei ghts ,whichisnot
logical; (2) it does not consider the nature of the function an d whether it is dominant;
(3) it does not provide a confidence level for ass igning a function to the protein. The
problem of confi dence levels was addressed in [20], where the authors used chi-square
statistics to ca lculate significance levels on the basis of the p robability that various
functions are present. The chi-square method provides a deeper analysis than the
neighbour counting method, but it is less sensitive and specific.
Deng et al. [21] considered various situationsforthepresenceofacertainfunction
for a protein of interest: (1) number of protein s having this function; (2) number of
protei n pairs (interacting) having the functi on; (3) number of protei n pairs where one
has the function and the other does not; (4) number of protein pairs without this func-
tion. A weighted sum of these numbers is calculated according to the random Markov
field algorithm, which assigns different weights to interactions and overcomes the
above problems by considering the entire interaction network [21]. This method con-
siders the frequency of proteins having the function of interest and the neighbours,
with less weight being placed on neighbours that are further away. Therefore, it can be
Ahmed et al. Theoretical Biology and Medical Modelling 2011, 8:11
/>Page 2 of 17
used to calcul ate the probability that an un-ann ota ted protein has a function of inter-
est, and the results are more accurate than those obtained by using neighbour counting
or the chi-square method.
This paper presents a new method for predicting protein function based on estimat-
ing a weight for the strength of the interaction between proteins in the PPI. The simi-
larity between protein interactions and the connected routers in a certain autonomous
number of networks was explored. Applying the idea of a network linked list of proto-
cols such as OSPF (Open Shortest Path First) can allow information concerning sur-
rounding routers to be obtained, a ccording to t he principles of cost and level (hop
count) [22,23]. The suggested algorithm was compared with the equal weight interac-
tions method to indicate differences in the accuracy of prediction.
Results
The proposed approach was applied to infer the functions of un -annotated proteins in
yeast and used weighting interactions rather than free weigh ts (equ al interactio ns). In
YPD, proteins are assigned functions based on three criteria: “Biochemical function”,
“Subcellular location” and “Cellular role”. The numbers of annotated and un-annotated
proteins, based on the three functional categories, are presented in Table 1. The accu-
racy of the predictions was measured by the leave-one-out method. For each annotated
protein with at least one annotated i nteraction partner, it was assumed to be un-anno-
tated and functions were predicted using the weighted neighbour counting method.
The predicted results were compared with the annotations of t he protein. Repeating
the leave-one-out experiment for all such proteins allowed the specificity (SP) and sen-
sitivity (SN) to be defined [22]. The cor responding values of overlapped proteins for
“Biochemical function”, “Subcellular location” and “Cellular role” were 1145, 1129 and
1407, respectively. In the first three Figures, the relationship between sensitivity and
specificity was implemented for biochemical function, cell location and cellular role,
respectively. In terms of the prediction method ( neighbour counting method), a fixed
number of the highest frequency functions can b e compared. In the present study,
although one data set is used, k (number of interactions) had a variety of values (from
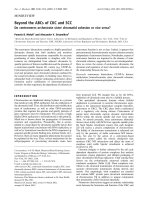
2 to 5). Figures 1a-d demonstrate the specificity and sensitivity in terms of biochemical
function when k equals 2, 3, 4 and 5. In terms of biochemical functions (Figure 1), the
sensitivity of a proposed algorithm is higher when specificity values are low. However,
for higher specificity the weightless technique (W0) has good sensitivity. Therefore, an
established technique is sufficient for predicting biochemical function. As
Table 1 The numbers of annotated and un-annotated proteins for all proteins, based on
three functional categories: Biochemical function, cellular location and subcellular role.
Biochemical function
Annotated 3353
Un-annotated 3063
cellular location
Annotated 3181
Un-annotated 3235
Sub-Cellular role
Annotated 3894
Un-annotated 2522
Ahmed et al. Theoretical Biology and Medical Modelling 2011, 8:11
/>Page 3 of 17
demonstrated in Figures 2 and 3, the sensitivity and specificity for all weights (new
suggested techniques W1-W5) were higher than W0 for all values of k. It can be
demonstrated that in the cell location function category, W2 (weight relating to IG1) is
the best weight to use when the number of interactions for each protein is two. W3
(weights for IG2), W1 (weights for number of experimental method) and W5 (PCA for
the basic three weights (W1, W2, W3)) were the best weights when the numbers of
interactions for each protein were 3, 4 or 5, respectively. Furthermore, W2 was the
best weight for the cellular role function category when the number of interactions
was two, and W3 (we ights of IG2) were the best weights for the cellular role function
category when the numbers of interactions were 3, 4 or 5. There were overlaps
betwee n some weights on the indicated curves (overlap curves), but there was a small
variation in terms of detecting these weights.
Conclusions
The majority of methods concerning the estim ation of protein functions through pro-
tein-protei n interactions (PPI) use the same weights for all interactions. Such methods
do not consider the various situations for each interaction including the number of
experimental methods used to identify the interactions, the number of leaves con-
nect ed to the interaction (whether or not the protein is sticky) and the most common
graphs for the studied species within the network. Therefore, this research introduces
new weights for protein interactions to enhance protein funct ion prediction. Thes e
weights are W1-W5, and W1 depends of the number of experimental methods that
identify the interaction. W1 has high confidence (100%) when the number of experi-
mental methods used is more than one. W2 depends on the number o f leaves
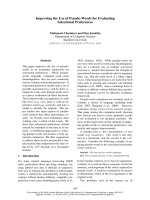
Figure 1 Biochemical function sensitivity and specificity. The sensitivity and speci ficity of the s ix
collect ed data (un-weigh ted and fi ve weights) in the biochemic al category for up to five interactions
(k = 5).
Ahmed et al. Theoretical Biology and Medical Modelling 2011, 8:11
/>Page 4 of 17
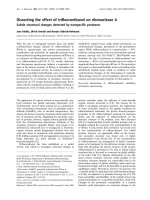
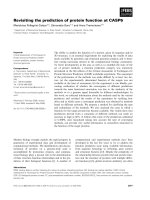
Figure 3 Cellular role function sensitivity and specificity. The sensitivity and specificity of the six
collected data (un-weighted and five weights) in cellular role category for up to five interactions (k = 5).
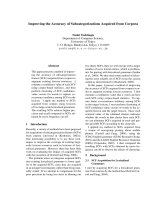
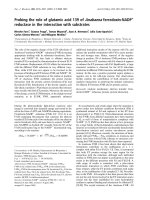
Figure 2 Cell location function sensitivity and specificity. The sensitivity and specificity of the six
collected data (un-weighted and five weights) in cell location function for up to five interactions (k = 5).
Ahmed et al. Theoretical Biology and Medical Modelling 2011, 8:11
/>Page 5 of 17
connected to the studied interactions, which indicates whether the protein is sticky or
not. The high confidence of W2 is apparent when the IG1 value is less than three (the
protein is not sticky). W3 relates to t he value of IG2, which indicates the global topol-
ogy of the network of the studied species; its value is highly confident when IG2 is less
than zero. In addition, there are two estimated weights, W4 and W5. W4 is the aver-
ageofthebasicweights(W1,W2andW3),andW5isthePCAvalueforthesame
weights. Applying the suggested weights to yeast protein functions and integrati ng
these weights with the neighbor counting method led to enhanced results in two func-
tion categories: cell location and cellular role. The sensitiv ity and specificit y of every
point on the curves of the two function categories were higher than those obtained
using the w eightless technique (free or equal weights (W0)). W3 was the best weight
to use in the cellular role category when the numbers of interactions were 3, 4 or 5.
The cell location function category did not have a common weight for all cases but i n
each case (number of interactions), there was a bette r weight compared with other
methods.
Methods
This paper introduces a novel algorithm by comparing the proteins in protein-protein
interaction networks to the connected routers in the same autonomous number of net-
working. The protein acts as a router, and the node and edge (interaction between two
proteins) act as the connection between two routers (Figures 4 and 5), where routers
have up to 100 interactions (29 interactions are the maximum in the yeast proteome).
As presented in Figure 4a, a group of routers and their movable messages are indi-
cated, and the connecte d routers are presented in Figure 4b. In Figure 5, the group of
proteins are connected using differ ent experimental methods. The routing system can
be introduced by various types of connections (LAN, WAN, Serial) as different experi-
mental methods of interactions in the protein system. Initially, the router will be una-
ware of neighbour routers on the link. Therefore, the linked state p rotocol will be
applied to the routing system, where a link is an interface on a router and the proto-
cols are the contro l system of all connected routers. The protocol includes information
concerning the interface’s IP address/mask, the type o f network (ethernet (broadcast)
or serial point-to-point link), the cost of that link and any neighbour routers on that
Figure 4 Connected routers. Presentation of connected routers in a specific network.
Ahmed et al. Theoretical Biology and Medical Modelling 2011, 8:11
/>Page 6 of 17
link. In the protein system, a generic protocol is foll owed that identifies the protein by
name (gene name, locus name, accession name etc ), ID (determined number for each
protein), sequence (amino acids in given number and order) and functions (if known).
The type of network will be elucidated; interaction between two proteins (protein pair)
or dense interactions (cluster), and the weight of the interaction (our contribution).
Furthermore, neighbours of the adjacent protein (known interactions in the network)
are identified (Table 2). The protein interactions are calculated until the second level.
The algorithm is performed following four steps: (1)- determining the level and degree
for each adjacent protein, (2)- calculating the weight (cost) for each interaction (inter-
action with high cost/weight is strong) , (3)- integrating these data to predict the func-
tion of the un-annotated proteins using th e neighbourhood countin g method, and (4)-
calculating the sensitivity and specificity for the different weights.
Protein level
There is a difference between the degree and the level of any node. The degree of a
node (protein) is defined as the total number of connected nodes or proteins directly
surrounding this node (protein A has degree equal to six) as shown in Figure 6; the
level of a node is the layer of nodes related to the main one. The directed nodes have
a level equal to o ne, and their neighbours are the second level as presented in Figure
6. The red nodes are the first level of protein A (black), the second level of proteins
are the yellow coloured nodes (n odes connected to protein’s A neighbours). The last
(third) level is the group of proteins coloured green. In router networks, the hop count
principle is performed to determine the ro uter level. In this paper, the second level
was assumed to be sufficient for extracting the most important informatio n about the
Figure 5 Connected protein nodes. Seventeen connected proteins are depicted as a part of the real
interacting proteins database, where yellow nodes are leaves (last ones in the path).
Ahmed et al. Theoretical Biology and Medical Modelling 2011, 8:11
/>Page 7 of 17
function of a protein. The concept of node level was applied to 2559 protein-protein
interactions between 6416 proteins collected from the Munich Information center of
Protein Sequences (MIPS, ) for the yeast Saccharomyces cerevisiae
[24]. As demonstrated in Figure 7, proteins with ID numbers 1913, 3246 and 3517 had
a level equal to one for the studied protein number 1, and the yellow nodes are second
degree.
Table 2 sample of proteins and their interactions
Protein ID # interactions p1 p2 p3 p4 p5 p6 p7 P8 p9 p10
32 1 3258 0 0 0 0 0 0 0 0 0
33 23 19 33 33 84 304 333 370 407 568 1065
34 17 56 475 1118 1277 2027 3350 3352 3342 3346 3347
35 0 0000000000
36 5 36 36 2557 3092 4052 0 0 0 0 0
37 0 0000000000
38 0 0000000000
39 0 0000000000
40 1 3802 0 0 0 0 0 0 0 0 0
41 3 1726 3275 386 0 0 0 0 0 0 0
42 0 0000000000
43 0 0000000000
44 0 0000000000
45 0 0000000000
46 1 3708 0 0 0 0 0 0 0 0 0
47 1 4590 0 0 0 0 0 0 0 0 0
48 0 0000000000
49 0 0000000000
50 0 0000000000
51 0 0000000000
52 0 0000000000
53 0 0000000000
Figure 6 Protei n levels. Protein A (black) and its surroundings, which were divided into three degrees or
levels (red nodes as first level, yellow as second level and green nodes as the third level).
Ahmed et al. Theoretical Biology and Medical Modelling 2011, 8:11
/>Page 8 of 17
PPI weight calculation
Protein-protein interaction weights are introduced and each interaction has a specific
weight. Three basic methods were considered i n terms of calculating the weights of all
the interactions and overcoming problems affecting the interaction network. The first
method concerns the number of experimental methods. Protein-protein interactions
are identified by high-throughput experimental methods such as Y2H [25-29], mass
spectrometry of co-immunoprecipitated protein complexes (Co-IP) [ 30,31], gene co-
expression, TAP purification cross link, co-purification and biochemical methods.
Challenging technical problems arise using the first two methods, which lead to spur-
ious interactions due to self activation in Y2H and abundant contaminants with CO-
IP. These problems lead to false positive interactions [32]. Therefore, a quantitative
method for evaluating the pathway through proteomics data is required. A number of
experimental and computational approaches have been implemented for large-scale
mapping of PPIs to realize the potential of protein networks for systems analysis. One
method utilizes multiple independent sets of training positives to reduce the potential
bias of using a single training set; this method uses association with publishing identi-
fiers or foundation in two or more species, otherwise PPIs must have an expression
correlation more than 0.6 [33]. Another technique also obtains conserved patterns of
protei n interactions in multi ple species [34]. There are several methods for dete rmin-
ing the reliability of interactions [35-38]. In this paper, the reliability or confidence is
introduced by counting the number of experimental methods for each interaction;
some interactions have been identified using m any experimental methods and others
identified by just one. In yeast proteins, approximately ten experimental methods can
Figure 7 Saccharomyces cerevisiae network. A part of the yeast Saccharomyces cerevisiae network (MIPS
database). The level of the nodes is distributed. The figure has been drawn using the Inter-Viewer program.
Ahmed et al. Theoretical Biology and Medical Modelling 2011, 8:11
/>Page 9 of 17
be used to identify prot ein-protein interactions (Edge between Protein (YBR0904) and
Protein (YDR356W) can be identified by ten experimental methods where p rotein
(AAC1) and protein (YHR005C-A) can be identified by one method). As demonstrated
in Figure 8, approximately 750 interactions from 2559 proteins have been identified by
more than one experimental method. More than half of all the interactio ns hav e been
identified by just one method (~1800 interactions); researchers have high confidence
(100%) concerning those interactions identified by more than one method and 50%
confidence for the othe rs (one method identification ). Table 3 presents the yeast pro-
tein interactions, the number of experimental methods used t o identify them and the
identification value for each one. This method does not depend on clear points on
computational algorithms, but reflects the strength of interaction from the laboratory
viewpoint. Another a pproach for estimating the reliability of ex perimental methods
concerns calculating the stability of every method.
The second method for calculating weights of interaction s is the IG1 concept (Inter-
action Generality 1) [39-41]. A new method for assessing the reliability of protein-pro-
tein interactions (local to pology) is obtained in biol ogical experiments by calcula ting
the number of proteins involved in a given interaction (number of protein leaves con-
necting to the two studied proteins incremented by one) as shown in Figure 9. IG1
assumes that complicated interaction networks are likely to be true positives. By imple-
menting the IG1 on the collected data (yeast protein interactions), the range of IG1
was between one and 21 (Figure 10), meaning that some interactions have many leaves.
Figure 8 Interactions/Experimental methods relation ships. Demonstrates the number of interactions
(edges) corresponding to the number of experimental methods (~1800 interactions can be identified by
one experimental method).
Ahmed et al. Theoretical Biology and Medical Modelling 2011, 8:11
/>Page 10 of 17
Table 3 Yeast interaction pairs, number of identification methods and type of experimental method
Protein_1 Protein_2 # Identification Method Y2H Cross-link affinity chromo precipitation assay purification in Vetro Others
YKL161C RLM1 1 1 - - - - - - -
AAC1 YHR005C-A 1 1 - - - - - -
AAD14 AAD14 1 1 - - - - - - -
AAD6 YNL201C 1 1 - - - - - - -
ABP1 ACT1 3 1 - 1 - - 1 - -
ABP1 RVS167 4 1 - - 1 - - - 2
ABP1 SRV2 3 - - - - - - 1 2
YER045C PSE1 1 1 - - - - - - -
ACC1 DMC1 1 1 - - - - - - -
ACC1 SNP1 1 1 - - - - - - -
ACE2 YNL157W 1 1 - - - - - - -
ACS2 SNP1 1 1 - - - - - - -
ACT1 ACT1 4 1 1 1 - 1 - - -
ACT1 AIP1 1 1 - - - - - - -
ACT1 BEM1 2 1 - - 1 - - - -
ACT1 BNI1 1 1 - - - - - - -
Ahmed et al. Theoretical Biology and Medical Modelling 2011, 8:11
/>Page 11 of 17
According to the IG1 concept, increasing values leads to false positive interactions. In
the suggested algorithm, it is assumed that interactions with an IG1 value less than
four (as threshold) have high confidence (100%) and those with more than four have
low confidence (Table 4). For example, the interaction between proteins YMR056C
and YHRS01C has an IG1 valu e of three (weight=100%)whentheinteraction
between proteins YMR056C and YDR167W has an IG1 value of four (weight = 50%).
Figure 10 Interactions/IG1 relationships. The relationship between the number of interactions and their
corresponding IG1values is shown. The last column indicates the number of interactions that have an IG1
of more than 10.
Figure 9 Interaction Generality 1. Part of p rotein IDs and their interactions are presented. The edge
between proteins 4 and 17 has an IG1 value of two, where the edge between proteins 7 and 14 has an
IG1 value of three.
Ahmed et al. Theoretical Biology and Medical Modelling 2011, 8:11
/>Page 12 of 17
However, the interaction betwe en proteins YDL043C and YMR117C has an IG1 value
of 21 (weight = 50%).
The third method for calculating the weight uses the IG2 concept (Interaction Gen-
erality 2), [42,43]. This algorithm explores the five major sub-graphs of a network to
obtain information concerning the global topology of the network. After collecting the
five values for each interaction according to Figure 11, principal component analysis
(PCA) has been implemented. The PCA concept for the previous major topologies of
yeast protein networks was implemented and IG2 valu es ranged from -281 up to ~27
(Table 5). By determining the threshold (19) as the margin of reliability, it is assumed
that IG2 values less than the threshold are more accurate than those above the thresh-
old. Regarding the th ree previous methods for calculating weights, high confidence
interactions can be collected compared with low confidence interactions (Figure 12).
After collecting the weights from the three previous methods (number of experimental
methods, IG1 and IG2), new weights strategies can be create d using an average of th e
three values or PCA. Five different weights for each interaction were collected. As indi-
cated in Table 6, interactions between proteins AAC1 and YHR005C-A had a W1 =
0.5, which means t hat only one method was used to identify it; W2 = 1, therefore it
hasmorethanthreeleavesinIG1(IG1<4),W3=0.5indicatingthatIG2wasmore
Figure 11 Interaction generality 2 topologies. The major five topologies related to the yeast network
topology are shown according to interaction generality two.
Table 4 The reliability score of IG1 in protein interactions
PID_1 PID_2 IG1 Reliability score
1 1913 3 1
1 3246 1 1
1 3517 4 0.5
770 0
19 33 7 0.5
19 2980 1 1
19 3384 1 1
22 2483 2 1
24 785 4 0.5
24 3258 14 0.5
25 5838 2 1
32 3258 13 0.5
33 33 0 0
33 84 7 0.5
33 304 8 0.5
33 333 8 0.5
Ahmed et al. Theoretical Biology and Medical Modelling 2011, 8:11
/>Page 13 of 17
Figure 12 High c onfidence edges. The number of high and low c onfidence edges for each method
used.
Table 5 IG2 values for yeast protein interactions
P_name 1 P_name 2 PID_1 PID_2 t1 t2 t3 t4 t5 IG2
AAC1 YHR005C-A 1 1913 0 0 0 2 2 26.94071
ANC1 SNF5 1 3246 0 0 0 3 0 26.90991
ANC1 TAF25 1 3517 0 0 164 5 3 -121.486
ABP1 ACT1 19 33 2 0 4 10 6 26.97287
ABP1 RVS167 19 2980 1 1 2 13 0 23.08996
ABP1 SRV2 19 3384 1 1 2 12 0 24.42532
YER045C PSE1 22 2483 0 0 2 3 1 24.44631
ACC1 DMC1 24 785 0 0 0 20 3 25.10544
ACC1 SNP1 24 3258 0 0 0 10 13 26.56783
ACE2 YNL157W 25 5838 0 0 0 0 1 26.8268
ACS2 SNP1 32 3258 0 0 0 7 12 26.97778
ACT1 AIP1 33 84 0 0 8 10 6 26.88486
ACT1 BEM1 33 304 0 2 20 14 7 26.97287
ACT1 BNI1 33 333 2 2 4 14 7 19.55493
ACT1 BUD6 33 370 1 1 10 22 7 7.772698
ACT1 CAP2 33 407 0 0 8 10 6 22.16398
ACT1 COF1 33 568 0 0 8 10 5 17.03328
ACT1 FUS1 33 1065 0 0 8 10 6 19.55493
ACT1 GLK1 33 1164 0 0 8 7 9 19.55002
ACT1 IQG1 33 1470 0 2 8 13 6 19.55493
ACT1 LAS17 33 1583 0 0 8 9 7 19.63262
ACT1 MYO4 33 1983 0 0 8 10 5 18.64504
ACT1 OYE2 33 2174 0 0 8 10 5 19.58083
ACT1 PFY1 33 2295 1 1 6 11 6 19.55002
ACT1 RPP2B 33 2843 0 0 8 9 7 19.55002
Ahmed et al. Theoretical Biology and Medical Modelling 2011, 8:11
/>Page 14 of 17
than 19, W4 is the average of the three weights which equalled 0.66 (1/3 Σ wi, i = 1 3),
and W5 (PCA of the three weights with threshold equal zero) was 0.5, indicating that
its value is more than zero. This example demonstrates a weak interaction (edge)
between protein ID 1 (AAC1) and protein ID 1913 (YHR005C-A). Another example
concerning high confidence is shown in the seco nd row and conc erns a protein inter-
action (edge) betw een ANC1 and SNF5, where the weights are 1, 1, 0.5, 0.8 3 and 1 for
W1, W2, W3, W4 and W5, respectively. Relating to the main three measurements,
many weights can be created by applying AND/OR processes. However, each weight
can be multiplied by the coefficient relating to the importanc e of its role in determin-
ing the edge; 0.35, - 0.2 and - 0.4 for W1, W2 and W3, respectively. The integration
was performed on the five weights explored (W1-W5). The neighbour counting
method was applied six times, once for the basic weight (e qual weights or traditional
method) and once for each of the five estimated weights.
Integration process
After collecting the levels for each protein and the five different weights, the neighbour
counting method (frequencies of interaction partners having certain functions of inter-
est) was implemented to predict the functions of unknown proteins. The new weigh ts
and weightless (edges with equal weights (W0)) algorithms were compared for proteins
having up to five interactions. This demonstrated that for most selected new weights
at a specific specificity (SP), the sensitivity (SN) was higher than obtained using W0.
As demonstrated in Figures 1, 2 and 3, the sensitivity and the specificity of the three
functi on categories of yeast (B iochemical, Cell location and Cel lular role) are indicated
respectively. Equations 1 and 2 present the basic laws of SN and SP.
Table 6 The protein interactions and their suggested weights
Protein A name Protein B name Protein A-ID Protein B-ID W0 W1 W2 W3 W4 W5
AAC1 YHR005C-A 1 1913 1 0.5 1 0.5 0.66 0.5
ANC1 SNF5 1 3246 1 1 1 0.5 0.83 1
ANC1 TAF25 1 3517 1 0.5 0.5 1 0.66 1
ABP1 ACT1 19 33 1 1 0.5 0.5 0.66 1
ABP1 RVS167 19 2980 1 1 1 0.5 0.83 1
ABP1 SRV2 19 3384 1 1 1 0.5 0.83 1
YER045C PSE1 22 2483 1 0.5 1 0.5 0.66 0.5
ACC1 DMC1 24 785 1 0.5 0.5 0.5 0.5 0.5
ACC1 SNP1 24 3258 1 0.5 0.5 0.5 0.5 0.5
ACE2 YNL157W 25 5838 1 0.5 1 0.5 0.66 0.5
ACS2 SNP1 32 3258 1 0.5 0.5 0.5 0.5 0.5
ACT1 AIP1 33 84 1 0.5 0.5 0.5 0.5 1
ACT1 BEM1 33 304 1 1 0.5 1 0.83 1
ACT1 BNI1 33 333 1 0.5 0.5 0.5 0.5 0.5
ACT1 BUD6 33 370 1 0.5 0.5 1 0.66 1
ACT1 CAP2 33 407 1 1 0.5 0.5 0.66 1
ACT1 COF1 33 568 1 1 0.5 0.5 0.66 1
ACT1 FUS1 33 1065 1 0.5 0.5 0.5 0.5 1
ACT1 GLK1 33 1164 1 1 0.5 0.5 0.66 1
ACT1 IQG1 33 1470 1 1 0.5 1 0.83 1
Ahmed et al. Theoretical Biology and Medical Modelling 2011, 8:11
/>Page 15 of 17
The sensitivity (SN) and specificity (SP) can be defined as:
SN =
k
i
k
i
k
i
n
i
(1)
Sp =
k
i
k
i
k
i
m
i
(2)
Where n
i
is the number of observed functions for protein P
i
m
i
is the number of predicted functions for protein P
i
,
and k
i
are the overlaps between them.
Author details
1
Department of Bio-electronics, MTI, El-Haddaba Elwosta, Cairo, Egypt.
2
Department of Biomedical photonics, Niles,
Giza, (12613), Egypt.
3
Department of Biomedical Engineering, Cairo University, Giza, (12613), Egypt.
Authors’ contributions
KS collected the biological data, participated data implementation and drafted the manuscript. NS participated in the
statistical analysis. YK conceived of the study, and participated in its design and coordination. All authors read and
approved the final manuscript.
Competing interests
The authors declare that they have no competing interests.
Received: 10 March 2011 Accepted: 27 April 2011 Published: 27 April 2011
References
1. Zhao XM, Wang Y, Chen L, Aihara K: Gene function prediction using labeled and unlabeled data. BMC Bioinformatics
2008, 9:57-71.
2. Zhao H, Wu B: DNA-Protein Binding and gene expression patterns. In Lecture Notes-Monograph Series. Volume 40.
Statistics and Science: A Festschrift for Terry Speed; 2003:259-274.
3. Morin M: Phylogenetic Networks Simulation, Characterization, and Reconstruction. New Mexico 2007.
4. Sun J, Zhao Z: Construction of phylogenetic profiles based on the genetic distance of hundreds of genomes.
Biochem Biophys Res Commun 2007, 355(3):849-853.
5. Pellegrini M, Marcotte EM, Thompson MJ, Eisenberg D, Yeates TO: Assigning protein functions by comparative
genome analysis: protein phylogenetic profiles. Proc Natl Acad Sci USA 1999, 96(8):4285-4288.
6. Harrington E, Singh A: Quantitative assessment of protein function prediction from meta genomics shotgun
sequences. PNAS 2007, 104(35):13913-13918.
7. Spriggs R, Murakami Y: Protein function annotation from sequence: prediction of residues interacting with RNA.
Bioinformatics 2009, 25(12):1492-1497.
8. Friedberg I: Automated protein function prediction—the genomic challenge. Bioinformatics 2006, 7(3):225-242.
9. Nariai N, Kolaczyk ED, Kasif S: Probabilistic Protein Function Prediction from Heterogeneous Genome-Wide Data.
PLoS ONE 2007, 2:e337.
10. Gupta R GT: Comparative study of various genomic data sets for protein function prediction and enhancements
using association analysis. the 7th SIAM International Conference on Data Mining; 28-30 April; Minneapolis 2007.
11. Liu Y, Kim I, Zhao H: Protein interaction predictions from diverse sources. Drug Discov Today 2008, 13(9-10):409-416.
12. Khaled S, Nahed S, Yasser K: Estimation of the correlation between protein sub-function categories based on
overlapping proteins. 27th National Radio Science conference (NRSC) 2010, 323-331.
13. Khaled S, Nahed S, Yasser K: Exploring Protein Functions Correlation Based On Overlapping Proteins and Cluster
Interactions. 1st middle east conference for biomedical engineering; 21-24 Feb; Sharqah 2011.
14. Khaled S, Nahed S, Yasser K: Determining The Relations Between Protein Sub-Function Categories Based On
Overlapping Proteins. JCC 2011.
15. Sharan R, Ulitsky I, Shamir R: Network-based prediction of protein function. Mol Syst Biol 2007, 3-88.
16. Khaled S, Nahed S, Yasser K: Comparison between different methods for protein function prediction. 1st
International Joint Conference (NRC), Cairo 2009, 116-117.
17. Wagner A: How the global structure of protein interaction networks evolves. Proc Biol Sci 2003, 270(1514):457-466.
18. Aidong Z: PROTEIN INTERACTION NETWORKS: Computational Analysis New York, Press; 2009.
19. Schwikowski B, Uetz P, Fields S: A network of protein-protein interactions in yeast.
Nat Biotechnol 2000,
18(12):1257-1261.
20.
Hishigaki H, Nakai K, Ono T, Tanigami A, Takagi T: Assessment of prediction accuracy of protein function from
protein–protein interaction data. Yeast 2001, 18(6):523-531.
Ahmed et al. Theoretical Biology and Medical Modelling 2011, 8:11
/>Page 16 of 17
21. Deng M, Zhang K, Mehta S, Chen T, Sun F: Prediction of protein function using protein-protein interaction data. J
Comput Biol 2003, 10(6):947-960.
22. Edde N: CCNA: Cisco certified network associate study guide Canada press; 2007.
23. Cisco “CCNA ICND2 Official Exam Certification Guide” USA press; 2007.
24. The yeast protein interactions database. [].
25. Dobrin N, Randall W: New and Emerging Proteomic Technique New Jersey Press; 2006.
26. McDonald PN: Two-hybrid systems. Methods and protocols. Introduction. Methods Mol Biol 2001, 177:v-viii.
27. Uetz P, Giot L, Cagney G, Mansfield TA, Judson RS, Knight JR, Lockshon D, Narayan V, Srinivasan M, Pochart P, et al: A
comprehensive analysis of protein-protein interactions in Saccharomyces cerevisiae. Nature 2000,
403(6770):623-627.
28. Ito T, Chiba T, Ozawa R, Yoshida M, Hattori M, Sakaki Y: A comprehensive two-hybrid analysis to explore the yeast
protein interactome. Proc Natl Acad Sci USA 2001, 98(8):4569-4574.
29. Tong AH, Drees B, Nardelli G, Bader GD, Brannetti B, Castagnoli L, Evangelista M, Ferracuti S, Nelson B, Paoluzi S, et al: A
combined experimental and computational strategy to define protein interaction networks for peptide
recognition modules. Science 2002, 295(5553):321-324.
30. Gavin AC, Bosche M, Krause R, Grandi P, Marzioch M, Bauer A, Schultz J, Rick JM, Michon AM, Cruciat C, et al:
Functional organization of the yeast proteome by systematic analysis of protein complexes. Nature 2002,
415(6868):141-147.
31. Ho Y, Gruhler A, Heilbut A, Bader GD, Moore L, Adams SL, Millar A, Taylor P, Bennett K, Boutilier K, et al: Systematic
identification of protein complexes in Saccharomyces cerevisiae by mass spectrometry. Nature 2002,
415(6868):180-183.
32. Mrowka R, Patzak A, Herzel H: Is there a bias in proteome research? Genome Res 2001, 11(12):1971-1973.
33. Yu J, Finley RL Jr: Combining multiple positive training sets to generate confidence scores for protein-protein
interactions. Bioinformatics 2009, 25(1):105-111.
34. Sharan R, Suthram S, Kelley RM, Kuhn T, McCuine S, Uetz P, Sittler T, Karp RM, Ideker T: Conserved patterns of protein
interaction in multiple species. Proc Natl Acad Sci USA 2005, 102(6):1974-1979.
35. Okada K: Flow model of the protein-protein interaction network for finding credible interactions. 2007, 317-326.
36. Bader JS, Chaudhuri A, Rothberg JM, Chant J: Gaining confidence in high-throughput protein interaction networks.
Nat Biotechnol 2004, 22(1):78-85.
37. Aytuna AS, Gursoy A, Keskin O: Prediction of protein-protein interactions by combining structure and sequence
conservation in protein interfaces. Bioinformatics 2005, 21(12):2850-2855.
38. Deng M, Sun F, Chen T: Assessment of the reliability of protein-protein interactions and protein function
prediction. Pac Symp Biocomput 2003, 140-151.
39. Saito R, Suzuki H, Hayashizaki Y: Interaction generality, a measurement to assess the reliability of a protein-protein
interaction. Nucleic Acids Res 2002, 30(5):1163-1168.
40. Nabieva E, Jim K, Agarwal A, Chazelle B, Singh M: Whole-proteome prediction of protein function via graph-theoretic
analysis of interaction maps. Bioinformatics 2005, 21(Suppl 1):i302-310.
41. Chua HN, Sung WK, Wong L: Exploiting indirect neighbours and topological weight to predict protein function
from protein-protein interactions. Bioinformatics 2006, 22(13):1630-1623.
42. Saito R, Tomita M: Interaction Generality, a Measurement to Assess the Reliability of a Protein-Protein Interaction.
Genome Informatics 2002, 13:324-325.
43. Saito R, Suzuki H, Hayashizaki Y: Construction of reliable protein-protein interaction networks with a new interaction
generality measure. Bioinformatics 2003, 19(6):756-763.
doi:10.1186/1742-4682-8-11
Cite this article as: Ahmed et al.: Improving the prediction of yeast protein function using weighted protein-
protein interactions. Theoretical Biology and Medical Modelling 2011 8:11.
Submit your next manuscript to BioMed Central
and take full advantage of:
• Convenient online submission
• Thorough peer review
• No space constraints or color figure charges
• Immediate publication on acceptance
• Inclusion in PubMed, CAS, Scopus and Google Scholar
• Research which is freely available for redistribution
Submit your manuscript at
www.biomedcentral.com/submit
Ahmed et al. Theoretical Biology and Medical Modelling 2011, 8:11
/>Page 17 of 17