Báo cáo y học: " Formation of translational risk score based on correlation coefficients as an alternative to Cox regression models for predicting outcome in patients with NSCLC" doc
Bạn đang xem bản rút gọn của tài liệu. Xem và tải ngay bản đầy đủ của tài liệu tại đây (1.3 MB, 13 trang )
RESEARC H Open Access
Formation of translational risk score based on
correlation coefficients as an alternative to Cox
regression models for predicting outcome in
patients with NSCLC
Wolfgang Kössler
1†
, Anette Fiebeler
2†
, Arnulf Willms
3
, Tina ElAidi
4
, Bernd Klosterhalfen
5
and Uwe Klinge
6*
* Correspondence:
6
Department of Surgery, University
Hospital RWTH Aachen, Germany
Full list of author information is
available at the end of the article
Abstract
Background: Personalised cancer therapy, such as that used for bronchia l carcinoma
(BC), requires treatment to be adjusted to the patient’s status. Individual risk for
progression is estimated from clinical and molecular-biological data using
translational score systems. Additional molecular information can improve outcome
prediction depending on the marker used and the applied algorithm. Two models,
one based on regressions and the other on correlations, were used to investigate
the effect of combining var ious items of prognostic information to produce a
comprehensive score. This was carried out using correlation coefficients, with options
concerning a more plausible selection of variables for modelling, and this is
considered better than classical regression analysis.
Methods: Clinical data concerning 63 BC patients were used to investigate the
expression pattern of five tumour-associated proteins. Significant impact on survival
was dete rmined using log-rank tests. Significant variables were integrated into a Cox
regression model and a new variable called integrative score of individual risk (ISIR),
based on Spearman’s correlations, was obtained.
Results: High tumour stage (TNM) was predictive for poor survival, while CD68 and
Gas6 pro tein expression correlated with a favourable outcome. Cox regression model
analysis predicted outcome more accurately than using each variable in isolation,
and correctly classified 84% of patients as having a clear risk status. Calculation of the
integrated score for an individual risk (ISIR), considering tumour size (T), lymph node
status (N), metastasis (M), Gas6 and CD68 identified 82% of patients as having a clear
risk status.
Conclusion: Combining protein expression analysis of CD68 and GAS6 with T, N and
M, using Cox regression or ISIR, improves prediction. Considering the increasing
number of molecular markers, subsequent studies will be required to validate
translational algorithms for the prognostic potential to select variables with a high
prognostic power; the use of correlations offers improved prediction.
Kössler et al. Theoretical Biology and Medical Modelling 2011, 8:28
/>© 2011 Kössler et al; licensee BioMed Central Ltd. This is an Op en Access article distributed under the terms of the Creative Commons
Attribution License (http://crea tivecommons.org/licenses/by/2.0), which permits unrestricted use, distribution, and reproduction in
any medium, provided the original work is properly cited.
Background
Bronchial cancer, a common malignant tumour in the western world, presents as Non-
Small Cell Lung Cancer, NSCLC, in more than 85% of cases [1]. It is the leading cause
of mortalit y in terms of malignant disorders, and its incidence is increasing [2]. The
underlying pathology is complex and numerous proteins have been described as prog-
nostic markers, demonstrating altered expression compared with healthy surrounding
lung tissue [3]. The expression pattern of epidermal growth factor receptor (EGFR)
can determine outcome and is used to influence individual therapy [4,5]. However,
only a subset of patients benefit from this specifically targeted therapy because they
have a specific mutation. Therefore, marker constellations that predict the risk for
recurrence and can aid individual-targeted treatment would be advantageous for the
majority of patients. Despite progress in microscopic and molecular analyses, the TNM
grading scale, which considers the tumour, nodes and metastases, is still the preferred
classification scheme for malignancie s [6]. However, growing knowledge concerning
several factors that are considered to improve or worsen prognosis has resulted in the
medical community facing a major challenge to define the prognostic impact of a
patient’s individual constellation.
An increasing numbe r of biomarkers that reflect the distinct aggressiveness of
tumours have been identified. Therefore, they are assumed to predict a patient’s risk of
tumour progression. For example, the Carmeliet group recently published results that
underline the promoting role of a small protein, growth arrest specific protein (Gas) 6,
for tumour metastasis in mice [7]. Previously, McCormack et al. demonstrated that
Gas 6 expression was positively correlated with favourable prognostic variables in
human breast cancer [8]. An accumu lation of tumour associated macro phag es (TAM)
in the stroma of a tumour may serve as an immunological indicator of the defence
capability of a host. However, its consequence for survival may be divergent, promoting
a good or bad prognosis [9].
Considering the complex interactions within tumours, i t is unlikely that one single
marker will be sufficient to predict outcome [10]. Therefore, prediction of prognosis
will rely on a combination of numerous clinical data concerning the individual patient,
particularly information relating to biomarkers. However, translational integration of
this large amount of information into one risk assessment is a major challenge. A mul-
tiple regression model derived from available data is the current method used to esti-
mate prognosis for a patient. However, the selection of variables is significantly
influenced by the choice of the underlying model [11]. As a possible alternative or sup-
plement, this study e mployed correlations with survival to select variables, and
weighted the individual status of each, resulting in an integrated score for an individual
risk (ISIR). The resulting ISIR score should predict the outcome, reflecting the indiv i-
dual balance between significant aggressive and protective factors.
To evaluate ISIR, the course of non-small cell lung cancer (NSCLC) was investigated
in 63 consecutive patients. In addition to TNM, the expression of several proteins
involved in tumour genesis, particularly Gas6, and the number of infiltrating macro-
phages (CD68) were analysed. In addition, the proteins Notch 3, MMP2 and COX2,
were researched to confirm their roles during chronic inflammation an d foreign body
responses [12]. Each variable was analyzed individually for its prognostic value and
subjected to multiple Cox regression analysis. The potential of the newly developed
Kössler et al. Theoretical Biology and Medical Modelling 2011, 8:28
/>Page 2 of 13
ISIR to predict outcome was evaluated by calculating receiver operating characteristics
(ROC) curves and the area under the curve (AUC). The validity of the model was eval-
uated using leave one-out cross validation.
Materials and methods
Patients
The course of 63 patients with NSCLC who were subjected to an operation between
2000 and 2002 was investigated. The local ethical committee approved the study and
written, informed consent was obtained from participants. Clinical data included
tumour grading according to TNM, level of resection R, histology, gender and age.
Immunohistochemistry
Tumour sections were evaluated for histology and protein expression by three inde-
pendent ex perts. To char acterise the tumour-host interaction, the following antibodies
were use d: CD68 mous e monoclonal antibody (Dako), Gas6 polyclonal anti-goat anti-
body (Santa Cruz), Notch3 polyclonal anti-goat antibody (Santa Cruz), Cox2 polyclonal
rabbit antibody (DCS Innovative Diagnostic Systems), MMP2 polyclonal rabbit anti-
body (Biomol). As secondary antibody we used biotinylated goat anti-rabbit for Cox2
and MMP2, goat anti-mouse for CD68, and rabbit anti-goat for Notch3 and GAS 6 (all
obtained from Dako).
For semi-quantitative analysis, a grading scale was used: 1 indicated very weak stain-
ing (<5% cells), 2 indicated weak (5-30%), 3 specified good (30-80%), and 4 indicated a
strong (>80%) staining signal. For each marker, a minimum o f five view fields were
analyzed.
Statistics
Simple descriptive statistics were computed for squamous cell carcinoma (SCC) and
adenocarcinoma (AC), separately. Tests concerning significant differences b etween the
two groups were carried out using a chi
2
test for homog eneity and Fisher’sexacttest.
For age and survival, nonparametric confidence intervals were calculated.
Each marker was considered in isolation and Kaplan-Meier curves for the various
realizations were generated. Furthermore, log-rank tests were performed to compare
survival times. Spearman correlation coefficients between survival and the various vari-
ables were computed; a p-value < 0.05 was considered significant. All variables with
significant negative or positive correlations to survival time were selected for calcula-
tion of the ISIR.
Denoting the significant aggressive variables by x
i
,i= 1, , k
1
, t he protective vari-
ables by y
j
,j=1, ,k
2
,andthesurvivaltimebyt,thenumeratorofISIRwasdefined
as the negative of the weighted average
k
1
i=1
r
S
(
x
i
, t
)
x
i
/k
1
of the aggressive variables,
where the weights r
S
(x
i
, t) were given by the Spearman correlation coefficients with the
survival time. Similarly, the denominator was defined as the weighted average
k
2
j=1
r
S
y
j
, t
y
j
/k
2
of the protective variables,
ISIR =
k
1
i=1
r
S
(
x
i
, t
)
x
i
/k
1
k
2
j=1
r
S
y
j
, t
x
j
/k
2
Kössler et al. Theoretical Biology and Medical Modelling 2011, 8:28
/>Page 3 of 13
Inserting the realizations of the variables for any patient resulted in an individual
ISIR score, with large values for ISIR indicating high risk.
For the evaluation of ISIR a classification table of prognosis was computed and, as
reported by Chen et al., three survival groups were defi ned: ≤ 12, between 12 and 60,
and ≥ 60 months [13]. Furthermore, three ISIR classes were defined, where ISIR ≤ 0.25
denotes low risk, ≥ 0.5 high risk, and ISIR between 0.25 and 0.5 intermediate risk. The
Spearman correlation of ISIR to survival was calculated, and scatter plots of the two
variables were retrieved. Classification tables were computed with estimates of the sen-
sitivities and specificities. Integrating all fe atures of int erest into ISIR, t he fact that the
different variables have different scale measures (0 to 3 for N, 1 and 2 for M and H,
1-4 for the other) had to taken into consideration. Therefore, each variable was divided
by the number of their possible realizations (i.e. by two for M and H, by four f or the
others).
To emphasize th e power of ISIR, it was compared with the well-established Cox
method. In Cox regression, we have the so-called proportional hazards model (the Cox
model) l(t,X)=l
0
(t)exp(Xb), where l(t,X) is the hazard rate at time point t and with
given vector X of covariates. The baseline hazard and l
0
(t) the vector b of regression
coefficients are estimated. It is very common to use automatic backward variable selec-
tion, and variables are removed from the model when p > 0.05.
The statistical analysis was carried out using the Statistical Package for Social
Sciences Software (SPSS, vers. 17.0) and with the Statistical Analysis System ( SAS,
vers. 9.2).
Results
Descriptive statistics
Descriptive statistics are summarized in Table 1. Patient survival was comparable for
squamous cell carcinoma and adenocarcinoma, with 50% mortality in each group
approximately 20 m onths after diagnosis. Survival of the 12 censored patient s was
between 54 and 101 months, with a median of 91 months. No gender-specific survival
differences were iden tifi ed. Patients with adeno carcinoma were genera lly young er and
had advanced disease with metastases more often than patients with squamous cell
carcinoma. No differences in terms of age, gender, tumour size, nodulus, pa tient survi-
val or censoring status were noted. The number of patients in the three prognosis
groups was determined: those who did not survive 12 months, those with unambigu-
ous prognosis who survived for more than 12 months but less than 60 months, and
those who survived 60 months or longer.
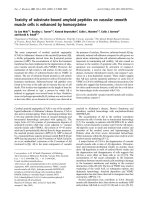
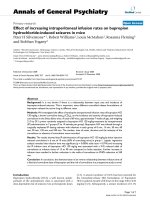
Log-rank tests confirmed significant effects o n survival with p < 0.001 for T, M, and
CD68, p < 0.005 for N, Cox2 and Notch3, and p < 0.05 for Gas6. For the variables T,
Gas6 and CD68, Kaplan-Meier curves (Product Limit Survival Estimates) are presented
in Figure 1.
Significant (p < 0.05) Spearman correlation coe fficients with survival were obtained
for T (r
s
=-0.55),N(r
s
= -0 .41), M (r
s
= -0 .37), and for Gas6 (r
s
= 0.31) and CD68 (r
s
= 0.32), but not for the other proteins or clinical variables (age, gender, histology,
MMP2, Cox2, Notch3). Table 2 summarizes the relationship between survival time and
TNM status and protein expression, and the AUC to predict a survival of ≤12 and ≥
60 months for every variable.
Kössler et al. Theoretical Biology and Medical Modelling 2011, 8:28
/>Page 4 of 13
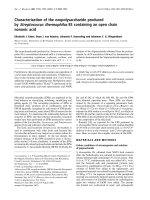
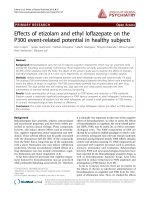
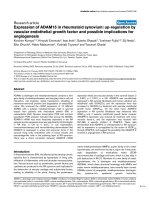
Expression patterns of Gas6 and CD68
Gas6 expression revealed a staining pattern inside the stroma. Positive signals we re con-
fined to macrophages, while the tumours themselves were not stained; comparable stain-
ing patterns were evident in squamous cell carcinoma and adenocarcinoma (Figure 2).
Macrophages expressing CD68 are central to the innate immune response. All tumour
samples for squamous cell carcinoma and adenocarcinoma expressed CD68 (alveolar
macrophages in the stroma of the tumours, and healthy lung tissue) (Figure 2).
Table 1 Descriptive statistics for the patients
Squamous cell carcinoma Adenocarcinoma
Gender
Male 28 28
Female 3 4
Tumour size T
T1 7 8
T2
T3
13
10
13
8
T4 1 2
Nodal status N
N0 18 13
N1 7 10
N2 4 7
N3 1 2
Metastasis M*
M0 31 22
M1 0 10
CD68
II: 5-30% 2 1
III: 30-80% 29 31
Gas6
I: < 5% 19 16
II 5-30% 10 14
III 30-80% 2 2
Cox2
II: 5-30% 3 2
III: 30-80% 28 30
MMP2 *
II: 5-30% 15 5
III: 30-80% 16 27
Notch3
II: 5-30% 4 6
III: 30-80% 27 26
Survival status at census
Dead 23 28
Alive 8 4
Medians (nonparametric 95% confidence interval)
Age 70 (65-71) 64 (59-69)
Survival time (month) 25 (14-71) 16.5 (11-34)
Demographic data from 63 patients with NSCLC, separated for histology; * marks significant differences in relation to
histology.
Kössler et al. Theoretical Biology and Medical Modelling 2011, 8:28
/>Page 5 of 13
A
B
C
Figure 1 Product Limit Survival Estimates illustrate the significant impact of T, CD68 and Gas6 (Log
rank) on survival of BC.
Kössler et al. Theoretical Biology and Medical Modelling 2011, 8:28
/>Page 6 of 13
Integrated Score for an Individual Risk (ISIR)
Assessing risk as a balance of collaborating aggressive and protective variables, the ISIR
was calculated as a ratio of weighted sums of signi ficant aggressive (in view of patient
survival; from our data T, N, M) and protective (CD68, Gas6) variables. The status of
censoring was ignored, but for the present data long survival times were evident for all
censored observations. Therefore, the effect of censoring was minimal.
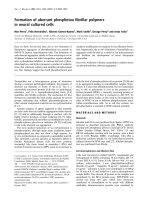
The Spearman correlation of ISIR to survival was r
S
=-0.63; the absolute value was
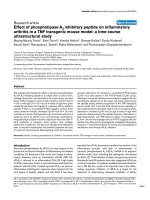
larger than that for any single variable. Figure 3A demonstr ates a scatterplot of ISIR to
survival time. In Table 3 the patients are divided into the three groups with clear prog-
nostic assignment according to their individual ISIR-score, i.e. survival ≤ 12, between
Table 2 Spearman correlation of survival and AUC for various variables (ability to
differentiate between survival of ≤ 12 months and ≥ 60 months)
Variable r
S
AUC
T - 0.55 0.82
N - 0.41 0.80
M - 0.37 0.64
Gas6 0.31 0.71
CD68 0.32 0.57
Notch3 0.23 0.62
MMP2 0.00 0.50
Cox2 0.25 0.57
ISIR - 0.63 0.90
Cox - 0.70 0.94
Figure 2 Immunohistolog ical staining of SCC and AC for Gas 6 and CD68. Immunohistochemistry for
CD68 and Gas6 in representative tumour samples from patients with squamous cell carcinoma (SCC) and
adenocarcinoma (AC); 200 × magnification.
Kössler et al. Theoretical Biology and Medical Modelling 2011, 8:28
/>Page 7 of 13
Survival
0
10
20
30
40
50
60
70
80
90
100
110
Cox
-8 -7 -6 -5 -4 -3 -2
Survival
0
10
20
30
40
50
60
70
80
90
100
110
ISIR
0123
ISIR
0
1
2
3
Cox
-8 -7 -6 -5 -4 -3 -
2
survival
g
rou
p
s
t
12
12 < t < 60
t
60
Figure 3 Relationship between ISIR and Cox. The respective scatter plots for ISIR (A) and Cox (B), and
survival for Cox and ISIR (C), are presented. For the latter, the scatter plot illustrates the monotone
dependence between the two classification methods, with those who survive longer in the bottom left
and those who survive for a short period in the upper right.
Kössler et al. Theoretical Biology and Medical Modelling 2011, 8:28
/>Page 8 of 13
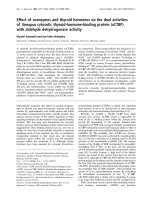
12 and 60, and ≥ 60 months. The abilities of ISIR to predict the two survival groups, ≤
12 and ≥ 60, are presente d as RO C curves in Figure 4. The estimated AUC was 0.901.
Using the intuitive and handy cut-off value of ISIR = 0.5, the two ISIR classes were
defined as “good” if ISIR≤0.5, and as “bad” if ISIR>0.5; 31 of 38 (19 of 21 and 12 of 17)
cross validated patients were classified correctly (Table 4).
Cox regression
The regression parameter b =(b
1
, b
k
) in the proportional hazards model (Cox
model) was estimated using the method of Maximum Likelihood , with the p rocedure
PHREG from the SAS software. Backward selection was used, and variables remained
in the model if th e corresponding p-valu e was less than 0.05. The remaining variables
were (together with their estimated regression coefficients): T (0.88), CD6 8 (-1.60),
Gas6 (-0.78), histology (0.68) and Notch3 (-0.80). Perhaps somewhat surprisingly, M
and N were not significant in the Cox model. Large values of
X
ˆ
β
indicate short
survival.
Table 3 Survival of patients assessed with ISIR
t ≤ 12 12 > t < 60 t ≥60
Low risk, ISIR < 0.4 1 3 10 14
0.4 ≤ ISIR ≤ 0.8 7 13 7 27
High risk, ISIR > 0.8 12 8 0 20
20 24 17 61
Survival time (months) is abbreviated to t. ISIR = (0.55*T/4 + 0.41*N/4 + 0.37*M/2)/3/(( 0.31*Gas6/4 + 0.32*CD68/4)/2)
Figure 4 Cox and ISIR prediction of long-term survival is superior to single markers in patients
with NSCLC. The plot illustrates the ROC with true (sensitivity) and false positive (1-specificity) rates of the
introduced formula applied to patients with non-small cell lung carcinoma: theoretical reference line of no
discrimination, thin continuous; ROCs using T-, N-, M-status, COX-model and ISIR score (assembling TNM
with CD68+Gas6 expression).
Kössler et al. Theoretical Biology and Medical Modelling 2011, 8:28
/>Page 9 of 13
The term
X
ˆ
β
wasreplacedbythetermCoxweconsideredtobemoreinstructive.
Figure 3B presents a scatter plot of the relationship between Cox and survival time.
The Spearman correlation between Cox and survival was -0.70, comparable to that
obtained for ISIR. Figure 3C presents a scatter plot o f ISIR and Cox. It illustrates the
monotone dependence between the two classification methods. Furthermore, as
expected, patients with long survival are shown in the bottom left region (indicated
with +), and patients with short survival are represented in the upper r ight region
(indicated by *). The ability of Cox to predict t he two survival groups, ≤ 12 and ≥ 60
months, was represented as an ROC curve in Figure 4. The estimated A UC was 0. 935.
Similar to ISIR, Cox was calculated for three risk classes. Here, two o bserv ations were
classified wrongly (in ISIR it was one, cf. Table 5).
The cut-off value for Cox was -5.5 (cf. Table 4). Taking this cut-off value, 32 of 38
(14/17 and 18/21) cross-validated patients were represented in the survival classes ≤ 12
and ≥ 60 months, which were classified correctly.
Discussion
Response to therapy and the corresponding outcome o f patients with bronchial carci-
noma varies considerably, underlining the requirement for a personalised approach.
For the most part, the individual risk profile is estimated from clinical information
such as tumour stage. However, rapid advances in biomarker research suggest that
tumour aggressiveness and immunological competence of the host must be considered.
An increasing number of biomarkers are available for the differentiat ion of subgroups;
the impact of each, whether positive or negative, is predominantly defined by compari-
sons between patients with a similar TNM status. Considering that several factors
influence prognosis and the huge variety of individual constellations, an algorithm to
form integrative risk scores is required.
This study confirmed that survival after resection of a non-small cell lung cancer is
significantly reduced when the TNM status is improved; in contrast, marked expres-
sions of CD68 and Gas6 as biological markers of the tumour ’s inflammatory reaction
were associated with a favourable outcome . Furthermore, compared with individual
Table 4 Sensitivities and specificities of the ISIR and Cox methods
Prognosis not defined
12 >t <60
False positive
t ≥ 60
True
Positive
t ≤ 12
True negative
t ≥ 60
False negative
t ≤ 12
Prognosis not defined
12 >t <60
ISIR > 0.5 (n = 42) ISIR ≤ 0.5 (n = 19)
19/24 5/17 18/20 12/17 2/20 5/24
Cox > 5.5 (n = 38) Cox ≤5.5 (n = 24)
17/25 3/17 18/20 14/17 2/20 8/25
Survival time (months) is abbreviated to t.
Table 5 Patient survival according to Cox classification
t ≤ 12 12 < t < 60 t ≥60
Low risk, Cox < - 6 2 3 11 16
-6≤ Cox ≤ - 4.5 10 17 6 33
High risk, Cox > - 4.5 8 5 0 13
20 25 17 62
Survival time (months) is abbreviated to t. Cox = 0.88*T + 0.68*Histology - 1.60*CD68 - 0.78*Gas6 - 0.80*Notch3
Kössler et al. Theoretical Biology and Medical Modelling 2011, 8:28
/>Page 10 of 13
markers, integrative models comprising clinical and molecular information provided a
higher predictive power to estimate patient prognosis, regardless of whether correlation
or regression analysis was used.
In an attempt to characterize the immunological defence of the host, the expression
of various proteins involved in numerous physiological pathways related to inflamma-
tion and remodelling were analysed. Whether increased expression reflects a favourable
outcome is open to debate. For example, expression of Gas6 appears to be beneficial
for breast cancer patients but indicates poor prognosis for gastric cancer [8,14,15]. For
tumour-as sociated macrophages (TAM) several functions have been described [16,17].
The observations presented herein are in line with those of Ohri et al. and Kawai et
al.; each group observed an improved prognosis related to CD68 expression in NSCLC
[18,19]. The expression of Notch was significantly related to longer survival in the Cox
model. This agrees with the observation of Dang et al., who described over-expression
of Notch in NSCLC [20]. However, it is in contrast to the findings of Konishie et al.
They reported that MRK-003 inhibited Notch3 signalling, reduced tumour cell prolif-
eration and induced apoptosis in human lung cancer, indicating that reduced Notch
expression may be advantageous to the patient [21]. In summary, indic ators of tumour
and host biology such as Gas6, CD68 and Notch are helpful for improving the pred ic-
tion of prognosis after NSCLC, but MMP2 and Cox2 were of no clinical valu e in the
present study. No single factor could provide sufficient predictive power. However,
CD68 and GAS6 expression may provide valuable information for an over-all assess-
ment of patient risk.
The increase in information thought to be relevant to a patient ’ s prognosis makes it
very difficult to estimate the individual’ s outcome without condensing all the factors
into an integrative risk score. However, research is required into how the best variables
for modelling should be selected, and how they should be weighted for optimum pre-
diction of the patient’s individual outcome.
Currently, Cox regression is the gold standard for prognostic modelling in cancer
[10,22]. However, the selection of potentially influential variables largely depends on
the type of optimization and is often unrelat ed to clinical experience [23]. Cox regres-
sion usually results in an abstract algorithm, which is o ptimised for prediction in a
defined collective and can hardly be repeated with distinct cohorts. Whereas the pre-
dictive power of any single variable including tumour size was limited, integration of
molecular i nformation into a unifying Cox score identified 84% of pat ients (32 of 38)
with a clear prognosis, good or bad. Backward variable selection in a Cox model veri-
fied tumour s ize and histolog y, and the three molecular m arkers CD68, Gas6, and
Notch3, as relevant factors. TNM had a significant impact on survival using univariate
tests, but there was no significant effect of N and M in the Cox model, which is in
acco rdance with the ob servation of Tsui et al. for renal cell carcinoma. Using a multi-
ple analysis with a Cox proportional hazards model, these authors discovered that
tumour stage demonstrated no independent impact on renal cell carcinoma prognosis
[24]. In a Cox model to predict survival of patients with gastric cancer, no indepen-
dently significant relevance of UICC stage was apparent [25].
The ISIR is a simple and easily extendable score. The use of correlation coeffic ients
for selecting and weighting the variables is based on the assumption that any close
functional linkage to survival is reflected by significant correlations, negative in the
Kössler et al. Theoretical Biology and Medical Modelling 2011, 8:28
/>Page 11 of 13
case of shortening survival and positive when indicating longer survival. In fact, a scor-
ing system that uses correl ations is able to pr edict outcome quite as good as a model-
ling based on Cox regressions. ISIR identified 82% of patients with clearly bad or goo d
prognosis using significant correlations of survival time, with T, N and M being aggres-
sive factors and CD68 and GAS6 being protective factors. By including informatio n
relating to molecular markers and clinical stage, the prediction for five year survival
was significantly better than that obtained with each single marker, reaching an area
under the curve (AUC) of 0.90, which reflects an acceptable predictive power
[11,26,27]. Extended gene profiling using Microarrays may not achieve a better out-
come prediction; e.g. in breast cancer, microarray performed in a range for AUC of 0.6
- 0.8 [28].
The ISIR score considers the number of variables and the number of possible expres-
sion levels. Furthermore, standardisation should help to define general cut-offs that can
be transferred to other collectives. However, in the present ISIR, possible close inter-
ferences among the variables were n ot considered. Therefore, the impact of a com-
pound may be overestimated in the case of closely-linked variables with similar
functions. It has to be noted that ISIR (and Cox) were evaluated using cross validation.
Therefore, the ISIR concerns unbiased estimates of specificity and sensitivity.
The s tatu s of genes and proteins must be conside red as parts of complex networks
rather than of simple linear pathways [29]. Correspondingly, the absol ute value of any
single marker cannot serve as a reliable estimate of a risk constellation without consid-
ering additional interfering and protective influences [26,30]. As a consequence, the
expression of biomarkers and clinical information requires integration into comprehen-
sive translational assessments of the patient’ s risk constellation. The ISIR algorithm
and the Cox model use all available information including non-clinical information
from genes and proteins, therapeutic interventions and genetic polymorphism or co-
morbidities. Therefore, this study presented the ISIR as a novel method for data analy-
sis and applied it to predict disease o utcome in a small cohort of patients with bron-
chial carcinoma. Estimations of the immunological balance of Gas6 and CD68 may
supplement other established tumour markers, but their impact on survival will require
confirmation in prospective studies.
Acknowledgements
We grateful thank E. Krott for her assistance in performing the tissue stainings.
Author details
1
Institute of Computer Science, Humboldt University, Berlin, Germany.
2
Department of Nephrology and Hypertension,
Medical School Hannover, Germany.
3
Surgical Department of the Military Hospital, Koblenz, Germany.
4
Experimental
Medicine and Immunotherapy, Institute for Applied Medical Technology, University Hospital RWTH Aachen, Germany.
5
Department of Pathology, Hospital Düren, Germany.
6
Department of Surgery, University Hospital RWTH Aachen,
Germany.
Authors’ contributions
WK performed statistical analysis of the data and prepared the manuscript. AF basically was involved in the design of
the study, evaluated and interpreted the tissue data, together with WK she drafted the manuscript. BK controlled the
tissue results, AW provides clinical data, tissue specimen, AT performs immunhistochemistry. UK Conceived and
designed the research, worked on the interpretation of data and introduced the conception of ISIR.
All authors read and approved the final manuscript.
Declaration of competing interests
The authors declare that they have no competing interests.
Received: 26 April 2011 Accepted: 27 July 2011 Published: 27 July 2011
Kössler et al. Theoretical Biology and Medical Modelling 2011, 8:28
/>Page 12 of 13
References
1. Cetin K, Ettinger DS, Hei YJ, O’Malley CD: Survival by histologic subtype in stage IV nonsmall cell lung cancer based
on data from the Surveillance, Epidemiology and End Results Program. Clin Epidemiol 2011, 3:139-148.
2. Pirozynski M: 100 years of lung cancer. Respir Med 2006, 100:2073-2084.
3. D’Amico TA, Massey M, Herndon JE, Moore MB, Harpole DH Jr: A biologic risk model for stage I lung cancer:
immunohistochemical analysis of 408 patients with the use of ten molecular markers. J Thorac Cardiovasc Surg
1999, 117:736-743.
4. Cerny T, Barnes DM, Hasleton P, Barber PV, Healy K, Gullick W, Thatcher N: Expression of epidermal growth factor
receptor (EGF-R) in human lung tumours. Br J Cancer 1986, 54:265-269.
5. Wheatley-Price P, Shepherd FA: Epidermal growth factor receptor inhibitors in the treatment of lung cancer: reality
and hopes. Curr Opin Oncol 2008, 20:162-175.
6. Goldstraw P, Ball D, Jett JR, Le Chevalier T, Lim E, Nicholson AG, Shepherd FA: Non-small-cell lung cancer. Lancet 2011.
7. Loges S, Schmidt T, Tjwa M, van Geyte K, Lievens D, Lutgens E, Vanhoutte D, Borgel D, Plaisance S, Hoylaerts M,
Luttun A, Dewerchin M, Jonckx B, Carmeliet P: Malignant cells fuel tumor growth by educating infiltrating
leukocytes to produce the mitogen Gas6. Blood 2010, 115:2264-2273.
8. Mc Cormack O, Chung WY, Fitzpatrick P, Cooke F, Flynn B, Harrison M, Fox E, Gallagher E, Goldrick AM, Dervan PA, Mc
Cann A, Kerin MJ: Growth arrest-specific gene 6 expression in human breast cancer. Br J Cancer 2008, 98:1141-1146.
9. Bingle L, Brown NJ, Lewis CE: The role of tumour-associated macrophages in tumour progression: implications for
new anticancer therapies. J Pathol 2002, 196:254-265.
10. Nativ O, Sabo E, Madeb R, Halachmi S, Madjar S, Moskovitz B: Prognostic score for patients with localized renal cell
carcinoma treated by nephrectomy. Isr Med Assoc J 2001, 3:24-27.
11. Harrell FE Jr, Lee KL, Mark DB: Multivariable prognostic models: issues in developing models, evaluating
assumptions and adequacy, and measuring and reducing errors. Stat Med 1996, 15:361-387.
12. Klink CD, Binnebosel M, Kaemmer D, Schachtrupp A, Fiebeler A, Anurov M, Schumpelick V, Klinge U: Comet-tail-like
inflammatory infiltrate to polymer filaments develops in tension-free conditions. Eur Surg Res 2011, 46:73-81.
13. Chen HY, Yu SL, Chen CH, Chang GC, Chen CY, Yuan A, Cheng CL, Wang CH, Terng HJ, Kao SF, Chan WK, Li HN,
Liu CC, Singh S, Chen WJ, Chen JJ, Yang PC: A five-gene signature and clinical outcome in non-small-cell lung
cancer. N Engl J Med 2007, 356:11-20.
14. Hafizi S, Dahlback B: Gas6 and protein S. Vitamin K-dependent ligands for the Axl receptor tyrosine kinase
subfamily. FEBS J 2006, 273:5231-5244.
15. Sawabu T, Seno H, Kawashima T, Fukuda A, Uenoyama Y, Kawada M, Kanda N, Sekikawa A, Fukui H, Yanagita M,
Yoshibayashi H, Satoh S, Sakai Y, Nakano T, Chiba T: Growth arrest-specific gene 6 and Axl signaling enhances
gastric cancer cell survival via Akt pathway. Mol Carcinog 2007, 46:155-164.
16. Coussens LM, Werb Z: Inflammation and cancer. Nature 2002, 420:860-867.
17. Mantovani A: Cancer: Inflaming metastasis. Nature 2009, 457:36-37.
18. Kawai O, Ishii G, Kubota K, Murata Y, Naito Y, Mizuno T, Aokage K, Saijo N, Nishiwaki Y, Gemma A, Kudoh S, Ochiai A:
Predominant infiltration of macrophages and CD8(+) T Cells in cancer nests is a significant predictor of survival in
stage IV nonsmall cell lung cancer. Cancer 2008, 113:1387-1395.
19. Ohri CM, Shikotra A, Green RH, Waller DA, Bradding P: Macrophages within NSCLC tumour islets are predominantly
of a cytotoxic M1 phenotype associated with extended survival. Eur Respir J 2009, 33:118-126.
20. Dang TP, Gazdar AF, Virmani AK, Sepetavec T, Hande KR, Minna JD, Roberts JR, Carbone DP: Chromosome 19
translocation, overexpression of Notch3, and human lung cancer. J Natl Cancer Inst 2000, 92:1355-1357.
21. Konishi J, Kawaguchi KS, Vo H, Haruki N, Gonzalez A, Carbone DP, Dang TP: Gamma-secretase inhibitor prevents
Notch3 activation and reduces proliferation in human lung cancers. Cancer Res 2007, 67:8051-8057.
22. van Ramshorst GH, Nieuwenhuizen J, Hop WC, Arends P, Boom J, Jeekel J, Lange JF: Abdominal wound dehiscence in
adults: development and validation of a risk model. World J Surg 2009, 34:20-27.
23. Mallett S, Royston P, Dutton S, Waters R, Altman DG: Reporting methods in studies developing prognostic models in
cancer: a review. BMC Med 2010, 8:20.
24. Tsui KH, Shvarts O, Smith RB, Figlin R, de Kernion JB, Belldegrun A: Renal cell carcinoma: prognostic significance of
incidentally detected tumors. J Urol 2000, 163:426-430.
25. Klinge U, Ackermann D, Lynen-Jansen P, Mertens PR: The risk to develop a recurrence of a gastric cancer-is it
independent of time? Langenbecks Arch Surg 2008, 393:149-155.
26. Veltri RW, Miller MC, An G: Standardization, analytical validation, and quality control of intermediate endpoint
biomarkers. Urology 2001, 57:164-170.
27. Wenske S, Korets R, Cronin AM, Vickers AJ, Fleisher M, Scher HI, Pettersson K, Guillonneau B, Scardino PT, Eastham JA,
Lilja H: Evaluation of molecular forms of prostate-specific antigen and human kallikrein 2 in predicting biochemical
failure after radical prostatectomy. Int J Cancer 2009, 124:659-663.
28. Yasrebi H, Sperisen P, Praz V, Bucher P: Can survival prediction be improved by merging gene expression data sets?
PLoS One 2009, 4:e7431.
29. Baudot A, Gomez-Lopez G, Valencia A: Translational disease interpretation with molecular networks. Genome Biol
2009, 10
:221.
30. Behrends C, Sowa ME, Gygi SP, Harper JW: Network organization of the human autophagy system. Nature 2010,
466:68-76.
doi:10.1186/1742-4682-8-28
Cite this article as: Kössler et al.: Formation of translational risk score based on correlation coefficients as an
alternative to Cox regression models for predicting outcome in patients with NSCLC. Theoretical Biology and
Medical Modelling 2011 8:28.
Kössler et al. Theoretical Biology and Medical Modelling 2011, 8:28
/>Page 13 of 13