Báo cáo y học: " Defining the buffering process by a triprotic acid without relying on stewart-electroneutrality considerations" pps
Bạn đang xem bản rút gọn của tài liệu. Xem và tải ngay bản đầy đủ của tài liệu tại đây (697.99 KB, 11 trang )
RESEARCH Open Access
Defining the buffering process by a triprotic acid
without relying on stewart-electroneutrality
considerations
Minhtri K Nguyen
*
, Liyo Kao and Ira Kurtz
* Correspondence:
Division of Nephrology, UCLA, Los
Angeles, CA, USA
Abstract
Upon the addition of protons to an aqueous solution, a component of the H
+
load
will be bound i.e. buffered. In an aqueous solution containing a triprotic acid, H
+
can
be bound to three different states of the acid as well as to OH
-
ions that are derived
from the auto-ionization of H
2
O. In quantifying the buffering process of a triprotic
acid, one must define the partitioning of H
+
among the three states of the acid and
also the OH
-
ions in solution in order to predict the equilibrium pH value. However,
previous quantitative approaches that model triprotic acid titration behaviour and
used to predict the equilibrium pH rely on the mathematical conven ience of
electroneutrality/charge balance considerations. This fact has caused confusion in the
literature, and has led to the assumption that charge balance/electroneutrality is a
causal factor in modulating proton buffering (Stewart formulation). However, as we
have previously shown, although charge balance can be used mathematically as a
convenient tool in deriving various formulae, electroneutrality per se is not a
fundamental physicochemical parameter that is mechanistically involved in the
underlying buffering and proton transfer reactions. The lack of distinction between a
mathematical tool, and a fundamental physicochemical parameter is in part a reason
for the current debate regarding the Stewart formulation of acid-base analysis. We
therefore posed the following question: Is it possible to generate an equation that
defines and predicts the buffering of a triprotic acid that is based only on H
+
partitioning without incorporating electroneutrality in the derivation? Towards this
goal, we derived our new equation utilizing: 1) partitioning of H
+
buffering; 2)
conservation of mass; and 3) acid-base equilibria. In validating this model, we
compared the predicted equilibrium pH with the measured pH of an aqueous
solution consisting of Na
2
HPO
4
to which HCl was added. The measured pH values
were in excellent agreement with the predictions of our equation. Our results
provide further important evidence that one can mathematically model the
chemistry of acid-base phenomenology without relying on electroneutrality (Stewart
formulation) considerations.
Keywords: acid, base, proton, Stewart
Nguyen et al. Theoretical Biology and Medical Modelling 2011, 8:29
/>© 2011 Nguyen et al; licensee BioMed Central Ltd. This is an Open Access article d istributed under the terms of the Creative Commons
Attribution License (http://creativecom mons.org/licenses/by/2.0), which permits unrestricted use, distribu tion, and reproduction in
any medium, provided the original work is properly cited.
Previous quantitative approaches have been derived t hat can accurately model the
buffering process of a triprotic acid [1,2]. For example, electroneutrality requirement
is a common mathematical tool that can be utilized to calculate the equilibrium pH
of a triprotic acid-containing solution [2]. The n-bar equation is another mathemati-
cal tool used in modeling the buffering process of a triprotic acid which is derived
based on the total bound proton fraction [1]. However, these previous mathematical
approaches do not mechanistically define the partitioning of excess H
+
among the
three different states of the acid as well as to OH
-
ions that are derived from the
auto-ionization of H
2
O. In this article, we present a new mathematical model that
can mechanistically define the buffering process of a triprotic acid based on proton
partitioning. We validate the model by comparing the predicted pH with the mea-
sured pH of a Na
2
HPO
4
-containing aqueous solution being titrated by HCl.
Defining Proton Buffering by Triprotic Acids: Triprotic Acid Buffering Equation
H
+
+ A
−3
HA
−
2
Let a = concentration of excess H
+
buffered by A
-3
H
+
+ HA
−2
H
2
A
−
1
Let b = concentration of excess H
+
buffered by HA
-2
H
+
+ H
2
A
−1
H
3
A
Let c = concentration of excess H
+
buffered by H
2
A
-1
H
+
+ OH
−
H
2
O
Let d = concentration of excess H
+
buffered by OH
-
[
A
−3
]
e
=
[
A
−3
]
i
−
a
(1)
∴ a =
[
A
−3
]
i
−
[
A
−3
]
e
(1a)
[HA
−2
]
e
=[HA
−2
]
i
+ a − b
=
[
HA
−2
]
i
+
[
A
−3
]
i
−
[
A
−3
]
e
−
b
(2)
∴ b =
[
HA
−2
]
i
−
[
HA
−2
]
e
+
[
A
−3
]
i
−
[
A
−3
]
e
(2a)
[
H
3
A
]
e
=
[
H
3
A
]
i
+
c
(3)
∴ c =
[
H
3
A
]
e
−
[
H
3
A
]
i
(3a)
[
OH
−
]
e
=
[
OH
−
]
i
−
d
(4)
∴ d =[OH
−
]
i
− [OH
−
]
e
=[OH
−
]
i
−
K
w
[H
+
]
e
(4a)
where the suffix “ e“ stands for “equilibrium”, suffix “i“ stands for “ initial”,andK’w
represents the dissociation constant of H
2
O.
Nguyen et al. Theoretical Biology and Medical Modelling 2011, 8:29
/>Page 2 of 11
Equilibrium [H
+
] must be equal to the difference between the initial [H
+
]andthe
sum of the concentrations of H
+
buffered by each proton acceptor site:
[
H
+
]
e
=
[
H
+
]
i
− a − b − c −
d
(5)
[
H
+
]
e
=
[
H
+
]
i
+
[
A
−3
]
e
−
[
A
−3
]
i
+
[
HA
−2
]
e
−[HA
−2
]
i
− [A
−3
]
i
+[A
−3
]
e
+[H
3
A]
i
− [H
3
A]
e
+
[
OH
−
]
e
−
[
OH
−
]
i
(5a)
[
H
+
]
e
=
[
H
+
]
i
+2
[
A
−3
]
e
− 2
[
A
−3
]
i
+
[
HA
−2
]
e
−[HA
−2
]
i
+[H
3
A]
i
− [H
3
A]
e
+
K
w
[H
+
]
e
−
K
w
[H
+
]
i
(5b)
We will now solve for [A
-3
]
e
,[HA
-2
]
e
, and [H
3
A]
e
.
A
tot
=
[
A
−3
]
e
+
[
HA
−2
]
e
+
[
H
2
A
−1
]
e
+
[
H
3
A
]
e
(6)
[H
2
A
−1
]
e
=
K
1
[H
3
A]
e
[H
+
]
e
(7)
[HA
−2
]
e
=
K
2
[H
2
A
−
1
]
e
[H
+
]
e
=
K
1
K
2
[H
3
A]
e
[H
+
]
2
e
(8)
[A
−3
]
e
=
K
3
[HA
−2
]
e
[H
+
]
e
=
K
1
K
2
K
3
[H
3
A]
e
[H
+
]
3
e
(9)
∴ [A
tot
]=
K
1
K
2
K
3
[H
3
A]
e
[H
+
]
3
e
+
K
1
K
2
[H
3
A]
e
[H
+
]
2
e
+
K
1
[H
3
A]
e
[H
+
]
e
+[H
3
A]
e
(6a)
where K’
1
,K’
2
, and K’
3
represent the three dissociation constants of the triprotic acid.
Solving for [H
3
A]
e
:
[H
3
A]
e
=
[H
+
]
3
e
([A
tot
])
K
1
K
2
K
3
+ K
1
K
2
[H
+
]
e
+ K
1
[H
+
]
2
e
+[H
+
]
3
e
(10)
Entering Eq.10 into Eq.9:
[A
−3
]
e
=
(K
1
K
2
K
3
)([A
tot
])
K
1
K
2
K
3
+ K
1
K
2
[H
+
]
e
+ K
1
[H
+
]
2
e
+[H
+
]
3
e
(9a)
Entering Eq.10 into Eq.8:
[HA
−2
]
e
=
(K
1
K
2
)([H
+
]
e
[A
tot
])
K
1
K
2
K
3
+ K
1
K
2
[H
+
]
e
+ K
1
[H
+
]
2
e
+[H
+
]
3
e
(8a)
Entering Eq.8a, 9a, and Eq.10 into Eq.5b:
(5c)
Nguyen et al. Theoretical Biology and Medical Modelling 2011, 8:29
/>Page 3 of 11
Solving Eq.5c for [H
+
]
e
:
(5d)
Solve Eq. 5d for “[H
+
]
e
“ by finding the roots of a fifth-order polynomial equation
using the wxMaxima software.
The apparent equilibrium c onstant K’ is calculated based on the thermodynamic
equilibrium constant K according to the following equation [3,4]:
p
K
=
p
K − 0.51
√
I
(11)
where I = ionic strength
I =
1
/
2
c
i
z
2
i
(12)
where c
i
is the molar concentration of each ion and z
i
is its charge.
Methods
In validating the Triprotic Acid Buffering Equation (TABE), we tested the formula
using a Na
2
HPO
4
-containing aqueous solution (Sigma, St. Louis, MO) and measured
the pH changes following the addition of HCl. To obtain pH measurements, t he pH
electrode (Sensorex, Garden Grove, CA) was calibrated using standard buffers of pH
1.68 (Ricca Chemical Company, Arlington, TX), pH of 4.01 and 7.00 (Thermo Electron
Corporation, Beverly, MA). 20 ml of a 10 mM Na
2
HPO
4
-containing aqueous solution
was incubated at 25°C in a water bath (Thermo Fisher Scientific, Waltham, MA).
Then, 20 μl of 1.0 M HCl (Sigma, St. Louis, MO) was added to t he solution, and the
equilibrium pH was measured when there was no further change in the measured pH
with time. To obtain more equilibrium pH values, the addition of 20 μlof1.0MHCl
was repeated. The pH meter (Hanna Instruments, Woonsocket, RI) was calibrated at
25°C, and the equilibrium pH was measured utilizin g a pH electrode at 25°C while th e
solution was mixed.
Nguyen et al. Theoretical Biology and Medical Modelling 2011, 8:29
/>Page 4 of 11
At each titration step, the reactant concentrations of each sample were first calcu-
lated based on the measured pH of the sample prior to the addition of HCl accordi ng
to Equations 8a, 9a and 10.
Based on the water association/dissociation equilibrium reaction:
After the addition of HCl, the initial reactant concentrati ons as displayed in Table 1
were calculated by accounting for the amount of H
+
and OH
-
added and the dilutional
effect of the added volume:
[A
tot
]=
(0.01 × 0.02)
T
otalVol
where Vol = volume
[A
−3
]
i
=
([A
−
3
]
sample
× Vol
sample
)
T
otalVol
[HA
−2
]
i
=
([HA
−2
]
sample
× Vol
sample
)
T
otalVol
[H
3
A]
i
=
([H
3
A]
sample
× Vol
sample
)
T
otalVol
[H
+
]
i
=
([H
+
]
sample
× Vol
sample
+[H
+
]
HCl
× Vol
HCl
)
T
otalVol
where [H
+
]
HCl
= H
+
concentration of HCl solution; Vol
HCl
= volume of HCl added;
and HCl is assumed to be completely dissociated.
[OH
−
]
i
=
([OH
−
]
sample
× Vol
sample
+[OH
−
]
HCl
× Vol
HCl
)
T
otalVol
where [OH
-
]
HCl
=OH
-
concentration of the HCl solution
=
K
w
[H
+
]
HCl
Results
Comparison of predicted pH with measured pH
In calculating the predicted equilibrium [H
+
]ofaNa
2
HPO
4
-containing aqueous solu-
tion being titrated by HCl, the equilibrium pH is first estimated using the thermody-
namic equilibrium constant K (expressed in terms of activities) of each of the three
different states of the acid as well as that of H
2
O, and this pH is then used to estimate
the ionic strength at equilibrium [5-7]. The final equilibrium pH is then re-calculated
using the apparent equilibrium constant K’ (expressed in terms of molar concentra-
tions) which is calculated based on the predicted ionic strength at equilibrium accord-
ing to Equation 11 [3]. The apparent equilibrium constant K’ is utilized to predict t he
final equilibrium pH since the reactant concentrations are expressed in molar
concentrations.
In validating the Triprotic Acid Buffering Equation (TABE), we compared the pre-
dicted equilibrium pH as calculated by TABE with the measured pH (mean of eight
Nguyen et al. Theoretical Biology and Medical Modelling 2011, 8:29
/>Page 5 of 11
Table 1 Predicted pH vs. Measured pH
[H
+
]
i
mol/L [OH
-
]
i
mol/L K’wK’1K’2K’3[H
3
A]
i
mol/L [HA
-2
]
i
mol/L [A
-3
]
i
mol/L A
tot
mol/L Predicted [H
+
]
e
Predicted pH
e
Measured pH
e
9.9900E-04 1.2870E-05 1.2206E-14 9.2591E-03 7.5261E-08 5.8421E-13 1.2702E-11 9.8598E-03 6.0795E-06 9.9900E-03 9.3446E-09 8.03 7.92
9.9802E-04 8.3093E-07 1.2128E-14 9.2003E-03 7.4783E-08 5.8050E-13 1.7940E-09 8.6018E-03 4.1684E-07 9.9800E-03 2.3305E-08 7.63 7.57
9.9704E-04 3.6692E-07 1.2055E-14 9.1447E-03 7.4331E-08 5.7699E-13 7.9068E-09 7.3044E-03 1.5537E-07 9.9701E-03 4.3085E-08 7.37 7.32
9.9606E-04 2.0872E-07 1.1988E-14 9.0941E-03 7.3920E-08 5.7380E-13 2.0475E-08 6.0547E-03 7.2865E-08 9.9602E-03 7.1549E-08 7.15 7.12
9.9510E-04 1.3056E-07 1.1930E-14 9.0498E-03 7.3559E-08 5.7100E-13 4.2642E-08 4.8869E-03 3.6612E-08 9.9502E-03 1.1446E-07 6.94 6.92
9.9416E-04 8.3333E-08 1.1877E-14 9.0099E-03 7.3236E-08 5.6849E-13 8.1648E-08 3.7791E-03 1.7993E-08 9.9404E-03 1.8817E-07 6.73 6.72
9.9324E-04 5.1978E-08 1.1831E-14 8.9747E-03 7.2949E-08 5.6627E-13 1.5335E-07 2.7402E-03 8.1067E-09 9.9305E-03 3.4187E-07 6.47 6.48
9.9239E-04 3.0170E-08 1.1792E-14 8.9450E-03 7.2708E-08 5.6439E-13 2.9964E-07 1.7922E-03 3.0675E-09 9.9206E-03 8.2868E-07 6.08 6.15
9.9168E-04 1.6510E-08 1.1773E-14 8.9309E-03 7.2593E-08 5.6350E-13 5.9702E-07 1.0652E-03 9.9569E-10 9.9108E-03 7.9634E-06 5.10 5.32
9.9487E-04 2.0932E-09 1.1795E-14 8.9472E-03 7.2725E-08 5.6453E-13 5.2047E-06 1.4838E-04 1.7534E-11 9.9010E-03 4.1477E-04 3.38 3.37
1.4202E-03 2.3151E-11 1.1817E-14 8.9638E-03 7.2860E-08 5.6558E-13 4.5503E-04 1.5900E-06 2.0801E-15 9.8912E-03 9.3769E-04 3.03 3.00
1.9900E-03 9.9614E-12 1.1840E-14 8.9816E-03 7.3005E-08 5.6670E-13 9.9425E-04 6.4561E-07 3.6409E-16 9.8814E-03 1.5388E-03 2.81 2.79
2.5934E-03 6.2133E-12 1.1865E-14 9.0006E-03 7.3160E-08 5.6790E-13 1.4988E-03 3.8016E-07 1.3399E-16 9.8717E-03 2.1727E-03 2.66 2.65
3.2163E-03 4.4753E-12 1.1892E-14 9.0208E-03 7.3324E-08 5.6917E-13 1.9597E-03 2.5898E-07 6.5889E-17 9.8619E-03 2.8245E-03 2.55 2.54
3.8914E-03 3.4342E-12 1.1920E-14 9.0421E-03 7.3497E-08 5.7052E-13 2.4023E-03 1.8779E-07 3.6744E-17 9.8522E-03 3.5284E-03 2.45 2.45
4.5699E-03 2.7834E-12 1.1949E-14 9.0641E-03 7.3676E-08 5.7191E-13 2.7966E-03 1.4429E-07 2.2936E-17 9.8425E-03 4.2333E-03 2.37 2.37
5.2942E-03 2.3151E-12 1.1979E-14 9.0871E-03 7.3862E-08 5.7335E-13 3.1711E-03 1.1375E-07 1.5077E-17 9.8328E-03 4.9831E-03 2.30 2.30
5.9749E-03 1.9991E-12 1.2009E-14 9.1100E-03 7.4049E-08 5.7480E-13 3.4854E-03 9.3674E-08 1.0747E-17 9.8232E-03 5.6856E-03 2.25 2.24
6.7136E-03 1.7411E-12 1.2041E-14 9.1338E-03 7.4242E-08 5.7631E-13 3.7922E-03 7.7712E-08 7.7855E-18 9.8135E-03 6.4459E-03 2.19 2.18
7.5241E-03 1.5252E-12 1.2073E-14 9.1587E-03 7.4444E-08 5.7787E-13 4.0941E-03 6.4726E-08 5.6956E-18 9.8039E-03 7.2775E-03 2.14 2.13
8.3216E-03 1.3593E-12 1.2106E-14 9.1835E-03 7.4647E-08 5.7944E-13 4.3602E-03 5.5049E-08 4.3289E-18 9.7943E-03 8.0938E-03 2.09 2.09
9.1457E-03 1.2220E-12 1.2149E-14 9.2161E-03 7.4911E-08 5.8149E-13 4.6079E-03 4.7274E-08 3.3510E-18 9.7847E-03 8.9351E-03 2.05 2.05
9.9070E-03 1.1177E-12 1.2172E-14 9.2334E-03 7.5052E-08 5.8259E-13 4.8147E-03 4.1542E-08 2.7005E-18 9.7752E-03 9.7110E-03 2.01 2.01
1.0711E-02 1.0253E-12 1.2205E-14 9.2585E-03 7.5256E-08 5.8417E-13 5.0141E-03 3.6598E-08 2.1882E-18 9.7656E-03 1.0529E-02 1.98 1.97
1.1588E-02 9.4044E-13 1.2239E-14 9.2844E-03 7.5467E-08 5.8581E-13 5.2125E-03 3.2191E-08 1.7705E-18 9.7561E-03 1.1420E-02 1.94 1.94
Nguyen et al. Theoretical Biology and Medical Modelling 2011, 8:29
/>Page 6 of 11
measurements) of an aqueous solution consisting of Na
2
HPO
4
to which HCl was
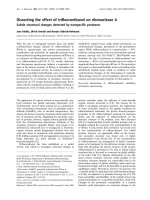
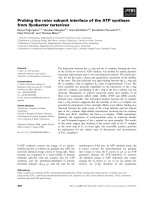
added. As demons trated in Figure 1 an d Table 1, the predicted equilibrium pH as cal-
culated by TABE accurat ely predicted the measured equili brium pH values. The linear
least squares fit equation comparing all predicted to measured values had an r
2
value
of 1.0, with a slope of 1.003, and an intercept of-0.007 (Figure 1). Not only is the pre-
dicted pH as calculated by TABE accurate in predicting the equilibrium pH, we also
show its utility in defining the partitioning of H
+
among the three different states of
the acid as well as to OH
-
ions that are derived from the auto-ionization of H
2
O
(Table 2).
Discussion
Significant changes in the [H
+
] resulting from the addition of a proton load to a triprotic
acid-containing aqueous solution are prevented by the process of H
+
buffering. The
equilibrium pH of a Na
2
HPO
4
-containing aqueous solution is therefore determined by
the buffering of excess H
+
by the various phosphate acceptor sites as well as to OH
-
ions
that are derived from the auto-ionization of H
2
O. Historically, the Guenther’sn-bar
equation has been used to predict the equilibrium pH of a Na
2
HPO
4
-containing aqueous
solution [1]. The Guenther’s n-bar equation is based on the total bound proton fraction
at equilibrium. Therefore, the Guenther’s n-bar equation accounts for both pre-existing
bound phosphate species as well as newly bound phosphate species that are formed
from the buffering of excess H
+
by the various phosphate acceptor sites. As the
Guenther’s n-bar equation is based on the total bound proton fraction, it is simply a
convenient mathematical tool for predicting equilibrium pH. Specifically, its derivation
Figure 1 Comparison of predicted equilibrium pH with the measured equilibrium pH. The linear
least squares fit equation comparing predicted to measured pH had an r
2
value of 1.00, slope of 1.003,
and an intercept of-0.007.
Nguyen et al. Theoretical Biology and Medical Modelling 2011, 8:29
/>Page 7 of 11
is not mechanistically based since it does not define the partitioning of proton buffering
by determining only the newly bound phosphate species that are formed from the buf-
fering of excess H
+
.
Similarly, electroneutrality based on charge balance requirement has also been utilized
to define the equilibrium pH of a triprotic acid-containing aqueous solution [2]. How-
ever, we had previously shown that although charge balance is a convenient mathemati-
cal tool that can be utilized to calculate and predict the equilibrium pH, charge balance
(electroneutrality considerations) is not a fundamental physicochemical parameter that
is mechanistically involved in predicting or determining t he equilibrium pH value of a
solution [4,8,9] Indeed, if strong ion difference (SID, a term used in the Stewart formula-
tion which is based on electroneutrality and charge balance considerations) were to have
a mechanistic role in determining the equilibrium pH, it must do so by imparting a fixed
macroscopic charge to the solution which will in turn cause the [H
+
] to attain a given
value in order to maintain macroscopic electroneutrality [8,9]. However, we demon-
strated that for a given change in SID due to the addition of HCl to a NaCl-containing
solution, electroneutrality is maintained (i.e. [Na
+
]+[H
+
]-[Cl
-
]-[OH
-
] = 0) at all pre-
equilibrium and equilibrium pH values, and that the equilibri um pH is only determined
by the d issociation constant of water, K’
w
[8,9]. In this previous study, we also reported
the derivation of a new mathematical model to predict the equilibrium pH based
mechanistically on the p artitio ning of H
+
buffering in an aqueous solution containing
multiple monoprotic acids without relying on electroneutrality requirements [8]. The
Table 2 Partitioning of H
+
Buffering
[H
+
]
i
mol/L H
+
buffered by
A
-3
mol/L
H
+
buffered by
HA
-2
mol/L
H
+
buffered by
HA
-1
mol/L
H
+
buffered by
OH
-
mol/L
[H
+
]
e
mol/L
9.9900E-04 5.5256E-06 9.8190E-04 1.1066E-09 1.1567E-05 9.3446E-09
9.9802E-04 2.2785E-07 9.9745E-04 4.2367E-09 3.1171E-07 2.3305E-08
9.9704E-04 7.1046E-08 9.9683E-04 9.3780E-09 8.7597E-08 4.3085E-08
9.9606E-04 3.2334E-08 9.9590E-04 1.8123E-08 4.1327E-08 7.1549E-08
9.9510E-04 1.7204E-08 9.9491E-04 3.4008E-08 2.6372E-08 1.1446E-07
9.9416E-04 9.5770E-09 9.9387E-04 6.7756E-08 2.0201E-08 1.8817E-07
9.9324E-04 5.2097E-09 9.9272E-04 1.5808E-07 1.7342E-08 3.4187E-07
9.9239E-04 2.5210E-09 9.9100E-04 5.4393E-07 1.5920E-08 8.2868E-07
9.9168E-04 9.8934E-10 9.7557E-04 8.1389E-06 1.5029E-08 7.9634E-06
9.9487E-04 1.7532E-11 1.4672E-04 4.3338E-04 2.0648E-09 4.1477E-04
1.4202E-03 1.6605E-15 8.9429E-07 4.8163E-04 1.0549E-11 9.3769E-04
1.9900E-03 2.1669E-16 2.4538E-07 4.5100E-04 2.2669E-12 1.5388E-03
2.5934E-03 6.3997E-17 1.1239E-07 4.2066E-04 7.5201E-13 2.1727E-03
3.2163E-03 2.6596E-17 6.4006E-08 3.9169E-04 2.6485E-13 2.8245E-03
3.8914E-03 1.2872E-17 4.0158E-08 3.6298E-04 5.5708E-14 3.5284E-03
4.5699E-03 7.1587E-18 2.7510E-08 3.3659E-04 -3.9428E-14 4.2333E-03
5.2942E-03 4.2453E-18 1.9614E-08 3.1116E-04 -8.8908E-14 4.9831E-03
5.9749E-03 2.7824E-18 1.4894E-08 2.8926E-04 -1.1333E-13 5.6856E-03
6.7136E-03 1.8591E-18 1.1434E-08 2.6769E-04 -1.2711E-13 6.4459E-03
7.5241E-03 1.2572E-18 8.8354E-09 2.4657E-04 -1.3397E-13 7.2775E-03
8.3216E-03 8.9060E-19 7.0279E-09 2.2781E-04 -1.3658E-13 8.0938E-03
9.1457E-03 6.4555E-19 5.6698E-09 2.1061E-04 -1.3664E-13 8.9351E-03
9.9070E-03 4.9118E-19 4.7172E-09 1.9601E-04 -1.3578E-13 9.7110E-03
1.0711E-02 3.7582E-19 3.9347E-09 1.8196E-04 -1.3404E-13 1.0529E-02
1.1588E-02 2.8736E-19 3.2799E-09 1.6860E-04 -1.3132E-13 1.1420E-02
Nguyen et al. Theoretical Biology and Medical Modelling 2011, 8:29
/>Page 8 of 11
goal of our present study is to determine whether it is possible to derive a mathematical
model based on the underlying physical chemistry involved (i.e. partitioning of H
+
buf-
fering) in a triprotic acid-containing aqueous solution without utilizing the mathematical
convenience of electroneutrality/charge balance considerations as had previous authors.
Our reasoning was based on the consideration that if a deriva tion based only on parti-
tioning of H
+
buffering was indeed possible in predicting the equilibrium pH of a tripro-
tic acid-containing aqueous solution as well, this would demonstrate convincingly that
electroneutrality/charge balance considerations are not only mathematically not
required, but are de facto not fundamental in determining the pH from a chemical
standpoint.
Towards this goal, we derived our new mathematical model utilizing: 1) partitioning
of H
+
buffering; 2) conservation of mass; and 3) acid-base equilibria. Simply stated, in
an aqueous solution containing a triprotic acid H
3
A, the equilibrium [H
+
]mustbe
equal to
the difference between the initial [H
+
] and the sum of the concentrations of H
+
buf-
fered by each proton acceptor site:
[
H
+
]
e
=
[
H
+
]
i
− a − b − c −
d
where:
a = concentration of excess H
+
buffered by A
-3
b = concentration of excess H
+
buffered by HA
-2
c = concentration of excess H
+
buffered by HA
-1
d = concentration of excess H
+
buffered by OH
-
Our model is also based on the law of conservation of mass:
A
tot
=
[
A
−3
]
e
+
[
HA
−2
]
e
+
[
H
2
A
−1
]
e
+
[
H
3
A
]
e
Based on the acid-base equilibrium reactions of Na
2
HPO
4
and H
2
Oandtheabove
mathema tical relationships, we derived a fifth-order polynomial equation which can be
utilized to predict the equilibrium [H
+
] of a triprotic acid-containing aqueous solution.
The five possible roots of this fifth-order polyno mial equation can be easily computed
using user-fri endly mathematical software such as wxMaxima. Although there are five
possible roots to this polynomial equation, there is only one solution that is positive i n
value.
Validity of TABE in Predicting the Equilibrium pH
In validating our new mathematical model, we tested the model using a Na
2
HPO
4
-con-
taining solution and measured the pH changes following the addition of HCl. In our
study, HCl was added successively to a Na
2
HPO
4
-containing solution and the equili-
brium pH is measured at each addition step. The equilibrium pH was determined
when there was no further change in the measured pH with time at each step of HCl
addition. The measured equilibrium pH was then compared with the predicted equili-
brium pH as calculated by our model. In predicting the equilibrium pH, the equili-
brium pH was first estimated using the thermodynamic equilibrium constant K
(expressed in terms of activities) of each of the three different states of the acid as well
as that of H
2
O, and this pH value was then used to estimate the ionic strength at equi-
librium [5-7]. The final equilibrium pH was then re-calculated using the apparent
Nguyen et al. Theoretical Biology and Medical Modelling 2011, 8:29
/>Page 9 of 11
equilibrium constant K’ (expressed in terms of molar concentrations) which was calcu-
lated based on the predicted ionic strength at equilibrium according to Equation 11
[3]. The apparent equilibrium constant K’ was utilized to calculate the final equilibrium
pH since the reactant concentrations were expressed in molar concentrations. As
demonstrated in Table 1 and Figure 1, our resul ts confirmed the accuracy of o ur new
quantitative approach for predicting the final equilibrium pH. Indeed, linear regression
analysis demonstrated that the predicted pH as calculated by our model is in excellent
agreement with the measured pH:
Predicted pH = 1.003 Measured pH − 0.007
(
r
2
=1.0
)
Our new mathematical model is also an important tool for defining the buffering of
excess H
+
among the various proton acceptor sites in solution. As s hown in Table 2,
by defining the partitioning of H
+
buffering among the different proton acceptor sites,
the equilibrium [H
+
] is simply determined from a chemical standpoint by the differ-
ence between the initial [H
+
] and the sum of the concentrations of H
+
being buffered
by each of the individual proton acceptor sites.
Theoretically, our formula is also valid for defining the buffering of excess H
+
by
other triprotic acids, eg. tricarboxylic acid such as citrate, an amino acid such as lysine,
etc. Future studies can easily be performed to test the accuracy of our model in defin-
ing the buffering processes by other triprotic acids.
Potential Sources of Error
In calculating the predicted equilibrium p H, the value of the t hermodynamic equili-
briumpKofeachprotonacceptorsitewasbasedonreportedvaluesat25degreesC
[5,6]. In refining the predictive accuracy of our model, t he apparent equilibrium pK’
was utilized to calculate the final equilibrium pH since the reactant concentrations
were expressed in molar concentrations [3]. The apparent equilibrium pK’ was calcu-
lated based on the thermodynami c equilibrium pK and the predicted ionic strength of
the solution at equilibrium according to Equation 11 [3]. Consequently, errors in either
the reported values and/or the correction for ionic strength would introduce discre-
pancies between predicted and measured values. An additional source of error is in the
accuracy of the pH electrode measurements. However, despite these potential sources
of error, the measured values were not significantly different from the values predicted
using our formula.
Summary
Our new mathe mati cal model is the first reported quantitative approach that can pre-
dict the equilibrium [H
+
] based mechanistically on the partitioning of H
+
buffering
among the different proton acceptor sites of a triprotic acid-containing solution. As
showninTable2,bydefiningthepartitioningofH
+
buffering among the different
proton acceptor sites, the equilibrium [H
+
]isphysicochemically determined by the dif-
ference between the initial [H
+
] and th e sum of the concentrations of H
+
being buf-
fered by each of the individual proton acceptor sites. Importantly, our results
demonstrate that the equilibrium pH can be accurately predicted based mechanistically
on the partitioning of H
+
buffering among the proton acceptor sites in solution with-
out requiring calculations or c onsider ations based on el ectrone utrality requirements.
Nguyen et al. Theoretical Biology and Medical Modelling 2011, 8:29
/>Page 10 of 11
These results therefo re provide additional data demonstrating that electroneutrality
requirements do not play any role in defining the equilibrium [H
+
] of a solution.
Acknowledgements
Dr. Kurtz is supported in part by NIH Grants DK077162 and DK058563
Authors’ contributions
MKN derived the mathematical model and drafted the manuscript. LK and IK conducted the buffer titration
experiments. All authors read and approved the final version of the manuscript.
Competing interests
The authors declare that they have no competing interests.
Received: 29 May 2011 Accepted: 17 August 2011 Published: 17 August 2011
References
1. Guenther WB: Unified Equilibrium Calculations New York: Wiley; 1991.
2. Ramette RW: Chemical Equilibrium and Analysis Reading, MA: Addison-Wesley Publishing Company; 1981.
3. Hills AG: Acid-Base Balance: Chemistry, Physiology, Pathophysiology Baltimore: Williams & Wilkins Company; 1973.
4. Kurtz I, Kraut J, Ornekian V, Nguyen MK: Acid-base analysis: a critique of the Stewart and bicarbonate-centered
approaches. Am J Physiol Renal Physiol 2008, 294:F1009-F1031.
5. Buffers. [ />6. Keeports D: Equilibrium constants and water activity. J Chem Educ 2005, 82(7):999.
7. Levy GB: Determination of sodium with ion-selective electrodes. Clin Chem 1981, 27(8):1435-1438.
8. Nguyen MK, Kao L, Kurtz I: Calculation of the Equilibrium pH in a Multiple-Buffered Aqueous Solution Based on
Partitioning of Proton Buffering: A New Predictive Formula. Am J Physiol Renal Physiol 2009, 296(6):F1521-F1529.
9. Nguyen MK, Kurtz I: Predicting the Equilibrium pH of an Aqueous Solution: A New Approach Based on the
Mechanistic Chemistry of Proton Transfer Reactions. WebmedCentral Nephrology 2011, 2(2):WMC001540.
doi:10.1186/1742-4682-8-29
Cite this article as: Nguyen et al.: Defining the buffering process by a triprotic acid without relying on stewart-
electroneutrality considerations. Theoretical Biology and Medical Modelling 2011 8:29.
Submit your next manuscript to BioMed Central
and take full advantage of:
• Convenient online submission
• Thorough peer review
• No space constraints or color figure charges
• Immediate publication on acceptance
• Inclusion in PubMed, CAS, Scopus and Google Scholar
• Research which is freely available for redistribution
Submit your manuscript at
www.biomedcentral.com/submit
Nguyen et al. Theoretical Biology and Medical Modelling 2011, 8:29
/>Page 11 of 11