Báo cáo y học: " Modeling invasion of metastasizing cancer cells to bone marrow utilizing ecological principles" pdf
Bạn đang xem bản rút gọn của tài liệu. Xem và tải ngay bản đầy đủ của tài liệu tại đây (428.01 KB, 11 trang )
RESEARCH Open Access
Modeling invasion of metastasizing cancer cells
to bone marrow utilizing ecological principles
Kun-Wan Chen
1,2,3
and Kenneth J Pienta
1,2,3*
* Correspondence: kpienta@umich.
edu
1
Department of Internal Medicine,
The University of Michigan, 7308
CCC, 1500 E. Medical Center Drive,
Ann Arbor, MI 48109, USA
Full list of author information is
available at the end of the article
Abstract
Background: The invasion of a new species into an established ecosystem can be
directly compared to the steps involved in cancer metastasis. Cancer must grow in a
primary site, extravasate and survive in the circulation to then intravasate into target
organ (invasive species survival in transport). Cancer cells often lay dormant at their
metastatic site for a long period of time (lag period for invasive species) before
proliferating (invasive spread). Proliferation in the new site has an impact on the
target organ microenvironment (ecological impact) and eventually the human host
(biosphere impact).
Results: Tilman has described mathematical equations for the competition between
invasive species in a structured habitat. These equations were adapted to study the
invasion of cancer cells into the bone marrow microenvironment as a structured
habitat. A large proportion of solid tumor metastases are bone metastases, known to
usurp hematopoietic stem cells (HSC) homing pathways to establish footholds in the
bone marrow. This required accounting for the fact that this is the natural home of
hematopoietic stem cells and that they already occupy this structured space. The
adapted Tilman model of invasion dynamics is especially valuable for modeling the
lag period or dormancy of cancer cells.
Conclusions: The Tilman equations for modeling the invasion of two species into a
defined space have been modified to study the invasion of cancer cells into the
bone marrow microenvironment. These modified equations allow a more flexible
way to model the space competition between the two cell species. The ability to
model initial density, metastatic seeding into the bone marrow and growth once the
cells are present, and movement of cells out of the bone marrow niche and
apoptosis of cells are all aspects of the adapted equations. These equations are
currently being applied to clinical data sets for verification and further refinement of
the models.
Keywords: ecosystem, cancer, population biology, metastasis, invasion, hematopoie-
tic niche
Background
A patient with prostate cancer, Mr. S. presents to clinic for consideration of further
therapy. He is a 65 year old man that was d iagnosed 12 years ago with a poorly differ-
entiated, localized prostate cancer (PCa) when he presented for a routine physical
exam and was found to have an elevated prostate specific antigen (PSA) blood test.
Digital rectal exam revealed no abnormalities but prostate ultrasound and biopsy
Chen and Pienta Theoretical Biology and Medical Modelling 2011, 8:36
/>© 2011 Chen and Pient a; licensee BioMed Central Ltd. This is an Open Access article distributed under the terms of the Creative
Commons Attribution License ( which permits unrestricted use, dist ribution, and
reproduction in any medium, provided the original work is properly cited.
revealed a Gleason 5+4 = 9 cancer (clinic al stage T1cNxMx). Because Mr. S. was in
otherwise excellent health, he chose to undergo a radical retropubic prostatectomy and
his prostate was removed. All of his lymph nodes were negative for cancer. He was
considered to be cured of his disease.
Five years later, Mr. S’s PSA became detectab le and he now has 3 lesions present on
bone scan. He has metastatic prostate cancer, now incurable. Each year, approximately
40,000 men who “should” have been cured of their prostate cancer by surgery or radia-
tion therapy present with incurable metastatic disease that will mani fest itself as meta-
static lesions in the bone, usually years after primary treatment. The only explanation
for this is th at disseminated tumor cells (DTCs) are present in the bone microenviron-
ment before surgery or ra diation eradica ted the primary tumor. How these cells traffic
to the bone, become dormant, and then ultimately begin to pro liferate are subjects of
great interest to the cancer field.
Mr. S’s cancer experience is not unique. PCa remains the most common cancer and
the second leading cause of cancer-related death in American men today. Approxi-
mately 72% of patients who undergo radical prostatectomy had DTCs in the ir marrow
prior to surgery suggesting that marrow dissemination is an early event in the progres-
sion of PCa disease. Clearly the ability of DTCs to proliferate, undergo apoptosis or
become dormant must occur soon after the initial arrest of circulating tumor cells
(CTCs) in the marrow. Unquestionably, a greater understanding of the molecular
events that regulate a DTC’s ability to beco me, and remain dormant over long periods
is crucial to define new therapeutic strategies to combat disease progression. New
mathem atical models to understand these events may help further define strategies for
understanding mechanisms of cancer cell trafficking and subsequent dormancy.
Eugene Odum, one of the founders of the science o f ecology, defined an ecosystem
as: “Any unit that includes all of the organisms (the biotic community) in a given area
interacting with the physical environment so that a flow of energy leads to clearly
defined biotic structures and cycling of materials between living and nonliving compo-
nents is an ecological system” [1]. The ecosystem is the first unit of the ecological hier-
archy that is complete, i.e., that has all of the necessary components for survival.
Ecosystems do not exist independently, but interact in a complex web of rela tionships
that connect all ecosystems to make up the biosphe re [1]. Using the ecosystem para-
digm, cancer cells, growing in an organ, can be considered to be a species co-existing
in a complex habitat with other host cells. Together, the cancer cells and host cells,
interacting within their habitat, create an ecosystem. This ecosystem, in turn, exists
within a larger environment (the host patient as biosphere). The study of ecology,
then, has the potential to offer insights into tumor biology. This is especially true for
the study of metastasis [2,3].
Ecologists have studied the population biology of invasive species for decades and
have documented their impact on local environments as well as the global ecosystem
as a whole [4-6]. Invasive species start as a native population within a defined commu-
nity and are then transported by some means to a n ew environment [4]. In this new
environment, the invader either then dies off or e nters a period of time during which
it establishes itself (lag perio d). It then begins to spread and have impact on t he local
environment, disru pting the ecosystem as a whole. This disruption has broad implica-
tions for the native species and the broader ecosystem [4]. Biologic traits that result in
Chen and Pienta Theoretical Biology and Medical Modelling 2011, 8:36
/>Page 2 of 11
a robust invasive species include rapid proliferative capacity, adaptation to environ-
mental stress (phenotypic plasticity) and high tolerance to environmental heterogeneity
[7-10].
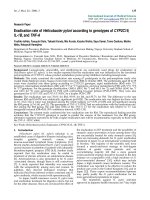
The life cycle of invasive species is directly analogous to the study of cancer metasta-
sis [Figure 1] [4-10]. Cancer m ust grow in a primary site, extravasate and survive in
the circulation to then intravasate at a target organ (invas ive species survival in trans-
port). Cancer cells often lay dormant at their metastatic site for a long period of time
(lag period) before proliferating (invasive spread). Proliferation in the new site has an
impact on the target organ microenvironment (ecological impact) and eventually the
human host (biosphere impact) [11-13]. Studies of the population biology of invasive
species have allowed a more precise focus on specific characteristics involved in inva-
siveness [14-16]. T ilman has described mathematical equations for the competition
between species in a structur ed habitat [16]. These equations can be adapted to study
the invasion of cancer ce lls into the bone marrow microenvironment as a structured
habitat. Within the b one marrow microenvironment, hematopoietic stem cells (HSC)
homing, quiescence, and self-renewal depend on the bone ma rrow HSC niche. A large
proportion of solid tumor metastases are bone metast ases, known to usurp HSC hom-
ing pathways to establish footholds in the bone marrow. Recent evidence suggests that
tumor cells target and parasitize the HSC niche during metastasis just as invasive
Figure 1 Population biology of invasive species and metastasis. The generalized steps necessary for a
species to invade a new ecologic niche are directly analogous to the steps of cancer metastasis (modified
from Sakai and colleagues [4]). The transport, establishment, and spread of invasive species can be
compared to the intravasation of cancer cells into the blood stream where they are transported to a target
organ where they extravasate. The cancer cells then enter a dormant period (lag period for invasive
species) before growing, and displacing the host cells (native species). This results in damage to the local
organ and eventually the host patient (human impact).
Chen and Pienta Theoretical Biology and Medical Modelling 2011, 8:36
/>Page 3 of 11
species do in the world [17]. We adapted the Tilman model of invasion dynamics to
model cancer cell metastasis to the bone marrow microenvironment.
Tilman’s model of the dynamics of two species invasion into a structured habitat
If a single species cannot occupy all the sites in a habit, e.g., because of a certain death
rate or natural movement in and out of the environment, another species may be able
to invade into and survive in the open portion of a habitat. In Tilman’smodel[16],a
superior species can displace the inferior species and occupy the lattice that was pre-
viously occupied by the inferior species. The inferior species, however, can colonize in
the lattice only if the lattice of the fixed and homogeneous environment is neither
occupied by superior species nor itself. The superior species occupies empty lattices
with a constant colonization rate (birth rate), b
1
. The inferior species occupies empty
latti ces with a constant birth rate, b
2
. Either the death rate (μ
1
) of the superior species
or the death rate of the inferior species (μ
2
) causes the occupied lattices to be emptied.
It is assumed that the death rate and birth rate of the two species are independent of
each other. Table 1 defines the symbols of the model.
∂
ρ
1
∂
t
= β
1
ρ
1
(
1 − ρ
1
)
− μ
1
ρ
1
(1)
∂ρ
z
∂t
= β
2
ρ
2
(
1 − ρ
1
− ρ
2
)
− μ
2
ρ
2
− β
1
ρ
1
ρ
2
(2)
Eq. 1 describes that the dynamics of the superior species is only dependent on the
colonization and its own death rate. Colonization, b
1
r
1
(1-r
1
), indicates that when one
member of the superior species grows, the member is not affected by any m ember of
the inferior species. In other words, any member of superior species can displace the
member of the inferior species. The part of the equation μ
1
r
1
describes the density-
independent mortality of superior s pecies itself. Eq. 2 describes the dynamics of the
inferior species is dependent on the colonization, mortality and the competitive displa-
cement. Colonization, b
2
r
2
(1-r
1
-r
2
), indicates that the inferior species can colonize a
lattice if it is unoccupied. A member of the inferior species, therefore, cannot displace
any member of superior species. The competitive displacement, -b
2
r
1
r
2
, indicates
that the inferior species is displaced by superior species growth (birth).
If Eq. 1 is set equal to zero, the equilibrium density for species 1 (superior species)
can be calculated,
Table 1 Symbols utilized in the equations
Symbol Definition
r
1
Density of species 1
r
2
Density of species 2
b
1
Birth rate of species 1
b
2
Birth rate of species 2
μ
1
Death rate of species 1
b
2
Death rate of species 2
The ability (proportion) that species 1 can displace species 2 by the growth (birth) of species 1
v The ability (proportion) that species 2 can displace species 1 by the growth (birth) of species 2
t Time
Chen and Pienta Theoretical Biology and Medical Modelling 2011, 8:36
/>Page 4 of 11
ρ
1
∗ =
1 −
μ
1
β
1
(3)
Since species 2 (inferior species) is affected by the species 1 (superior species), the
equilibrium density for species 2 can be calculated after species 1 reach the equilibrium
density. Similarly, if Eq. 2 is set equal to zero, the equilibrium density for species 2
(inferior species) can be calculated,
ρ2∗ =1−
μ
2
β
2
− ρ
1
∗
1+
β
1
β
2
=
μ
1
β
1
−
μ
2
β
2
+
μ
1
β
2
−
β
1
β
2
(4)
The initial density of the two different species does not affect the final equilibrium
density. A very small initial density, however, requires m ore time to reach the equili-
brium density.
Adapting the invasion model to describe the invasion of cancer cells into the
hematopoietic stem cell niche of the bone marrow microenvironment
To better model cancer cell invasion, the Tilman equations were mod ified to take into
account that HSCs are already present in the bone marrow and that cancer cells are
the invading species. To observe competition between the two cell types, occupancy of
a niche site can occur thro ugh colonization by movement into the site or by cell divi-
sion (birth) rate. The avidity of the cell to occupy a niche site is reflected by a cell
moving out of the niche or undergoing apoptosis (death rate ). First, it was assumed
that HSCs colonize the bone marrow niche in a more robust manner than cancer cells.
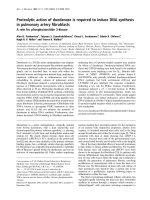
i.e., HSCs are the superior species (Figure 2A, B and 2C). Under these conditions, colo-
nization and niche occupancy of the superior species (HSC) is not affected by cancer
cells. Furthermore, the initial density of eitherspeciesdoesnotaffecttheequilibrium
density of both species, but does affect the time it takes to reach the equilibrium den-
sity. This may be a potential model for studying dormancy of cancer cells.
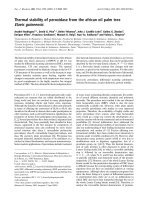
Alternatively, it can be assumed that cancer cells are more avid for the bone marrow
niche and are the superior species (Figure 3A, B and 3C). Notably, a high initial density
is set for the inferior species (HSC) instead of the low initial density for the inferior
species above. The observations found in Figure 2 were again demonstrated. First,
although the superior species (canc er cells) has very low initial density, the superior
species (cancer cells) is not affected by inferior HSC cells. Second, the initial density of
either superior species (cancer cells) or inferior species (HSC) does not affect the equi-
librium density of both species, but the initial density of the superior species (cancer
cells) affects the time it takes to reach the equilibrium density. Third, compared to Fig-
ure 3(A) and 3(B), 3(C) shows a lower equilibrium density for the inferior species
(HSC) because of a lower birth rate of species 2. The results are consistent with Eq. 4.
As noted, the Tilman’s model describes the coexisting dynamics between superior
and inferior species. However, the superior species is not affected by the inferior spe-
cies. When modeling the real dy namics between HSC and cancer cells, it is doubtful
that HSC or cancer cells behave in this absolute manner as a super ior or inferior spe-
cies. Thus, Tilman’s model was amended to allow more interaction between the two
species.
To take into account that both species have some ability to displace each other, the
equations were further modified.
Chen and Pienta Theoretical Biology and Medical Modelling 2011, 8:36
/>Page 5 of 11
A.
B.
C.
Figure 2 Competition among two species: HSCs as the superior species. The red (dash) line indicates
the superior species (HSC); the green (solid) line indicates the inferior species (cancer cells). (A) superior
species (HSC) has colonization rate b
1
= 0.2, mortality rate μ
1
= 0.1 time
-1
, and initial density = 0.6. The
inferior species (cancer cells) has a colonization rate of b
2
= 0.8, mortality rate μ
2
= 0.1 time
-1
, and initial
density = 0.0001. (B) The inferior species (cancer cells) has an initial density = 0.1; all other conditions
remained the same as in (A). (C) Superior species (HSC) has an initial density = 0.4; all other conditions
remained the same as in (A).
Chen and Pienta Theoretical Biology and Medical Modelling 2011, 8:36
/>Page 6 of 11
A.
B.
C.
*
Figure 3 Competition among two species: Cancer cells as the superior species. The red (dash) line
indicates the superior species (cancer cells); the green (solid) line indicates the inferior species (HSC). (A)
Superior species (cancer cells) has a colonization rate of b
1
= 0.2, mortality rate μ
1
= 0.1 time
-1
, and initial
density = 0.0001. Inferior species (HSC) has a colonization rate b
2
= 0.8, mortality rate μ
2
= 0.1 time
-1
, and
initial density = 0.5. The * of the density curve of the inferior species is obtained from Eq. 2. (B) The
superior species (cancer cells) has initial density = 0.01, and the inferior species (HSC) has initial density =
0.85; all other conditions remained the same as in (A). (C) The inferior species (HSC) has initial density =
0.84 and colonization rate b
2
= 0.6 time
-1
; all other conditions remained the same as in (A).
Chen and Pienta Theoretical Biology and Medical Modelling 2011, 8:36
/>Page 7 of 11
∂
ρ
1
∂
t
= β
1
ρ
1
1 − ρ
1
−
(
1 − k
)
ρ
2
− μ
1
ρ
1
− β
2
ρ
2
ρ
1
v
(5)
∂ρ
z
∂t
= β
2
ρ
2
[1 −
(
1 − v
)
ρ
1
− ρ
2
] − μ
2
ρ
2
− β
1
ρ
1
ρ
2
k
(6)
Coefficients, k(0 ≤ k ≤ 1), expresses the ability (proportion) that species 1 can dis-
place species 2 by the growth (birth) of s pecies 1. Therefore, (1-k)expressesthepro-
portion of species 2 that is not displaced by s peci es 1. The coloniz ation of the species
1, b
1
r
1
[1-r
1
-(1-k) r
2
], indicates that when the species 1 grows, th e species 1 is affected
by the (1-k) proportion of species 2 (Eq. 5). Sp ecies 1 can displace the k proportion of
the species 2, but not all of species 2. Similarly, coefficients, v (0 ≤ v ≤ 1), expresses
the ability (proportion) that species 2 can displace species 1 by the growth (birth) of
species 2. I f k is larger than v, then species 1 has a stronger ability to displace species
2 (species 1 is the relative superior competitor).
The competitive displacement in Eq. 5, -b
2
r
2
r
1
v, indicates that the v proportion of
species 1 is displaced by species 2’s invasion or growth (birth in the equation). The
competitive displacement in Eq. 6, -b
1
r
1
r
2
k , indicates that the k proportion of species
2 is displaced by species 1’sbirth.Bothk and v express the displacement ability from
speci es 1 and 2’s birth, and ar e independent of each other. It is assumes that species 1
and species 2 do not change the lattice (occupancy of the niche) once they are g iven a
birth until they are displaced. It is also assumes that when either species 1 or species 2
grow (birth rate), the lattice that they are going to occupy is chosen randomly. In addi-
tion, once either member of species 1 or species 2 is displaced, they will abandon the
fixed and homogeneous space. Thus, the only reason that they may compete for the
same lattice is because of the birth (movement in of a new cell or growth).
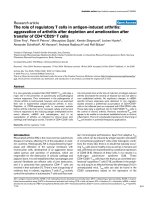
Hematopoietic stem cells (HSC) and cancer cells were modeled as the two species.
Resuming the scenario at Figure 3, it was assumed that cancer cells are the relative
superior species and HSC are the relative inferior species (Figure 4A, B and 4C). To
reflect what happens in cancer in the body, the initial density for the inferior species
(HSC) was set at a high level and a low initial density was set for the invading cancer
cells. All values that generated the curves in Figure 4A, B and 4C are equivalent to the
values in Figure 3A, B and 3C, respectively. To demonstrate the simulations clearly,
the time maximum was changed to 1000 in Figure 4. The equations applied to Figure
4 are:
∂ρ
1
∂t
= β
1
ρ
1
[1 − ρ
1
− 0.1ρ
2
] − μ
1
ρ
1
− β
2
ρ
2
ρ
1
× 0.
1
∂
ρ
2
∂
t
= β
2
ρ
2
[1 − 0.9ρ
1
− ρ
2
] − μ
2
ρ
2
− β
1
ρ
1
ρ
2
× 0.
9
κ =0.9
,
v =0.
1
This results in cance r cells displacing most (90%) of the HSCs. However, the HSCs
can also displace a small portion (10%) of the cancer cells. Comparing the conditions
in Figure 3 versus Figure 4, the equilibrium densities of the cancer cell s are lower in
Figure 4 and it takes longer time for both species to reach their equilibrium densities
in Figure 4.
Chen and Pienta Theoretical Biology and Medical Modelling 2011, 8:36
/>Page 8 of 11
A
.
B.
C.
Figure 4 Competitionamongtwospecies. The red (dash) line indicates the relative superior species
(cancer cells); the green (solid) line indicates the relative inferior species (HSC). Superior species (cancer
cells) can displace 90% of the inferior species (HSC). Inferior species (HSC) can displace 10% of the superior
species (cancer cells). (A) Superior species (cancer cells) has colonization rate b
1
= 0.2, mortality rate μ
1
=
0.1 time
-1
, and initial density = 0.0001. Inferior species (HSC) has colonization rate b
2
= 0.8, mortality rate
μ
2
= 0.1 time
-1
, and initial density = 0.5. (B) The superior species (cancer cells) has initial density = 0.01,
and the inferior species (HSC) has initial density = 0.85; all other conditions remained the same as in (A).
(C) The inferior species (HSC) has initial density = 0.84 and colonization rate b
1
= 0.61 time
-1
; all other
conditions remained the same as in (A).
Chen and Pienta Theoretical Biology and Medical Modelling 2011, 8:36
/>Page 9 of 11
Conclusions
The Tilman equations for modeling the invasion of two species into a defined space
have been modified to study the invasion of canc er cells into the bone marrow micro-
environment. This required accounting for the fact that this is the natural home of
hematopoietic stem cells and that they already occupy this structured space. These
modified equations allow a more flexible way to model the space competition between
the two cell species. The ability to model initial density, birth rate (metastatic seeding
into the bone marrow and growth once the cells are present) and death r ate (move-
ment of cells out of the bone marrow niche and apoptosis of cells), are key compo-
nents of this equations. The equat ions allow modeling of metastasis and the lag period
of cancer cells. These equations are currently being applied to clinical data sets for ver-
ification and further refinement of the models. First, it is likely that during the progres-
sion from primary tumors to metastasis, genomic alterations occur, resulting in genetic
and phenotypic changes. This article treated the cancer cells as a single species when
in fact, it may be reasonable to treat them as multiple species based o n their genetic
heterogeneity (different genomes = different species) (18,19). The model can also be
adapted to take into account mutation over time, i.e., the cancer cell population is rela-
tively weak following initial metastasis, and becomes strong over time and dominates
during the late stages. The fields of ecology and population biology are rich sources for
understanding the biology of metastasis.
Acknowledgements
This work was directly supported by National Cancer Institute grant CA093900 and U01CA143055, the Department of
Defense; the Prostate Cancer Foundation. K.J. Pienta receives support as an American Cancer Society Clinical Research
Professor and a Taubman Scholar of the University of Michigan, NIH SPORE in prostate cancer grant P50 CA69568,
and Cancer Center support grant P30 CA46592.
Author details
1
Department of Internal Medicine, The University of Michigan, 7308 CCC, 1500 E. Medical Center Drive, Ann Arbor, MI
48109, USA.
2
Department of Urology, The University of Michigan, 7308 CCC, 1500 E. Medical Center Drive, Ann Arbor,
MI 48109, USA.
3
Department of Michigan Center for Translational Pathology, The University of Michigan, 7308 CCC,
1500 E. Medical Center Drive, Ann Arbor, MI 48109, USA.
Authors’ contributions
KWC and KJP created the modeling. KWC developed the equations. KWC and KJP wrote the manuscript. Both authors
have read and approved the final manuscript.
Conflict of interest
The authors declare that they have no competing interests.
Received: 10 August 2011 Accepted: 3 October 2011 Published: 3 October 2011
References
1. Odum EP, Barrett GW: Fundamental of Ecology. Thompson Brooks/Cole, Belmont, CA;, Fifth 2005, 18, ISBN 0-534-
42066-4.
2. Pienta KJ, McGregor N, Axelrod R, Axelrod DE: Ecological therapy for cancer: Defining tumors using an ecosystem
paradigm suggests new opportunities for novel cancer treatments. Translational Oncology 2008, 1:158-164.
3. Pienta KJ, Loberg RD: The “emigration, migration, and immigration” of prostate cancer. Prostate Cancer 2005,
4(1):24-30.
4. Sakai AK, Allendorf FW, Holt JS, Lodge DM, Molofsky J, With KA, Baughman S, Cabin RJ, 7 Cohen JE, Ellstrand NC,
McCauley DE, O’Neil P, Parker IM, Thompson JN, Weller SG: The population biology of invasive species. Annu Rev Ecol
Syst 2001, 32:305-32.
5. Lodge DM: Biological invasions: lessons for ecology. Trends Ecol Evol 1993, 8:133-37.
6. Williamson M, Brown K: The analysis and modeling of British invasions. PhilosTrans R Soc London Ser B 1986,
314:505-22.
7. Baker HG: The evolution of weeds. Annu Rev Ecol Syst 1974, 5:1-24.
8. Kolar C, Lodge DM: Progress in invasion biology: predicting invaders. TrendsEcol Evol 2001, 16:199-204.
9. Newsome AE, Noble IR: Ecological and physiological characters of invading species. In Ecology of Biological Invasions.
Edited by: Groves RH, Burdon JJ. Cambridge: Cambridge Univ Press; 1986:1-20, 166 pp.
Chen and Pienta Theoretical Biology and Medical Modelling 2011, 8:36
/>Page 10 of 11
10. Crawley MJ: The population biology of invaders. Philos Trans R Soc London Ser B 1986, 314:711-29.
11. Chaffer CL, Weinberg RA: A perspective on cancer cell metastasis. Science 2011, 331(6024), 1559-64.
12. Hanahan D, Weinberg RA: Hallmarks of cancer: the next generation. Cell 2011, 144(5), 646-74.
13. Colotta F, Allavena P, Sica A, Garlanda C, Mantovani A: Cancer-related inflammation, the seventh hallmark of cancer:
links to genetic instability. Carcinogenesis 2009, 30(7):1073-81.
14. Korniss G, Caraco T: Spatial dynamics of invasion: the geometry of introduced species. Journal of Theoretical Biology
2005, 233:137-150.
15. Tilman D, Lehman CL, Kareiva P: Population dynamics in spatial habitats.Edited by: Tilman D, Kareiva P. Spatial
Ecology: The Role of Space in Population Dynamics and Interspecific Interactions. Princeton University Press, Princeton;
1997:3-20.
16. Tilman D: Competition and biodiversity and in spatially structured habitats. Ecology 1994, 75(1):2-16.
17. Shiozawa Y, Pedersen EA, Havens AM, Jung Y, Mishra A, Joseph J, Kim JK, Patel LR, Ying C, Ziegler AM, Pienta MJ,
Song J, Wang J, Loberg RD, Krebsbach PH, Pienta KJ, Taichman RS: Human prostate cancer metastases target the
hematopoietic stem cell niche to establish footholds in mouse bone marrow. J Clin Invest 2011, 121(4), 1298-312.
doi:10.1186/1742-4682-8-36
Cite this article as: Chen and Pienta: Modeling invasion of metastasizing cancer cells to bone marrow utilizing
ecological principles. Theoretical Biology and Medical Modelling 2011 8:36.
Submit your next manuscript to BioMed Central
and take full advantage of:
• Convenient online submission
• Thorough peer review
• No space constraints or color figure charges
• Immediate publication on acceptance
• Inclusion in PubMed, CAS, Scopus and Google Scholar
• Research which is freely available for redistribution
Submit your manuscript at
www.biomedcentral.com/submit
Chen and Pienta Theoretical Biology and Medical Modelling 2011, 8:36
/>Page 11 of 11