Báo cáo y học: "Modeling the effect of levothyroxine therapy on bone mass density in postmenopausal women: a different approach leads to new inference" pot
Bạn đang xem bản rút gọn của tài liệu. Xem và tải ngay bản đầy đủ của tài liệu tại đây (1021.99 KB, 11 trang )
BioMed Central
Page 1 of 11
(page number not for citation purposes)
Theoretical Biology and Medical
Modelling
Open Access
Research
Modeling the effect of levothyroxine therapy on bone mass density
in postmenopausal women: a different approach leads to new
inference
Babak Mohammadi, Vahid Haghpanah, Seyed Mohammad Tavangar and
Bagher Larijani*
Address: Endocrinology and Metabolism Research Center (EMRC), Tehran University of Medical Sciences, Tehran, Iran
Email: Babak Mohammadi - ; Vahid Haghpanah - ;
Seyed Mohammad Tavangar - ; Bagher Larijani* -
* Corresponding author
Abstract
Background: The diagnosis, treatment and prevention of osteoporosis is a national health
emergency. Osteoporosis quietly progresses without symptoms until late stage complications
occur. Older patients are more commonly at risk of fractures due to osteoporosis. The fracture
risk increases when suppressive doses of levothyroxine are administered especially in
postmenopausal women. The question is; "When should bone mass density be tested in
postmenopausal women after the initiation of suppressive levothyroxine therapy?". Standard
guidelines for the prevention of osteoporosis suggest that follow-up be done in 1 to 2 years. We
were interested in predicting the level of bone mass density in postmenopausal women after the
initiation of suppressive levothyroxine therapy with a novel approach.
Methods: The study used data from the literature on the influence of exogenous thyroid
hormones on bone mass density. Four cubic polynomial equations were obtained by curve fitting
for Ward's triangle, trochanter, spine and femoral neck. The behaviors of the models were
investigated by statistical and mathematical analyses.
Results: There are four points of inflexion on the graphs of the first derivatives of the equations
with respect to time at about 6, 5, 7 and 5 months. In other words, there is a maximum speed of
bone loss around the 6
th
month after the start of suppressive L-thyroxine therapy in post-
menopausal women.
Conclusion: It seems reasonable to check bone mass density at the 6
th
month of therapy. More
research is needed to explain the cause and to confirm the clinical application of this phenomenon
for osteoporosis, but such an approach can be used as a guide to future experimentation. The
investigation of change over time may lead to more sophisticated decision making in a wide variety
of clinical problems.
Published: 9 June 2007
Theoretical Biology and Medical Modelling 2007, 4:23 doi:10.1186/1742-4682-4-23
Received: 27 April 2006
Accepted: 9 June 2007
This article is available from: />© 2007 Mohammadi et al; licensee BioMed Central Ltd.
This is an Open Access article distributed under the terms of the Creative Commons Attribution License ( />),
which permits unrestricted use, distribution, and reproduction in any medium, provided the original work is properly cited.
Theoretical Biology and Medical Modelling 2007, 4:23 />Page 2 of 11
(page number not for citation purposes)
Background
Osteoporosis
The World Health Organization (WHO) defines oste-
oporosis as bone mineral density more than or equal to -
2.5 Standard Deviation (SD) below the young adult mean
[1]. This definition is the one most often used by radiolo-
gists when they measure bone density and it gives the phy-
sician an idea of fracture risk. Non-modifiable risk factors
include: female gender, Caucasian or Asian race, family
history [2] and a personal history of fracture as an adult.
Modifiable factors include: smoking, inadequate dietary
calcium, estrogen deficiency [3], excess dietary sodium,
alcoholism, low body weight (<57.6 kg), inactivity and
lack of weight bearing exercise [4]. Secondary causes of
osteoporosis include a broad range of diseases and medi-
cations. Drugs may include corticosteroids, anticonvul-
sants, heparin, aluminum and thyroxine. Secondary
osteoporosis may be due to hyperparathyroidism, hyper-
thyroidism, diabetes, chronic renal failure, scoliosis,
gonadal insufficiency, multiple myeloma, lymphoma,
chronic obstructive pulmonary disease, rheumatoid
arthritis, sarcoidosis, and malabsorption syndromes
among several other conditions.
The effect of thyroid hormone on bone turnover
Thyrotoxicosis increases bone turnover in favor of net
bone resorption [5]. Thyroid disease and osteoporosis are
common problems often managed by primary care physi-
cians. Thyroid hormone preparations are widely used
either at replacement doses to correct hypothyroidism of
any etiology (except transient hypothyroidism during the
recovery phase of subacute thyroiditis) and for simple
(nonendemic) goiter and chronic lymphocytic (Hashim-
oto's) thyroiditis; or at suppressive doses to supress thyro-
tropin (thyroid-stimulating hormone) secretion in
patients with differentiated thyroid carcinoma after total
thyroidectomy or with diffuse nodular nontoxic goiter. In
order to suppress thyrotropin secretion, it is necessary to
administer slightly supraphysiological doses of thyroxine
and reduced bone density and bone mass is a possible
adverse effect of this therapy [6]. The availability of sensi-
tive thyrotropin assays allows effective biochemical mon-
itoring of both replacement and suppressive therapy to be
conducted [7].
Frank hyperthyroidism is a recognized risk factor for oste-
oporosis, but the effects of subclinical hyperthyroidism
on bone mass density are less well defined [8]. In two
cross-sectional studies of patients with subclinical hyper-
thyroidism due to multinodular goiter, there were statisti-
cally and clinically significantly lower bone mineral
densities at the femoral neck and radius than in age-
matched controls [9,10]. Some data confirm that post-
menopausal women receiving suppressive doses of T
4
for
thyroid carcinoma have diminished bone mineral meas-
urements and are at risk of osteoporosis [11-13]. Estrogen
use also appears to negate thyroid hormone-associated
loss of bone density in postmenopausal women [14]. Also
there is a risk of bone loss in post-menopausal females
with a previous history of thyrotoxicosis treated with radi-
oiodine [15]. It has been shown that women on long-term
TSH-suppressive doses of L-T
4
have reduced bone mass
density (BMD) at various skeletal sites, which may
increase fracture risks. It has therefore been recommended
that TSH-suppressive doses of thyroid hormone should
only be prescribed when appropriate and for no longer
than necessary to minimize this adverse effect of excessive
doses on bone [16]. A prospective study of bone loss in
pre- and post-menopausal women on L-thyroxine therapy
for non-toxic goiter suggests that TSH-suppressive therapy
with L-thyroxine for non-toxic goiter significantly
increases the bone mineral turnover and might contribute
to a reduction of BMD, more marked in cortical bone, in
both pre- and post-menopausal women [17].
On the other hand, some studies have suggested that thy-
roxine therapy alone is not a major risk factor for the
development of osteoporosis [18-26] and bone mass
reduction could be transient and reversible because new
bone is formed at the end of the resorptive sequence [27].
Some data have shown a small detrimental effect of cau-
tious L-T
4
suppressive therapy on bone mass assessed by
dual energy x-ray absorptiometry (DEXA) [28]. Despite
many studies, confusion still exists about the effect of thy-
roid hormone on skeletal health [29].
Data selected from cross-sectional studies, longitudinal
studies, and meta-analyses with appropriate control
groups (patients matched for age, sex, and menopausal
status) were reviewed in comparison with established
databases or thyroid state defined by TSH level or thyroid
hormone dose. Overall, hyperthyroidism and use of thy-
roid hormone to suppress TSH because of thyroid cancer,
goiters, or nodules seemed to have an adverse effect on
bone, especially in postmenopausal women; the largest
effect was on cortical bone. Thyroid hormone replace-
ment seemed to have a minimal clinical effect on bone.
The study suggested that women with a history of hyper-
thyroidism or TSH suppression by thyroid hormone
should have skeletal status assessed by bone mineral den-
sitometry, preferably at a site containing cortical bone,
such as the hip or forearm [30].
Subjects and methods
Pre-assumptions
There are many factors influencing the behavior of our
system, which cannot be captured in a usable model. So
the first task is to simplify the model by reducing the
number of factors under consideration. The independent
variables may include; time (the duration of therapy),
Theoretical Biology and Medical Modelling 2007, 4:23 />Page 3 of 11
(page number not for citation purposes)
gender, race, family and personal medical history, diet,
hormonal changes, medications, alcohol ingestion, phys-
ical activity, medical conditions and diseases, etc. The
dependent variable is BMD. To simplify the problem we
assume that the patients are postmenopausal women
receiving suppressive LT4 therapy. It is desired to find the
value of BMD as a function of the duration and the dose
of LT4 therapy. Any remaining factor can be regarded as a
special case of a variable with unchanging numerical val-
ues, or in other word as a constant.
Topological considerations
The numerical value of bone mass density is determined
by measurement. The range of the variable may differ
depending on the characters and methods of measure-
ment and is the set of all points lying between the healthy
and frankly osteoporotic situations. To each value of time
t ∈ T, and dose m ∈ M, within certain ranges there corre-
sponds one value of the variable, bone mass density d ∈
D. Consider the sets T, D and M. The product set T × D ×
M is defined as T × D × M = {(t, d, m): t ∈ T, d ∈ D, m ∈
M}. But the set M can be written as M = {m : m = suppres-
sive dose s, m = replacement dose r}.
Symbolically, the relationship can be stated in function
notation as BMD = f (time, dose), with two submodels, d
= f
s
(t) for levothyroxine suppressive therapy, and d = f
r
(t)
for levothyroxine replacement therapy. To each function f
: T → D there corresponds a relation in T × D given by the
graph of f, {(t, f(t)):t ∈ T}. The domain of f is T, and its
range f [T] = {f(t):t ∈ T} is the quantity of d, from the nor-
mal to the extreme osteoporotic state. As mentioned
above we follow the case d = f
s
(t).
Statistical analysis and investigating the behavior of the
model
The independent variables time t and dose m are not ran-
dom but are quantities preselected by the investigator and
have no distributional properties. BMD d is also the
response to time and dose. So the problem is to find a pol-
ynomial function f that would represent the relationship
between d and t. The values of t at which turning points
occur can be found by solving f'(t) = 0, where f'(t) is the
first derivative of the function with respect to time. The
corresponding values of d are then determined by substi-
tuting the t values found in d = f(t). Also, the type of each
turning point can be tested via evaluating f"(t), the second
derivative of the function with respect to time.
Patients
Kung and Yeung [13] prospectively studied 46 postmeno-
pausal Chinese women, aged 63.4 ± 7.0 yr, with carci-
noma of thyroid after total thyroidectomy and radioactive
iodine ablation for 2 years. The aim was to evaluate the
rate of bone loss and to assess whether calcium supple-
mentation with or without intranasal calcitonin was able
to decrease the rate of bone loss. Among the patients, 34
were recruited randomly from the clinic to participate in a
cross-sectional study and were shown to have decreased
BMD. Two had suffered atraumatic fractures during T4
therapy. The other 12 were subsequently recruited if they
satisfied the inclusion criteria. None of the patients had
features of recurrent disease and did not require calcium
replacement for hypoparathyroidism. All were receiving a
stable dose of T4 for at least 1 yr in the form of levothyrox-
ine sodium (L-T,) suppressive therapy, i.e. all patients had
immeasurable TSH levels (<0.03 mIU/L). The subjects
had had regular menstruation before the menopause and
did not have late menarche, early menopause, or
oophorectomy. None had received hormonal contracep-
tive agents in the past. All were nonsmokers and non-
drinkers, and none was taking medications or drugs
known to affect bone mineral metabolism. There was no
known history of osteoporosis in the family.
All patients had received a stable dose of L-T4 for more
than 1 yr. All had TSH levels of 0.03 mIU/L or less and an
elevated free T4 (FT4) index, but normal T3 levels. The
subjects were randomized into three groups: 1) intranasal
calcitonin (200 IU daily) for 5 days/week plus 1000 mg
calcium daily, 2) calcium alone, or 3) placebo. Total body
and regional bone mineral density were measured by a
dual energy x-ray absorptiometry bone densitometer at 6-
month intervals. The results showed that both groups 1
and 2 had stable bone mass, whereas patients in group 3
showed significant bone loss at the end of 2 yr; there were
no differences between groups 1 and 2. The authors con-
cluded that T4-suppressive therapy is associated with
bone loss in postmenopausal women, which could be
prevented by either calcium supplementation or intrana-
sal calcitonin (Figure 1)
Results
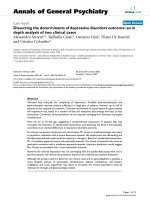
We concentrated on mean changes in regional BMD at the
spine, femoral neck, trochanter, and Ward's triangle in
patients receiving T4-suppressive therapy treated with pla-
cebo. We estimated curve using the SPSS system for per-
forming the regression for the response analysis. Initially
regional bone mass density was examined in the Ward's
triangle. The program fitted a cubic response model and
also provided some results that are useful for determining
the suitability of the model (Figure 2).
The coefficients in the last row yield the regression func-
tion d = 0086 2686t+.0107t
2
0006t
3
. The model was
constructed graphically using MATLAB. Solving the equa-
tion f'(t) = 0 yields two complex roots, 5.9444 ± 10.6639i.
We therefore solved f"(t) = 0 to find possible points of
inflexion. The answer was t = 5.94444, or about 6 months,
and this is compatible with the graph of f'(t) versus t. In
Theoretical Biology and Medical Modelling 2007, 4:23 />Page 4 of 11
(page number not for citation purposes)
the curve of BMD versus time, the slope is always negative.
In the graph of f'(t) versus time, f'(t) = 0 reaches a non-
zero maximum.
For the regional bone mass density in the trochanter the
program again fitted a cubic response model (Figure 3).
The regression function is d = 0200 0917t+.0069t
2
-
.0005t
3
. Solving f"(t) = 0 yields t = 4.6 or about 5 months,
at which there is a point of inflexion on the regression
curve and f'(t) reaches a maximum value.
For the third model, BMD changes in the spine were esti-
mated as a quadratic response (Figure 4). The equation of
the curve was d = 0457 1081t 004t
2
. Despite the high
R
2
, it seems that the graphical model can be improved.
Thus, we limited the time interval to [0,18] instead of
[0,24] and derived the equation d = 2639t+.0222t
2
-
.0010t
3
(Figure 5). This cubic model provides a better
graphical result and seems to be more compatible with
the curve of BMD changes at the spine (Figure 1) until the
18
th
month of therapy. There is a point of inflexion at t =
7.4 or about 7 months.
For the femoral neck, the regression curve is d = -
.0871+.1815t 0369t
2
+.0008t
3
(Figure 6). Again we got
better results by choosing the time interval [0,18] (Figure
7). The regression equation is d = 1694t+.0236t
2
0015t
3
and an inflexion occurs at t = 5.2444 or about 5 months.
Discussion
Osteoporosis affects 75 million people around the west-
ern world and Japan, many of whom are unaware of the
diagnosis until they suffer a life-altering fracture [31]. It
quietly progresses without symptoms until late stage com-
plications occur. The annual economic burden of oste-
oporosis in the United States alone exceeds that of
congestive heart failure, asthma and breast cancer com-
bined [32]. Therefore, the diagnosis, treatment and pre-
vention of osteoporosis is a national health emergency.
Bone mass density measurements have helped define a
prefracture diagnosis of osteoporosis to predict fracture
risk in postmenopausal women and elderly men, and to
monitor the course of disease processes that negatively
affect bone or therapeutic agents that can improve bone
strength. The fracture risk increases when suppressive
doses of levothyroxine are administered especially in
postmenopausal women. Suppression of thyrotropin
secretion is indicated in patients with thyroid cancer,
especially those with differentiated thyroid carcinoma,
because these tumors may be dependent on thyrotropin
[33]. Thyroxine is also given in an attempt to decrease the
size of the thyroid in patients with diffuse or nodular
goiter and to prevent regrowth after surgery.
The U.S. Preventive Services Task Force addressed screen-
ing for osteoporosis in postmenopausal women in 2002
[30]. Because of the tendency toward thyroid hormone-
induced cortical bone loss, Greenspan and Greenspan rec-
ommended testing bone mineral density at a cortical site
if only one site can be tested at a particular center. How-
ever, they stated that because national reimbursement
guidelines are by visit and technology rather than by
number of sites assessed, many centers routinely measure
bone mass of both the hip and the spine for the same cost.
No studies have specifically addressed the appropriate
timing of follow-up bone mineral density in this patient
population with TSH suppression. Standard guidelines
for the prevention of osteoporosis suggest that follow-up
be done in 1 to 2 years [29].
Most studies have reported bone loss in estrogen-deprived
post-menopausal women taking suppressive doses of L-
thyroxine. The variation of BMD in relation to the varia-
tion of time in these patients defines functions that can be
formulated in mathematical terms. We based our models
entirely on real world data. Data were used to suggest the
models and estimate the values of parameters appearing
in them. We then manipulated the model using mathe-
Changes in regional BMDFigure 1
Changes in regional BMD. Changes in regional BMD in
the spine, femoral neck, trochanter, and Ward's triangle in
patients receiving T4-suppressive therapy treated with intra-
nasal calcitonin plus calcium (▲), calcium alone (●), or pla-
cebo (❍). Values are the mean ± SD. P < 0.05 vs. baseline
reading. (With permission of Kung AW, Yeung SS. Preven-
tion of bone loss induced by thyroxine suppressive therapy in
postmenopausal women: the effect of calcium and calcitonin.
J Clin Endocrinol Metab 1996; 81:1232-6)
Theoretical Biology and Medical Modelling 2007, 4:23 />Page 5 of 11
(page number not for citation purposes)
matical techniques, graphical representation and compu-
ter aided numerical computation. Changes in regional
BMD versus time at the spine, femoral neck, trochanter,
and Ward's triangle in post-menopausal patients receiving
T4-suppressive therapy yielded four cubic polynomial
models. There are four points of inflexion on the graphs
of the equations at about 7, 5, 5 and 6 months for spine,
femoral neck, trochanter, and Ward's triangle, respec-
tively. In other words, a maximum speed of bone loss is
reached around the 6
th
month after the start of suppressive
L-thyroxine therapy in post-menopausal women. Thereaf-
ter, activation of compensatory mechanisms does not
seem implausible. Low bone mass is an important risk
factor for fractures and early identification of those indi-
viduals at risk of reduction in BMD caused by L-thyroxine
may facilitate early therapeutic intervention. So it seems
reasonable to check BMD at the 6
th
month. The potential
effects of L-T
4
on long-term BMD necessitate more longi-
Changes in BMD with respect to time in the Ward's triangleFigure 2
Changes in BMD with respect to time in the Ward's triangle. Polynomial regression for changes in regional BMD with
respect to time in the Ward's triangle. The observed data (+) and the linear ( ), quadratic ( ) and cubic (-) model, graph of f'(t)
vs. t and direction field for the Ward's triangle.
Theoretical Biology and Medical Modelling 2007, 4:23 />Page 6 of 11
(page number not for citation purposes)
tudinal studies and data to determine whether densitom-
etry or biochemical markers during the first year of
treatment can predict the degree of reduction of BMD.
Our models' predictions of the time of maximum rate of
change in bone mass density correspond reasonably well
to each other. Apart from graphical and statistical fitness,
this can be considered as a means to verify the models.
Any natural system can be studied phenomenologically in
order to reach a deeper knowledge of its behavior. Models
are simplified representations of certain aspects of real
world problems. They help to predict what will happen in
the future, or to estimate the effect of various factors on
the observed phenomenon. Modeling is an iterative proc-
ess and models may be simplified and refined repeatedly
Changes in BMD with respect to time in the trochanterFigure 3
Changes in BMD with respect to time in the trochanter. Polynomial regression for changes in regional BMD with
respect to time in the trochanter. The observed data (+) and the linear ( ), quadratic ( ) and cubic (-) model, graph of f'(t) vs.
t and direction field for the trochanter.
Theoretical Biology and Medical Modelling 2007, 4:23 />Page 7 of 11
(page number not for citation purposes)
to provide generality and precision. There are no precise
rules or exclusive techniques in mathematical or statistical
modeling. In our study we have tried to show that choos-
ing a different view of the same experiment may lead to
additional clinical inference. A bone density test provides
a numerical value for bone loss. Measurements can be eas-
ily, accurately and reproducibly taken from an individual
patient to establish a diagnosis of osteoporosis. Some
techniques take only a few minutes to perform enable the
areas of the skeleton most at risk of fracture to be assessed.
The density value for an individual patient can be com-
pared with a normal reference range. Modeling the effects
of therapeutic modalities on bone mass density provides
a rational basis for optimal dosing strategies. Also, such
models can provide starting point from which to design
experiments investigating the underlying pathophysiol-
ogy of osteoporosis.
Conclusion
This paper suggests that there may be a critical point on
the curve of BMD versus time in postmenopausal women
receiving suppressive LT4 therapy and shows how it can
be found using mathematical techniques. Much more sci-
entific information and research is needed to delineate the
cause, and to confirm the clinical application of this phe-
nomenon. But, such an approach can be used as a guide
for future experimentation with larger sample sizes. We
believe that the sophisticated application of mathematical
techniques may give useful solutions to difficult and com-
plex clinical problems.
Competing interests
The author(s) declare that they have no competing inter-
ests.
Authors' contributions
BM developed the mathematical model and wrote the ini-
tial draft. VH, SMT and BL identified the clinical data and
coordinated general edits and preparation of the final
manuscript. All authors read and approved the final man-
uscript.
Changes in BMD with respect to time in the spineFigure 4
Changes in BMD with respect to time in the spine. Polynomial regression for changes in regional BMD with respect to
time in the spine. The observed data (+) and the linear ( ), quadratic ( ) model.
Theoretical Biology and Medical Modelling 2007, 4:23 />Page 8 of 11
(page number not for citation purposes)
Changes in BMD with respect to time in the spine with shorter time intervalFigure 5
Changes in BMD with respect to time in the spine with shorter time interval. Polynomial regression for changes in
regional BMD with respect to time in the spine. The observed data (+) and the linear ( ), quadratic ( ) and cubic (-) model,
graph of f'(t) vs. t and direction field for the spine. Time interval [0,18].
Theoretical Biology and Medical Modelling 2007, 4:23 />Page 9 of 11
(page number not for citation purposes)
Changes in BMD with respect to time in the femoral neckFigure 6
Changes in BMD with respect to time in the femoral neck. Polynomial regression for changes in regional BMD with
respect to time in the femoral neck. The observed data (+) and the linear ( ), quadratic ( ) and cubic (-) model.
Theoretical Biology and Medical Modelling 2007, 4:23 />Page 10 of 11
(page number not for citation purposes)
Acknowledgements
We thank Dr. Amir H Assadi for his invaluable advice.
References
1. World Health Organization: Assessment of fracture risk and its applica-
tion to screening for postmenopausal osteoporosis: Report of a WHO Study
Group. (Technical report series 843.) Geneva, Switzerland: World
Health Organization; 1994.
2. Evans RA, Marel GM, Lancaster EK, Kos S, Evans M, Wong SYP: Bone
mass is low in relatives of osteoporotic patients. Ann Intern
Med 1988, 109:870-873.
3. U.S. Preventive Services Task Force: Hormone Therapy for the
Prevention of Chronic Conditions in Postmenopausal
Women. Recommendations from the U.S. Preventive Services Task Force
2005, 142(10):855-860.
4. Lindsey C, Brownbill RA, Bohannon RA, Ilich JZ: Association of
physical performance measures with bone mineral density in
postmenopausal women. Arch Phys Med Rehabil 2005, 86:1102-7.
5. Siddiqi A, Burrin JM, Noonan K, James I, Wood DF, Price CP, Monson
JP: A longitudinal study of markers of bone turnover in graves
' disease and their value in predicting bone mineral density.
J Clin Endocrinol Metab 1997, 82:753-759.
6. Bartalena L, Bogazzi F, Martino E: Adverse effects of thyroid hor-
mone preparations and antithyroid drugs. Drug Saf 1996,
15:53-63.
7. Anthony Toft D: Thyroxine Therapy. N Engl J Med 1994,
331:174-180.
Changes in BMD with respect to time in the femoral neck with shorter time intervalFigure 7
Changes in BMD with respect to time in the femoral neck with shorter time interval. Polynomial regression for
changes in regional BMD with respect to time in the femoral neck. The observed data (+) and the linear ( ), quadratic ( ) and
cubic (-) model, graph of f'(t) vs. t and direction field for the femoral neck. Time interval [0,18].
Theoretical Biology and Medical Modelling 2007, 4:23 />Page 11 of 11
(page number not for citation purposes)
8. Anthony Toft D: Subclinical Hyperthyroidism. N Engl J Med
2001, 345:512-516.
9. Mudde AH, Reijnders FJL, Kruseman AC: Peripheral bone density
in women with untreated multinodular goiter. Clin Endocrinol
1992, 37(1):35-39.
10. Földes J, Tarjan G, Szathmari M, Varga F, Krasznai I, Horvath CS:
Bone mineral density in patients with endogenous subclinical
hyperthyroidism: is this thyroid status a risk factor for oste-
oporosis? Clin Endocrinol 1993, 39(5):521-527.
11. Diamond T, Nery L, Hales I: A therapeutic dilemma: suppres-
sive doses of thyroxine significantly reduce bone mineral
measurements in both premenopausal and postmenopausal
women with thyroid carcinoma. J Clin Endocrinol Metab 1991,
72:1184-8.
12. Lehmke J, Bogner U, Felsenberg D, Peters H, Schleusener H: Deter-
mination of bone mineral density by quantitative computed
tomography and single photon absorptiometry in subclinical
hyperthyroidism: a risk of early osteopaenia in post-meno-
pausal women. Clin Endocrinol 1992, 36(5):511-517.
13. Kung AW, Yeung SS: Prevention of bone loss induced by thy-
roxine suppressive therapy in postmenopausal women: the
effect of calcium and calcitonin. J Clin Endocrinol Metab 1996,
81:1232-6.
14. Schneider DL, Barrett-Connor EL, Morton DJ: Thyroid hormone
use and bone mineral density in elderly women. Effects of
estrogen. JAMA 1994, 271:1245-9.
15. Franklyn J, Betteridge J, Holder R, Daykin J, Lilley J, Sheppard M: Bone
mineral density in thyroxine treated females with or without
a previous history of thyrotoxicosis. Clin Endocrinol 1994,
41:425-32.
16. Ongphiphadhanakul B, Puavilai G, Rajatanavin R: Effect of TSH-sup-
pressive doses of levothyroxine on bone mineral density in
Thai women. J Med Assoc Thai 1996, 79:563-7.
17. De Rosa G, Testa A, Giacomini D, Carrozza C, Astazi P, Caradonna
P: Prospective study of bone loss in pre- and post-menopau-
sal women on L-thyroxine therapy for non-toxic goiter. Clin
Endocrinol 1997,
47(5):529-535.
18. Hanna FW, Pettit RJ, Ammari F, Evans WD, Sandeman D, Lazarus JH:
Effect of replacement doses of thyroxine on bone mineral
density. Clin Endocrinol 1998, 48(2):229-234.
19. Florkowski CM, Brownlie BE, Elliot JR, Ayling EM, Turner JG: Bone
mineral density in patients receiving suppressive doses of
thyroxine for thyroid carcinoma. N Z Med J 1993, 106:443-4.
20. Nuzzo V, Lupoli G, Esposito Del Puente A, Rampone E, Carpinelli A,
Del Puente AE, Oriente P: Bone mineral density in premeno-
pausal women receiving levothyroxine suppressive therapy.
Gynecol Endocrinol 1998, 12:333-7.
21. Marcocci C, Golia F, Vignali E, Pinchera A: Skeletal integrity in
men chronically treated with suppressive doses of L-thyrox-
ine. J Bone Miner Res 1997, 12:72-7.
22. Franklyn JA, Betteridge J, Daykin J, Holder R, Oates GD, Parle JV, Lil-
ley J, Heath DA, Sheppard MC: Long-term thyroxine treatment
and bone mineral density. Lancet 1992, 340:9-13.
23. Reverter JL, Holgado S, Alonso N, Salinas I, Granada ML, Sanmarti A:
Lack of deleterious effect on bone mineral density of long-
term thyroxine suppressive therapy for differentiated thy-
roid carcinoma. Endocr Relat Cancer 2005, 12(4):973-81.
24. Giannini S, Nobile M, Sartori L, Binotto P, Ciuffreda M, Gemo G,
Pelizzo MR, D'Angelo A, Crepaldi G: Bone density and mineral
metabolism in thyroidectomized patients treated with long-
term L-thyroxine. Clin Sci (Lond) 1994, 87(5):593-7.
25. Gorres G, Kaim A, Otte A, Gotze M, Muller-Brand J: Bone mineral
density in patients receiving suppressive doses of thyroxine
for differentiated thyroid carcinoma. Eur J Nucl Med 1996,
23(6):690-2.
26. Appetecchia M: Effects on bone mineral density by treatment
of benign nodular goiter with mildly suppressive doses of L-
thyroxine in a cohort women study. Horm Res 2005,
64(6):293-8.
27. Ribot C, Tremollieres F, Pouilles JM, Louvet JP: Bone mineral den-
sity and thyroid hormone therapy. Clin Endocrinol 1990,
33:143-53.
28. Jodar E, Begona Lopez M, Garcia L, Rigopoulou D, Martinez G,
Hawkins F: Bone changes in pre- and postmenopausal women
with thyroid cancer on levothyroxine therapy: evolution of
axial and appendicular bone mass. Osteoporos Int 1998, 8:311-6.
29. Greenspan SL, Greenspan FS: The effect of thyroid hormone on
skeletal integrity. Ann Intern Med 1999, 130:750-758.
30. U.S. Preventive Services Task Force: Screening for osteoporosis
in postmenopausal women: recommendations and ration-
ale. Ann Intern Med 2002, 137:526-8.
31. Lindsay R, Christiansen C, Einhorn TA, Hart DM, Ljunghall S, Mau-
talen CA, Meunier PJ, Morii H, Mundy GR, Rapado A, Stevenson J:
Who are candidates for prevention and treatment for oste-
oporosis. Osteoporosis Int 1997, 7:1-6.
32. Kanis KA: Osteoporosis and its consequences Osteoporosis Blackwell
Science Ltd; 1993.
33. Mazzaferri EL: Papillary thyroid carcinoma: factors influencing
prognosis and current therapy. Semin Oncol 1987, 14:315-332.