Báo cáo y học: "The relationship between twitch depression and twitch fade during neuromuscular block produced by vecuronium: correlation with the release of acetylcholine" ppsx
Bạn đang xem bản rút gọn của tài liệu. Xem và tải ngay bản đầy đủ của tài liệu tại đây (499.21 KB, 7 trang )
BioMed Central
Page 1 of 7
(page number not for citation purposes)
Theoretical Biology and Medical
Modelling
Open Access
Research
The relationship between twitch depression and twitch fade during
neuromuscular block produced by vecuronium: correlation with the
release of acetylcholine
Shashi B Bhatt*
1
, Jack Kohl
1
, Anton Amann
2
and Vladimir Nigrovic
1
Address:
1
Department of Anesthesiology, College of Medicine, University of Toledo, Toledo, OH, USA and
2
Department of Anesthesiology and
Critical Care Medicine, Medical University of Innsbruck, Innsbruck, Austria, and Department of Environmental Sciences, Federal Institute of
Technology, Zürich, Switzerland
Email: Shashi B Bhatt* - ; Jack Kohl - ; Anton Amann - ;
Vladimir Nigrovic -
* Corresponding author
Abstract
Background: Train-of-four stimulation pattern following the administration of non-depolarizing
neuromuscular blocking drugs reveals fade on successive contractions. Fade is caused by the
release of fewer acetylcholine molecules by the fourth (A
4
) than by the first stimulus (A
1
). The
current study was conducted to define the relationship between the clinically observed fade and
the simulated decline in acetylcholine release (A
4
/A
1
) that would be necessary to produce it.
Methods: The T
4
/T
1
ratios produced by different doses of vecuronium (15–80 μg·kg
-1
) were
plotted as a function of the concomitant T
1
. Separately in a model of neuromuscular transmission,
T
1
, T
4
, and T
4
/T
1
were estimated using simulations in the presence and in the absence of a
neuromuscular blocking drug and a stepwise decrease in A
4
, but constant A
1
.
Results: Vecuronium induced neuromuscular block was associated with larger T
4
/T
1
ratios (less
fade) during the onset than during the offset of the block. All doses caused similar fade during offset.
Simulations revealed that the smallest T
4
/T
1
was associated with the nadir of A
4
/A
1
and occurred
at the beginning of T
1
recovery. The nadir of A
4
/A
1
was only marginally affected by the dose of
vecuronium: 15 μg·kg
-1
producing the minimum A
4
/A
1
of 0.8 and 80 μg·kg
-1
the minimum A
4
/A
1
of
0.7.
Conclusion: The hysteresis in the fade between onset and offset appears to be caused by a
delayed decrease of A
4
/A
1
as compared with the decrease in T
1
. Tentative estimates of the
decrease in A
4
/A
1
during fade produced by vecuronium are offered. However, the validity of these
estimates is dependent on the validity of the assumptions made in simulations.
Background
Non-depolarizing neuromuscular blocking drugs cause a
dose-dependent decrease in the indirectly evoked muscle
contractions (twitches). Upon repetitive stimulation, the
successive twitches during partial nondepolarizing block
are reduced more than the first twitch. This phenomenon
is known as fade. The ratio of the twitch strength pro-
duced by the fourth stimulus (T
4
) compared to that pro-
Published: 16 July 2007
Theoretical Biology and Medical Modelling 2007, 4:24 doi:10.1186/1742-4682-4-24
Received: 8 May 2007
Accepted: 16 July 2007
This article is available from: />© 2007 Bhatt et al; licensee BioMed Central Ltd.
This is an Open Access article distributed under the terms of the Creative Commons Attribution License ( />),
which permits unrestricted use, distribution, and reproduction in any medium, provided the original work is properly cited.
Theoretical Biology and Medical Modelling 2007, 4:24 />Page 2 of 7
(page number not for citation purposes)
duced by the first stimulus (T
1
), i.e. T
4
/T
1
, elicited by a
train-of-four (TOF) stimuli is of interest to both anesthe-
siologists and physiologists. Anesthesiologists use the T
4
/
T
1
ratio as an indirect measure of the still present muscle
paralysis [1-3], while physiologists study the fade to gain
insight into the processes of neuromuscular transmission
[4-6].
Bowman [7] and others [4,8-10] have suggested that neu-
romuscular blocking drugs produce twitch fade during
repetitive stimulation by binding to the presynaptic
cholinoceptors and inhibiting the positive auto-feedback
action of acetylcholine (ACh) on its own release elicited
during repetitive stimulation. This action of neuromuscu-
lar blocking drugs causes the stimuli following the first
stimulus to release fewer ACh molecules.
We have conducted the following study in an attempt to
relate the clinically observed twitch fade, to the decrease
in ACh that could account for the fade elicited by a train
of four stimuli. In the first part of the investigation, we
studied twitch depression and twitch fade in human sub-
jects following the administration of different doses of
vecuronium. In the second part, we expanded our model
of neuromuscular transmission[11] by considering a
decrease in the release of ACh elicited by the fourth stim-
ulus.
Methods
Clinical experiments
After approval by the local IRB, 21 ASA physical status I or
II, adult non-obese subjects scheduled for elective surgery
consented to participate in the study. Following the i.v.
administration of midazolam 1 – 2 mg and fentanyl 3 – 5
μg·kg
-1
, anesthesia was induced with propofol 2 – 3 mg·
kg
-1
. Tracheal intubation was performed following the
topical application of lidocaine (4%, 3 ml). Anesthesia
was maintained with propofol infusion (100–150 μg·kg
-
1·
min
-1
) and 66% N
2
O in oxygen. Ventilation was con-
trolled to maintain normocapnia.
The thumb of one hand was abducted (preload between
250 g and 300 g) and connected to a force transducer
(Gould FT-10, Grass Telefactor, West Warwick, RI). The
signal from the force transducer was amplified, digitized
at 100 Hz, and recorded on a PC using PolyVIEW data
acquisition and analysis software (version 2.5, Astro-Med,
Inc., West Warwick, RI) for subsequent analysis.
Supramaximal stimuli were delivered to the ulnar nerve at
the wrist via skin electrodes. Baseline stabilization was
obtained by applying 1 Hz stimuli for 20 minutes. Follow-
ing the stabilization period, the stimulation was changed
to a TOF pattern, i.e. four supramaximal stimuli at 2 Hz,
and the trains repeated at 12 s intervals. Vecuronium was
injected in doses ranging from 15 μg·kg
-1
to 80 μg·kg
-1
.
The doses were chosen to produce a wide range of twitch
depression, including the complete ablation of T
1
. The
recorded strengths of T
1
and T
4
were expressed as fractions
of T
1
before the administration of vecuronium. The
recordings were continued until complete spontaneous
recovery from the neuromuscular block. The results are
reported only for those subjects in whom T
1
returned to
within ± 10% of the baseline.
Simulation of T
1
and T
4
as related to the release of
acetylcholine by the first and the fourth stimuli
The strength of the twitches elicited by the first and the
fourth stimuli in a TOF stimulation pattern was simulated
in the model of neuromuscular transmission [11]. The
model considers the stimulus-induced release of ACh into
a synaptic cleft, ACh binding to two sites at a single post-
synaptic receptor, and ACh hydrolysis. The number of
ACh molecules released by the first stimulus was postu-
lated to establish a constant initial concentration of ACh,
[A]
1
= 7.75 × 10
-6
M. The model was expanded by assum-
ing that the fourth stimulus releases either the same or a
smaller number of ACh molecules, and establishes the
initial concentration of ACh in the synaptic cleft denoted
by [A]
4
. The ratio [A]
4
/[A]
1
was assigned nine values from
1.0 to 0.8 in steps of 0.025, and two additional values for
[A]
4
/[A]
1
= 0.75 and 0.70. The concentration of the posts-
ynaptic receptors in the synaptic cleft, [R], was assumed to
be 7.75 × 10
-5
M [11].
Binding of ACh to two sites at a postsynaptic receptor was
defined by the association rate constant k
association
identical
for both sites, k
association
= 1.35 × 10
8
M
-1·
s
-1
. The assigned
dissociation rate constants, k
dissociation
, were different: for
site
1
k
dissociation
= 1350 s
-1
, and for site
2
k
dissociation
=
13500 s
-1
. The assignments define two equilibrium disso-
ciation constants, K
A1
= 10
-5
M for site
1
, and K
A2
= 10
-4
M
for site
2
. Affinities of ACh for the binding sites are the
reciprocals of the equilibrium dissociation constants.
After the release of ACh, three complexes are formed
between ACh and the receptors: ARO, ORA, and ARA.
Here, the first and the third letter indicate the species
occupying site
1
and site
2
, A is ACh, O is an empty site, and
R is the postsynaptic receptor. The complex ARA repre-
sents the activated postsynaptic receptors. The concentra-
tions of all three complexes increase transiently after the
release of ACh, reach a peak, and subsequently decline
due to hydrolysis of free ACh. We assigned a first-order
rate constant for hydrolysis of ACh (k
hydrolysis
) at 12000 s
-
1
[11].
The strength of T
1
or T
4
was calculated based on the
assumption that a muscle fiber contracts when [ARA]
reaches or surpasses the threshold level of [ARA] for that
fiber [11]. The strength of T
1
or T
4
depends on the number
of contracting fibers. All those fibers with a threshold
[ARA] at or below the calculated peak value of [ARA] con-
tract. The twitches, be it T
1
or T
4
, were calculated identi-
Theoretical Biology and Medical Modelling 2007, 4:24 />Page 3 of 7
(page number not for citation purposes)
cally using the calculated peak value of [ARA] after the first
or the fourth stimulus:
where γ
A
characterizes the distribution of the threshold
[ARA] among the fibers of the muscle and [ARA50] is the
median of all threshold [ARA] [11]. We used the previ-
ously defined values: γ
A
= 4.732 and [ARA50] = 9.524 ×
10
-9
M [11].
The hypothetical muscle relaxant D competes with ACh
for binding to the same two sites at a postsynaptic recep-
tor. The assigned constants for the interaction were: k
associ-
ationD
identical for both binding sites, k
associationD
= 4.0 ×
10
8
M
-1
s
-1
, and the equilibrium dissociation constants K
D1
= 10
-7
for site
1
and K
D2
= 10
-6
M for site
2
. The dissociation
rate constants were calculated from k
dissociationD
= K
D
·k
asso-
ciationD
. Similar to ACh, the muscle relaxant D produces
three types of complexes by itself, e.g. DRO, ORD and
DRD, and two additional mixed complexes with ACh,
ARD and DRA. The molar concentrations of D in the syn-
aptic cleft are labeled [D]
synaptic cleft
. Higher [D]
synaptic cleft
leads to a larger fraction of the postsynaptic receptors
occupied by D. In the calculations, we used 100 logarith-
mically equidistant values for a 10-fold increase in [D]
syn-
aptic cleft
to produce T
1
declining from its maximal value to
0.05. This was achieved by increasing [D] from 1· 10
-8
to
5· 10
6
M. We assumed that the decrease in T
1
is produced
exclusively by increased [D] and, hence, an increased
occupancy of the postsynaptic receptors. On the other
hand, the decrease in T
4
is caused by a combination of
increased postsynaptic receptor occupancy and the dimin-
ished release of ACh elicited by the fourth stimulus. Neu-
romuscular block (NMB) was defined as the difference in
strength of T
1
in the absence and the presence of a muscle
relaxant.
The calculations were performed using the program
MATHEMATICA (version 5.2) from Wolfram Research,
Inc., Champaign, IL.
Results
Although 21 subjects were studied, the first twitch
returned to within ± 10% of the baseline in only 15 sub-
jects and only the data from these subjects are presented.
Since our measurement technique did not allow us to
measure twitch tension with precision once T
1
decreased
to below 10% of its baseline value, we have not included
in our analysis any data, be it for T
1
or T
4
/T
1
ratios, for T
1
< 0.1.
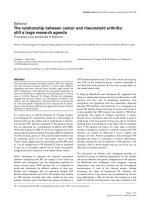
In all subjects studied, the peak depression of T
4
lagged
behind the peak depression of T
1
, and the minimum T
4
was always lower than the minimum T
1
. This is illustrated
for two subjects who received vecuronium doses of 15
μg·kg
-1
or 35 μg·kg
-1
, respectively (upper panel in Figure
1). The plot of T
4
/T
1
as a function of T
1
for the same two
subjects reveals that, for any given value of T
1
, the T
4
/T
1
ratio is higher during the onset than during the offset of
NMB (lower panel in Figure 1).
The T
4
/T
1
ratios as a function of T
1
for various doses of
vecuronium during the onset of NMB are presented in the
upper panel of Figure 2. To simplify the presentation, only
one representative subject is presented for each dose. The
results indicate that, at any level of T
1
, the T
4
/T
1
ratios are
higher, i.e. the twitch fade is less pronounced, with larger
doses of vecuronium. Thus, at T
1
= 0.5, a vecuronium dose
of 20 μg·kg
-1
produced T
4
/T
1
= 0.4. However, at the same
T
1
, T
4
/T
1
was 0.78 in the subject who received the dose of
80 μg·kg
-1
.
Twitch
peak ARA
peak ARA ARA
A
AA
=
+
[]
[][ ]
γ
γγ
50
Time-course of the first (T
1
) and the fourth twitch (T
4
) in two subjects following the injection of vecuroniumFigure 1
Time-course of the first (T
1
) and the fourth twitch (T
4
) in
two subjects following the injection of vecuronium. The dose
of vecuronium was 15 μg·kg
-1
in one subject (filled symbols)
and 35 μg·kg
-1
in the second subject (open symbols, upper
panel). The dotted line parallel with the Time axis indicates
twitch = 0.1. The lower panel presents the T
4
/T
1
ratios as a
function of T
1
for the same two subjects. The loops com-
mence at T
1
= 1.0 and T
4
/T
1
= 1.0 and then follow the direc-
tion indicated by arrows. The dotted line parallel with the T
4
/
T
1
axis indicates T
1
= 0.1.
Theoretical Biology and Medical Modelling 2007, 4:24 />Page 4 of 7
(page number not for citation purposes)
When compared at identical values of T
1
, the T
4
/T
1
ratios
during the offset of NMB (lower panel in Figure 2) were
lower than those observed during the onset. The ratios
were similar among the different doses of vecuronium
during the offset. Therefore, we have summarized the data
for T
4
/T
1
during the offset of NMB at T
1
= 0.25, 0.5, 0.75,
and 0.9, and present the mean ± SD in Figure 2.
The simulations produced 11 curves, one for each [A]
4
/
[A]
1
value, relating T
4
/T
1
to T
1
(Figure 3). The curves indi-
cate the inter-relationship between T
1
, T
4
/T
1
, and [A]
4
/
[A]
1
. The relationship may be summarized as follows: (i)
at a constant T
1
, the T
4
/T
1
ratio is higher for higher [A]
4
/
[A]
1
; (ii) at a constant [A]
4
/[A]
1
, the T
4
/T
1
ratio is lower for
lower values of T
1
; (iii) a given T
4
/T
1
may be associated
with many combinations of [A]
4
/[A]
1
and T
1
; and (iv) a
pair of T
4
/T
1
-T
1
values is associated with a unique value of
[A]
4
/[A]
1
. If the fourth stimulus releases the same number
of ACh molecules as does the first, i.e. if [A]
4
/[A]
1
= 1, then
T
4
remains equal to T
1
, i.e. T
4
/T
1
= 1, for any value of T
1
(Figure 3).
Upper panel: The ratios of the fourth to the first twitch (T
4
/T
1
) as a function of T
1
Figure 3
Upper panel: The ratios of the fourth to the first twitch (T
4
/
T
1
) as a function of T
1
. The 11 curves were obtained in simu-
lations assuming a constant amount of acetylcholine released
by the first stimulus ([A]
1
) and either the same or smaller
amounts released by the fourth stimulus ([A]
4
). The ratios of
the initial concentrations of acetylcholine released by the
fourth and the first stimulus are denoted by [A]
4
/[A]
1
. The
continuous bold curves indicate, in descending order, [A]
4
/
[A]
1
ratios of 1.0, 0.9, 0.8, and 0.7, respectively. For the inter-
mediate values of [A]
4
/[A]
1
see Methods. Lower panel: The
observed T
4
/T
1
-T
1
data pairs during the onset of NMB and
the mean values during the offset are inserted into the grid of
the T
4
/T
1
versus T
1
curves presented in the upper panel. The
observed data are those presented in Figure 2.
Upper panel: The ratios of the fourth to the first twitch (T
4
/T
1
) as a function of the first twitch (T
1
) for various doses (μg·kg
-1
) of vecuronium (individual subjects) during the onset of neuromuscular blockFigure 2
Upper panel: The ratios of the fourth to the first twitch (T
4
/
T
1
) as a function of the first twitch (T
1
) for various doses
(μg·kg
-1
) of vecuronium (individual subjects) during the onset
of neuromuscular block. At the moment of vecuronium
injection, T
1
= 1.0 and T
4
/T
1
= 1.0. Lower panel: T
4
/T
1
ratio
(mean ± SD) as a function of T
1
(at T
1
= 0.25, 0.5, 0.75, and
0.9) for all doses of vecuronium during the offset of neu-
romuscular block. The number of subjects is indicated by n.
The temporal sequence of observations starts at the lowest
value of T
1
and progresses toward higher values of T
1
. The
label for the X-axis is identical to the label of the X-axis in
the upper panel.
Theoretical Biology and Medical Modelling 2007, 4:24 />Page 5 of 7
(page number not for citation purposes)
T
4
/T
1
-T
1
data pairs observed during the onset of NMB pro-
duced by different doses of vecuronium, as well as the
mean values of T
4
/T
1
-T
1
observed in all patients during the
offset of NMB (Figure 2), were superimposed on the grid
relating T
4
/T
1
ratios to T
1
at different levels of [A]
4
/[A]
1
(lower panel in Figure 3). The superimposition helps to
clarify the relationship between the clinically observed
data pairs and the simulated [A]
4
/[A]
1
ratios.
The maximal decrease in [A]
4
/[A]
1
appears to be influ-
enced only minimally by the dose of vecuronium. For
example, the smallest dose (15 μg·kg
-1
) decreased T
1
to
0.8 and [A]
4
/[A]
1
to 0.82. The largest dose (80 μg·kg
-1
)
produced a complete ablation of T
1
and yet decreased
[A]
4
/[A]
1
to only 0.7.
The relationship between the observed T
4
/T
1
-T
1
data pairs
and the simulated T
4
/T
1
versus T
1
curves as a function of
the [A]
4
/[A]
1
ratios was examined in more detail in a sin-
gle subject. The dose of vecuronium in this subject was 25
μg·kg
-1
and the complete observed time-course for T
4
/T
1
versus T
1
is presented (Figure 4). The results indicate that
the T
4
/T
1
ratios correspond to different [A]
4
/[A]
1
during
the onset and offset of NMB. Interpolation of the
observed T
4
/T
1
-T
1
data pairs between the simulated [A]
4
/
[A]
1
curves permitted us to plot the approximate [A]
4
/[A]
1
ratios as a function of time after the injection of vecuro-
nium in this subject (lower panel in Figure 4). The results
reveal that, during the onset of NMB, the decrease in [A]
4
/
[A]
1
lags behind the decrease in T
1
. The peak depression of
[A]
4
/[A]
1
occurred approximately ten min after the injec-
tion of vecuronium, while the peak depression of T
1
occurred after 4.5 min.
Discussion
Our finding that vecuronium produces less fade for any
given twitch depression during the onset compared to the
offset of NMB (Figure 2) is consistent with the findings
reported by other investigators [12-16]. We have also
found that, during the onset and at similar T
1
, larger doses
of vecuronium produce less fade than smaller doses (Fig-
ure 2). This finding is also consistent with the results from
other investigations [14,15]. During the offset of NMB,
the pooled T
4
/T
1
-T
1
data pairs from all subjects (Figure 2)
are similar to those reported by other investigators using
vecuronium as well as other neuromuscular blocking
drugs [12-16].
The primary purpose of the present study was to correlate
twitch fade, as observed in the current study and by the
other investigators, with the decrease in ACh release that
would be necessary to produce the fade. The simulations
are based on the postulate by Bowman [7] that twitch fade
is due to the decreased amount of ACh released by the
fourth stimulus as compared to that released by the first
stimulus. The correlation between the clinically observed
fade and the simulated decrease in [A]
4
/[A]
1
allowed us to
suggest tentative estimates for the vecuronium-induced
decrease of ACh release elicited by the fourth stimulus
during the TOF pattern of stimulation.
We have previously investigated in simulations twitch
fade caused by nondepolarizing muscle relaxants [17].
However, in that report we were interested in the proper-
ties of the muscle relaxants in relation to their interaction
with the presynaptic receptors (the affinities and the rates
of interaction). In the current study, our focus is on the
estimate of the magnitude of the [A]
4
/[A]
1
ratio necessary
to explain the fade.
Upper panel: The complete set of the ratios of the fourth (T
4
) to the first twitch (T
1
) as a function of the concomitant T
1
observed in a single subjectFigure 4
Upper panel: The complete set of the ratios of the fourth (T
4
)
to the first twitch (T
1
) as a function of the concomitant T
1
observed in a single subject. The dose of vecuronium was 25
μg·kg
-1
. The grid of the 11 curves is that presented in Figure
3. The dashed line parallel with the Y-axis indicates the mini-
mal T
1
. Lower panel: The observed values of T
4
/T
1
were inter-
polated between the [A]
4
/[A]
1
curves to obtain [A]
4
/[A]
1
values at times of the observed T
4
/T
1
-T
1
data pairs. The esti-
mated [A]
4
/[A]
1
values are plotted as a function of time
elapsed from the injection of vecuronium. The time-course
of T
1
depression in the same subject is also plotted (right Y-
axis, filled circles). The dashed line parallel with the Y-axis
indicates the time of the minimal T
1
.
Theoretical Biology and Medical Modelling 2007, 4:24 />Page 6 of 7
(page number not for citation purposes)
The simulated result that no fade is present if the amount
of ACh released by the fourth stimulus remains identical
to that released by the first stimulus, i.e. if [A]
4
= [A]
1
(Fig-
ure 3), contradicts the suggestion that, even in the absence
of neuromuscular blocking drugs, a spontaneous fall-off
of the ACh quantal content occurs at 2 Hz stimulation fre-
quency [18]. If there were a spontaneous fall-off in ACh
quantal content upon repetitive stimulation, then in the
presence of a drug that binds exclusively to the postsynap-
tic receptors, e.g. α-bungarotoxin or erabutoxin, the spon-
taneous fall-off in ACh release would, of necessity, lead to
fade. However, it has been demonstrated repeatedly that
these drugs produce a profound decrease in twitch height
without producing fade [5,6,19]. Thus, the results of our
simulations accord with, and support the notion of, no
decline in ACh quantal content during the TOF pattern of
stimulation in the absence of nondepolarizing neuromus-
cular blocking drugs [9,20,21].
The results from our simulations suggest that fade, i.e. T
4
< T
1
, depends on both T
1
and [A]
4
/[A]
1
(Figure 3). Signal
transmission across the neuromuscular junction results
from a bimolecular reaction, i.e. from ACh binding to the
postsynaptic receptors. A minor decrease in one of the
partners, be it of ACh or the postsynaptic receptors, to its
threshold concentration is not accompanied by failure of
the muscle fibers to contract. This phenomenon is known
as the safety factor [22]. Our simulations suggest that,
with one partner at its threshold concentration, a concom-
itant decrease in the concentration of the other partner
decreases the safety factor below its critical values in some
muscle fibers. Failure of these fibers to contract leads to a
decrease in twitch strength and, if the twitch is T
4
, a lower
T
4
/T
1
.
All the T
4
/T
1
-T
1
data pairs observed in our study and those
reported by other investigators may be interpreted on the
basis of the simulated T
4
/T
1
versus T
1
relationship and
assuming different [A]
4
/[A]
1
ratios. The observed T
4
/T
1
ratios correspond to [A]
4
/[A]
1
varying from 1.0 to 0.7.
There appears to be a ceiling effect for the maximal
decrease in [A]
4
/[A]
1
. Even the largest doses of vecuro-
nium did not lead to [A]
4
/[A]
1
< 0.7.
Whereas the lower [A]
4
/[A]
1
ratios explain twitch fade, the
lower ratios by themselves are insufficient to explain that:
(i) the minimal value of T
4
is attained later than the min-
imal value of T
1
(Figure 1); (ii) twitch fade is not as exten-
sive during the onset as during the offset of NMB (Figure
2); and (iii) during the onset, larger doses of vecuronium
produce less fade at a given T
1
than the smaller doses (Fig-
ure 2). These findings, confirming the previous findings of
other investigators, are best explained by invoking a slow
association of the nondepolarizing neuromuscular block-
ing drug with the presynaptic receptors and, hence, a slow
development of the decrease in [A]
4
/[A]
1
[8,14]. The
slower development of the decrease in [A]
4
/[A]
1
relative to
the development of T
1
depression (Figure 4) also explains
the phenomenon that larger doses of neuromuscular
blocking drugs produce less fade (during the onset of
NMB) as compared with smaller doses. The reason is that
the neuromuscular block develops faster with larger doses
of a muscle relaxant. Thus, T
1
= 0.05 is reached sooner fol-
lowing the doses 2 · ED95 or 3 · ED95 than following 1
· ED95 of the same muscle relaxant. The fast develop-
ment of the decrease of T
1
does not allow sufficient time
for [A]
4
/[A]
1
to decrease (cf. lower panel in Figure 4) and,
as a consequence, the T
4
/T
1
ratio is higher during the onset
of the neuromuscular block following the larger doses of
a muscle relaxant.
The correlation of the clinically observed time course of
twitch fade to the simulated time course in the decrease in
[A]
4
/[A]
1
as well as the findings that the decrease in [A]
4
/
[A]
1
develops slowly do not reveal the processes leading to
the decrease in [A]
4
/[A]
1
.
Conclusion
The postulates that (i) the fourth stimulus releases fewer
ACh molecules than the first, and (ii) the decrease in [A]
4
/
[A]
1
develops slower than the decrease in T
1
, adequately
explain the T
4
/T
1
-versus-T
1
relationship observed with
vecuronium. The doses of vecuronium used in this study
decrease the amount of ACh released by the fourth stimu-
lus up to about 70% of the amount released by the first
stimulus. However, the validity of these estimates is
dependent on the validity of the assumptions made in
simulations.
Competing interests
The author(s) declare that they have no competing inter-
ests.
Authors' contributions
SBB conceived the study, designed the clinical experi-
ments, carried them out, performed data analysis, con-
ceived the theoretical analysis and drafted the manuscript.
JK performed the clinical experiments and contributed in
drafting the manuscript.
AA performed the calculations for the theoretical analysis
part of the study and contributed to formulating the theo-
retical analysis and in drafting and revising the manu-
script.
VN assisted in designing the experiments and in data anal-
ysis, assisted in calculations for the theoretical analysis,
and contributed in drafting and revising the manuscript.
Publish with BioMed Central and every
scientist can read your work free of charge
"BioMed Central will be the most significant development for
disseminating the results of biomedical research in our lifetime."
Sir Paul Nurse, Cancer Research UK
Your research papers will be:
available free of charge to the entire biomedical community
peer reviewed and published immediately upon acceptance
cited in PubMed and archived on PubMed Central
yours — you keep the copyright
Submit your manuscript here:
/>BioMedcentral
Theoretical Biology and Medical Modelling 2007, 4:24 />Page 7 of 7
(page number not for citation purposes)
All authors read and approved the final manuscript.
Acknowledgements
AA greatly appreciates the support by the Bernhard-Lang Research Asso-
ciation. The study was supported by the funds of the Department of
Anesthesiology, College of Medicine, University of Toledo.
References
1. Ali HH, Savarese JJ, Lebowitz PW, Ramsey FM: Twitch, tetanus and
train-of-four as indices of recovery from nondepolarizing
neuromuscular blockade. Anesthesiology 1981, 54(4):294-297.
2. Ali HH, Utting JE, Gray C: Stimulus frequency in the detection
of neuromuscular block in humans. Br J Anaesth 1970,
42(11):967-978.
3. Kopman AF, Yee PS, Neuman GG: Relationship of the train-of-
four fade ratio to clinical signs and symptoms of residual
paralysis in awake volunteers. Anesthesiology 1997,
86(4):765-771.
4. Bowman WC, Marshall IG, Gibb AJ, Harborne AJ: Feedback con-
trol of transmitter release at the neuromuscular junction.
Trends Pharmacol Sci 1988, 9(1):16-20.
5. Gibb AJ, Marshall IG: Nicotinic antagonists produce differing
amounts of tetanic fade in the isolated diaphragm of the rat.
Br J Pharmacol 1986, 89(3):619-624.
6. Hong SJ, Chang CC: Run-down of neuromuscular transmission
during repetitive nerve activity by nicotinic antagonists is
not due to desensitization of the postsynaptic receptor. Br J
Pharmacol 1991, 102(4):817-822.
7. Bowman WC: Prejunctional and postjunctional cholinocep-
tors at the neuromuscular junction. Anesth Analg 1980,
59(12):935-943.
8. Gibb AJ, Marshall IG: Pre-and post-junctional effects of
tubocurarine and other nicotinic antagonists during repeti-
tive stimulation in the rat. J Physiol 1984, 351:275-297.
9. Glavinovic MI: Presynaptic action of curare. J Physiol 1979,
290(2):499-506.
10. Magleby KL, Pallotta BS, Terrar DA: The effect of (+)-tubocurar-
ine on neuromuscular transmission during repetitive stimu-
lation in the rat, mouse, and frog. J Physiol 1981, 312:97-113.
11. Nigrovic V, Amann A: Competition between acetylcholine and
a nondepolarizing muscle relaxant for binding to the postsy-
naptic receptors at the motor end plate: simulation of twitch
strength and neuromuscular block. J Pharmacokinet Pharmacodyn
2003, 30(1):
23-51.
12. Gibson FM, Mirakhur RK, Clarke RS, Brady MM: Quantification of
train-of-four responses during recovery of block from non-
depolarising muscle relaxants. Acta Anaesthesiol Scand 1987,
31(7):655-657.
13. Graham GG, Morris R, Pybus DA, Torda TA, Woodey R: Relation-
ship of train-of-four ratio to twitch depression during pan-
curonium-induced neuromuscular blockade. Anesthesiology
1986, 65(6):579-583.
14. Pearce AC, Casson WR, Jones RM: Factors affecting train-of-four
fade. Br J Anaesth 1985, 57(6):602-606.
15. Power SJ, Jones RM: Relationship between single twitch depres-
sion and train-of-four fade: influence of relaxant dose during
onset and spontaneous offset of neuromuscular blockade.
Anesth Analg 1987, 66(7):633-636.
16. Power SJ, Pearce AC, Jones RM: Fade profiles during spontane-
ous offset of neuromuscular blockade: vecuronium and
gallamine compared. Br J Anaesth 1988, 60(5):486-490.
17. Bhatt SB, Amann A, Nigrovic V: Modeling of twitch fade based on
slow interaction of nondepolarizing muscle relaxants with
the presynaptic receptors. J Pharmacokinet Pharmacodyn 2006,
33(4):461-483.
18. Kamenskaya MA, Elmqvist D, Thesleff S: Guanidine and neu-
romuscular transmission. II. Effect on transmitter release in
response to repetitive nerve stimulation. Arch Neurol 1975,
32(8):510-518.
19. Chang CC, Lee CY: Isolation of Neurotoxins from the Venom
of Bungarus Multicinctus and Their Modes of Neuromuscu-
lar Blocking Action. Arch Int Pharmacodyn Ther 1963, 144:241-257.
20. Galindo A: Prejunctional effect of curare: its relative impor-
tance. J Neurophysiol 1971, 34(2):289-301.
21. Hubbard JI, Wilson DF: Neuromuscular transmission in a mam-
malian preparation in the absence of blocking drugs and the
effect of D-tubocurarine. J Physiol 1973, 228(2):307-325.
22. Wood SJ, Slater CR: Safety factor at the neuromuscular junc-
tion. Prog Neurobiol 2001, 64(4):393-429.