Báo cáo y học: "Numerical modelling of label-structured cell population growth using CFSE distribution data" docx
Bạn đang xem bản rút gọn của tài liệu. Xem và tải ngay bản đầy đủ của tài liệu tại đây (827.65 KB, 15 trang )
BioMed Central
Page 1 of 15
(page number not for citation purposes)
Theoretical Biology and Medical
Modelling
Open Access
Research
Numerical modelling of label-structured cell population growth
using CFSE distribution data
Tatyana Luzyanina
1
, Dirk Roose
2
, Tim Schenkel
3
, Martina Sester
4
,
Stephan Ehl
5
, Andreas Meyerhans
3
and Gennady Bocharov*
6
Address:
1
Institute of Mathematical Problems in Biology, RAS, Pushchino, Russia,
2
Department of Computer Science, Katholieke Universiteit
Leuven, Belgium,
3
Department of Virology, University of the Saarland, Homburg, Germany,
4
Department of Internal Medicine, University of the
Saarland, Homburg, Germany,
5
Children's Hospital, University of Freiburg, Freiburg, Germany and
6
Institute of Numerical Mathematics, RAS,
Moscow, Russia
Email: Tatyana Luzyanina - ; Dirk Roose - ; Tim Schenkel - ;
Martina Sester - ; Stephan Ehl - ;
Andreas Meyerhans - ; Gennady Bocharov* -
* Corresponding author
Abstract
Background: The flow cytometry analysis of CFSE-labelled cells is currently one of the most
informative experimental techniques for studying cell proliferation in immunology. The quantitative
interpretation and understanding of such heterogenous cell population data requires the
development of distributed parameter mathematical models and computational techniques for data
assimilation.
Methods and Results: The mathematical modelling of label-structured cell population dynamics
leads to a hyperbolic partial differential equation in one space variable. The model contains
fundamental parameters of cell turnover and label dilution that need to be estimated from the flow
cytometry data on the kinetics of the CFSE label distribution. To this end a maximum likelihood
approach is used. The Lax-Wendroff method is used to solve the corresponding initial-boundary
value problem for the model equation. By fitting two original experimental data sets with the model
we show its biological consistency and potential for quantitative characterization of the cell division
and death rates, treated as continuous functions of the CFSE expression level.
Conclusion: Once the initial distribution of the proliferating cell population with respect to the
CFSE intensity is given, the distributed parameter modelling allows one to work directly with the
histograms of the CFSE fluorescence without the need to specify the marker ranges. The label-
structured model and the elaborated computational approach establish a quantitative basis for
more informative interpretation of the flow cytometry CFSE systems.
Background
Understanding the dynamics of cell proliferation, differ-
entiation and death is one of the central problems in
immunology [1]. A cell population is an ensemble of indi-
vidual cells, all of which contribute in a different way to
the overall observed behavior [2]. A quantitative charac-
terization of this heterogeneity is provided by flow cytom-
etry. Flow cytometry is a technique based on the use of
Published: 24 July 2007
Theoretical Biology and Medical Modelling 2007, 4:26 doi:10.1186/1742-4682-4-26
Received: 10 April 2007
Accepted: 24 July 2007
This article is available from: />© 2007 Luzyanina et al; licensee BioMed Central Ltd.
This is an Open Access article distributed under the terms of the Creative Commons Attribution License ( />),
which permits unrestricted use, distribution, and reproduction in any medium, provided the original work is properly cited.
Theoretical Biology and Medical Modelling 2007, 4:26 />Page 2 of 15
(page number not for citation purposes)
fluorescence activated cell sorter (FACS) for a quantitative
single cell analysis of the suspensions of cells, which are
labelled with fluorescent substance(s). Once the labelled
cells are run through the cell sorter machine, the compu-
ter collects data on the fluorescence intensity for each cell
[3]. The FACS is capable of analyzing up to a dozen
parameters per cell at rates up to 10
5
cells per second.
Therefore it represents a versatile tool with an enormous
potential to describe the complex nature of cell popula-
tions [4].
Various labelling techniques are available for the analysis
of the lymphocyte proliferation in response to stimuli
indicing cell division. These include, for example, car-
boxy-fluorescein diacetate succinimidyl ester (CFSE)
labelling, the use of bromodeoxyuridine (BrdU) which
incorporates into the DNA of dividing cells,
3
H thymidine
incorporation analysis, the expression of the nuclear Ki –
67 antigen in the nuclei of cycling cells. The use of CFSE
to track cell division gives several advantages over the
other labelling assays [5,6]: the lack of radioactivity; no
antibody required to detect CFSE; when using CFSE assay
viable cells can be recovered for further phenotypic exam-
ination; it is possible to apply different initial staining for
different cell subsets so that complex mixtures of cells can
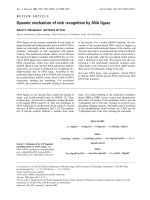
be analyzed. The major aspects of CFSE function can be
summarized as follows: (i) CFSE consists of a fluorescein
molecule containing a succinimidyl ester functional
group and two acetate moieties; (ii) it diffuses freely into
cells and intracellular esterases cleave the acetate groups
converting them to a fluorescent, membrane imperma-
nent dye; (iii) CFSE is retained by the cell in the cytoplasm
and does not adversely affect cellular function; (iv) during
each round of cell division, the fluorescent CFSE is parti-
tioned equally between daughter cells, see Fig. 1 (left).
The histograms of the CFSE intensity distribution for pro-
liferating cell populations can be obtained by FACS at var-
ious times, cf. Fig. 1 (right), providing the raw data for
further quantitative analysis of the kinetics of cell divi-
sion. This method permits the identification of up to 10
successive cell generations [6,7].
A thorough interpretation and comprehensive under-
standing of CFSE-labelled lymphocytes population data
requires both the development of quantitatively consist-
ent mathematical models, e.g. based on distributed
parameter systems such as hyperbolic partial differential
equations, and efficient computational techniques for the
solution and identification of these models. The heteroge-
neity of the dividing cell populations can be described by
a wide range of characteristics, e.g. the number of divi-
sions made, the position in the cell cycle, the mass, the
label expression, the doubling time, the death rate. The
mathematical modelling approaches for the analysis of
cell growth from CFSE assay data developed so far con-
sider the cell populations as a mixture of cells which differ
only in the mean level of the CFSE expression per genera-
tion [7-11]. The cells within each generation (compart-
ment) are assumed to possess the same constant level of
CFSE fluorescence which is reduced by a factor of 2 after
one division. Most of the models ignore the heterogeneity
of cell populations with respect to the division and death
rates, except for the naive versus dividing cells. The effect
of cell heterogeneity with respect to the division times in
the context of CFSE data analysis is explored in [8]. An
extended comparative analysis of the existing compart-
mental models for CFSE-labelled cell growth has recently
been presented in [12]. These models, formulated using
ordinary or delay differential equations, consider the
dynamics of the consecutive generations of dividing cells
but not the single cell identity. Hence they can be referred
to as unstructured and non-corpuscular, following the
definitions in [13].
Distributed population balance models, which use partial
differential equations (PDEs), are regarded as the most
general way of describing heterogenous cell systems. Such
models are considerably more difficult to analyze mathe-
matically and numerically than their unstructured coun-
terparts. The most extensively studied distributed
parameter models for population dynamics are the age-
structured models [14-16]. The only example of applica-
tion of the age-maturity structured model for the CFSE
data analysis is presented in [17]. The cell population is
considered to be continuously structured with respect to
the cell age, but the maturity variable (the CFSE fluores-
cence) is discrete, i.e., k distinct cell generations are con-
sidered, each characterized by some average CFSE
fluorescence per cell, M/2
k
, with M the initial fluores-
cence. The division and death rates are assumed to be
independent of the maturity and they are estimated by fit-
ting experimental data with the model visually. In general,
CFSE dilution (left) and typical CFSE intensity histograms (right)Figure 1
CFSE dilution (left) and typical CFSE intensity histograms
(right).
10
0
10
1
10
2
10
3
CFSE intensity
CFSE intensity
Division number
0
123
day 2
day 3
day 4
Theoretical Biology and Medical Modelling 2007, 4:26 />Page 3 of 15
(page number not for citation purposes)
for cell growth problems the age-structured population
models are considered to be of limited practical value due
to the fact that the cell age is difficult to measure experi-
mentally [13].
A class of distributed parameter models for cell popula-
tions growth, which allows direct reference to the experi-
mentally measurable properties of cells, is represented by
so-called size- or mass-structured cell populations models
[4,18-20]. The terms ”size” and ”mass” refer to any cell
property which satisfies a conservation law, e.g. volume,
protein content, fluorescence label, etc. A rigorous mathe-
matical analysis of such models was presented in [21]. The
mass-structured population balance models are consid-
ered to provide a consistent way to estimate the funda-
mental physiological functions from flow cytometry data
in the area of biotechnology [4,13].
In this study we formulate a one-dimensional first order
hyperbolic PDE model for the dynamics of cell popula-
tions structured according to the CFSE fluorescence level.
This structure variable defines the division age of the cell.
We let the fluorescence intensity of the initial cell popula-
tion and, therefore, of the consecutive generations to
range continuously in some interval, thus relaxing a
restricting assumption of an equal expression of CFSE by
cells which have undergone the same number of divi-
sions.
The proposed CFSE label-structured model potentially
has the following advantages with respect to existing com-
partmental models: (i) it allows one to estimate the turn-
over parameters directly from the distributions of CFSE-
labelled cells followed over time by flow cytometry; (ii) it
does not require an ad hoc assumption on the relation-
ship between the label expression level and the number of
divisions cells undergone. Notice that this is an important
aspect for a long-term follow up of the CFSE-labelled pop-
ulations as the correspondence between the CFSE inten-
sity range and the division generation can be heavily
biased by the overall loss of the label over time and by the
initial heterogeneity of the labelled cell population; (iii) it
allows to estimate the kinetic parameters of cell prolifera-
tion and death as functions of the marker expression level
(and hence of the number of cell divisions).
Modelling with hyperbolic PDEs, being used in the con-
text of data-driven parameter identification, presents a sig-
nificant computational challenge due to the hyperbolic
nature of the equations and due to the large size of the dis-
cretized problem. To our knowledge, no publicly availa-
ble software package exists which deals with optimization
of hyperbolic PDE models. We estimate the distributed
parameters of the proposed model following the maxi-
mum likelihood approach and using the direct search
Nelder-Mead simplex method applied to a finite dimen-
sional approximation of the original infinite dimensional
optimization problem. The initial-boundary value prob-
lem is solved with a Matlab program by Shampine [22],
which implements the well established second order
Richtmyer's two-step variant of the Lax-Wendroff method.
Because this program is fully vectorized, it allows very fast
execution, which is otherwise difficult to achieve in Mat-
lab. This is especially important when solving a PDE in an
optimization loop. Using two original CFSE data sets, we
demonstrate the biological consistency of the proposed
label-structured model and compare its predictions with
the predictions of the ODE (ordinary differential equa-
tion) compartmental model published recently [12].
The outline of this paper is as follows. In the next section
we formulate the label-structured cell populations model.
In section ”CFSE data” we describe two original sets of
data on in vitro growth of human CFSE-labelled T-lym-
phocytes and the preprocessing of the corresponding
CFSE histograms used in this study. The major aspects and
the numerical treatment of the distributed parameter
identification problem are presented in sections ”Parame-
ter estimation” and ”Numerical procedure”. Results of the
application of the proposed model to the analysis of the
turnover parameters of proliferating cells from the CFSE
intensity histograms for the two data sets are presented in
section ”Applications to CFSE assay”. Here we also com-
pare the performance of the proposed PDE model and the
compartmental ODE model. Finally, we discuss the major
advantages and the bottlenecks of the proposed approach.
Label-structured cell populations model
In this section we introduce the mathematical model for
the dynamics of lymphocyte populations in the CFSE pro-
liferation assay. We consider a population of cells which
are structured according to a single variable x that charac-
terizes the CFSE expression level in terms of units of inten-
sity, UI. Therefore the amount of CFSE label is treated as a
continuous variable. The state of the population at time t
is described by the distribution (density) function n(t,
x)(cell/UI), so that the number of cells with the CFSE
intensity between x
1
and x
2
is given by
At the beginning of the follow-up experiment, the lym-
phocyte population is stained with CFSE giving rise to the
initial (starting) distribution of cells with respect to the
CFSE fluorescence. The following phenomenological fea-
tures of the label-structured lymphocyte proliferation
have to be taken into account by the model for the
dynamics of the distribution of labelled cells ([5-7,23]):
nt xdx
x
x
(, )
1
2
∫
Theoretical Biology and Medical Modelling 2007, 4:26 />Page 4 of 15
(page number not for citation purposes)
• During cell division CFSE is partitioned equally between
daughter cells;
• The fluorescence intensity of labeled cells declines
slowly over time due to catabolism [5,6,24];
• Each CFSE division peak represents a cohort of cells that
entered their first division at approximately the same
time;
• As the cells proliferate, the initially bell-shaped distribu-
tion of the CFSE fluorescence in the population becomes
multimodal, moving over time to lower values of x. The
histograms of the CFSE intensity provide profiles for cell
divisions;
• As the dividing cell population approaches the autoflu-
orescence level of unlabelled cells, the division peaks start
to compress, thus limiting the number of divisions that
can be followed. Usually cells are stained to an intensity
of about 10
3
times brighter than their autofluorescence, so
that up to 10 divisions can be permitted while maintain-
ing both the parental and the final generation intensities
all on scale.
The label-structured cell population behavior can be
expressed using a modification of the model proposed
originally by Bell & Anderson for size-dependent cell pop-
ulation growth when reproduction occurs by fission into
two equal parts [19]. We assume that the physiological
parameters of cells (division and death rates) strongly cor-
relate with the label expression level.
Let the initial CFSE distribution of cells at time t
0
be given
by the density function
n(t
0
, x) =: n
0
(x), x ∈ [x
min
, x
max
]. (1)
This can be either the cell distribution at the start of the
experiment (t
0
= 0) or at some later time (t
0
> 0). The evo-
lution of the cell distribution n(t, x) is modelled by the
following cell population balance one-dimensional
hyperbolic PDE,
The first equation consists of the following terms:
v(x)∂n(t, x)/∂x, the advection term, describes the natural
decay of the CFSE fluorescence intensity of the labelled
cells with the rate v(x), UI/hour;
-(
α
(x) +
β
(x))n(t, x) describes the local disappearance of
cells with the CFSE intensity x due to the division associ-
ated CFSE dilution and the death with
α
(x) ≥ 0 and
β
(x) ≥
0 being the proliferation and death rates, respectively,
both having the same unit 1/hour;
2
γα
(
γ
x)n(t,
γ
x) represents the birth of two cells due to divi-
sion of the mother cell with the label intensity
γ
x. The first
factor accounts for the doubling of numbers, and the sec-
ond for the difference by a factor
γ
in the size of the CFSE
intervals to which daughter and mother cells belong.
Indeed, those cells which originate from division of cells
with CFSE in the range (
γ
x,
γ
(x + dx)) enter into the range
(x, x + dx).
Under the assumption of equal partition of the label
between the two daughter cells and no death during the
division one expects that
γ
= 2. This would ensure conser-
vation of CFSE label, similar to the conservation of vol-
ume-size [19,20]. However, we allow the label
partitioning parameter
γ
to take values smaller than 2 so
that x <
γ
x ≤ 2x, in order to check the consistency of the
assumptions with experimental data.
The above consideration applies to cells with levels of
CFSE below the maximal initial staining x
max
divided by
γ
.
The population dynamics of the cells with x
max
/
γ
<x ≤ x
max
is governed by the second equation of model (2) without
the source term. The division, death and transition rates,
α
(x),
β
(x) and v(x), of the structured population are
assumed to be functions of (i.e., correlate with) the CFSE
intensity. The precise dependence on x is not known a pri-
ori and will be estimated from the flow cytometry data.
The initial data for model (2) are given by (1) specifying
the distribution of cells at time t
0
. The lack of cells with
CFSE intensity above the given maximal value x
max
for all
t > t
0
is taken into account by the boundary condition
n(t, x
max
) = 0, t > t
0
.(3)
The basic model (2) is formulated using the linear scale
for the structure variable x. As the histograms obtained by
flow cytometry use the base 10 logarithm of the marker
expression level, we reformulate model (2) to deal directly
with the transformed structure variable z := log
10
x,
where
ν
(z) = v(10
z
)/log(10)10
z
. The structured popula-
tion balance model (4) is used for the description of the
evolution of CFSE histograms and to estimate the divi-
sion, death and transfer rates of labelled cell populations
from CFSE proliferation assays.
∂
∂
−
∂
∂
=− + +
n
t
tx vx
n
x
t x x x nt x xnt x(, ) ( ) (, ) ( () ( ))(, ) ( )(, ),
αβ γαγ γ
2 xxxx
n
t
tx vx
n
x
tx x x ntx
min max
/,
(, ) ( ) (, ) ( () ( ))(, ),
≤≤
∂
∂
−
∂
∂
=− +
γ
αβ
xxxx
max max
/.
γ
≤≤
(2)
∂
∂
−
∂
∂
=− + + +
n
t
tz z
n
z
tz z z ntz z n(, ) () (, ) ( () ( ))(, ) ( log )(
ναβγαγ
2
10
ttz z z z
n
t
tz z
n
x
tz
,log), log,
(, ) () (, )
min max
+≤≤−
∂
∂
−
∂
∂
=−
10 10
γγ
ν
(( ( ) ( )) ( , ), log ,
max max
αβ γ
zzntzz zz+−≤≤
10
(4)
Theoretical Biology and Medical Modelling 2007, 4:26 />Page 5 of 15
(page number not for citation purposes)
CFSE data
CFSE intensity histograms of proliferating cell population
To investigate the appropriateness of the label-structured
cell population model (4) and the developed parameter
estimation procedure, two original data sets characteriz-
ing the evolution of CFSE distribution of proliferating cell
cultures were used. The data sets were obtained from in
vitro proliferation assay with human peripheral blood
mononuclear cells (PBMC) as follows. The cells were
labelled with CFSE at day 0. To induce the proliferation of
T cells, two different activation stimuli were used:
• the mitogen stimulator phytohemagglutinin (PHA),
which activates the T lymphocytes unspecifically, i.e.,
independent of a signal transduced by the T cell receptor
(data set 1, considers the total CD4 and CD8 T cells);
• the antibodies against CD3 and CD28 receptors on T
cells which provide signals similar to those transduced by
the T cell receptor (data set 2, considers the CD4 T cells).
At regular times after the onset of cell proliferation the
cells were harvested, stained with antibodies to CD4 or
CD8 and analyzed by flow cytometry for CFSE expression
level on individual cells. The total cell number in the pro-
liferation culture was also quantified. The combination of
CFSE labelling and flow cytometry allows one to generate
the time series of histograms of CFSE distribution [5].
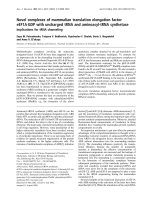
Figure 2 shows the CFSE histograms for data set 2: the dis-
tribution of proliferating CFSE-labelled T cells according
to the intensity of the CFSE label from the start of the
experiment until day 5. Provided that the initial cell label-
ling is fairly homogeneous, each CFSE peak represents a
cohort of cells that proceed synchronously through the
division rounds. As cells proliferate the whole cell popu-
lation moves, with respect to the CFSE fluorescence inten-
sity, from right to left, demonstrating sequential loss of
CFSE fluorescence with time. The observed fluctuating
behavior of the measurements results from a superposi-
tion of a whole range of random processes, including cell
counting, inherent heterogeneity of the cell shape in the
population, background noise in the functioning of the
physical elements constituting the FACS machine. To use
such histograms of CFSE distributions in the numerical
parameter estimation problem, a preprocessing of the
data is required, cf. the next section.
In a standard approach, the CFSE fluorescence histograms
are used to evaluate the fractions of T cells that have com-
pleted certain number of divisions [6,7]. This type of
'mean fluorescence intensity' data can be obtained either
manually or by using various deconvolution techniques
implemented in programs, such as ModFit (Verity Soft-
ware), CellQuest (Becton Dickinson), CFSE Modeler (Sci-
enceSpeak). The corresponding computer-based
procedures require setting of the spacing between genera-
tions, i.e., marking the CFSE fluorescence intensities that
separate consecutive generations of dividing cells. Note
that when the starting population of cells exhibits a broad
range of CFSE fluorescence, the division peaks can be not
easily identifiable, making conventional division tracking
analysis problematic [3,23,25]. The number of divisions
which can be followed is limited by the autofluorescence
of unlabelled cells. For the data we consider, the resolu-
tion of the division peaks is not possible after about 7
division cycles. We present and make use of the division
number lumped CFSE distribution data, i.e., 'mean fluo-
rescence intensity', in the last section for comparison of
the parameter estimation results for the PDE and ODE
based models of cell proliferation.
Preprocessing of CFSE intensity histograms for parameter
estimation
Each of the histograms of CFSE-labelled cell counts
obtained by flow cytometry at times t
i
, i = 0, 1, , M, can
be considered as an array consisting of vectors ,
which correspond to the base 10 logarithm of
the measured marker expression level, ,
and the numbers of counts associated
with . Here M
i
stands for the number of mesh points at
which the CFSE histogram at time t
i
is specified. To trans-
late the flow cytometry counts data to cell numbers which
are actually considered in model (4), we use the transfor-
mation
Z
i
i
M
i
∈ R
Z
ii iM
zz
i
: [ , , ]
,,
=
1
ii iM
cc
i
= [ , , ]
,,1
Z
i
n
cN
F
Fczdzi MjM
ij
ij i
i
ii
z
z
i,
,
, ( ) , , , , , , , ,
min
max
== = =
∫
01 1
(5)
The original CFSE histograms at days 0,1,2,4,5 (data set 2)Figure 2
The original CFSE histograms at days 0,1,2,4,5 (data set 2).
10
0
10
1
10
2
10
3
0
50
100
150
CFSE intensity
counts
day 0
day 1
day 2
day 4
day 5
Theoretical Biology and Medical Modelling 2007, 4:26 />Page 6 of 15
(page number not for citation purposes)
where N
i
is the total number of cells at time t
i
(available
from the experiment) and is a continuous approxima-
tion of the vector defined on the mesh . F
i
is the
total number of cell counts at time t
i
. Figure 3 shows an
example of such transformed histogram, describing the
labelled cell distribution that corresponds to the flow
cytometry data set 2 for day 5.
A direct use of such fluctuating histogram data for numer-
ical parameter estimation might lead to the following
major difficulties: (i) the possibility of overfitting, when
the measurement noise rather than the true dynamics is
approximated; (ii) the emergence of discontinuities in the
computed model solution due to a discontinuous initial
cell distribution function, as suggested by the flow cytom-
etry histogram. Overall, for the parameter estimation we
need to infer the underlying cell distribution densities n(t
i
,
z) from which the histograms of CFSE counts were sam-
pled. The functional approximation allows one to make
predictions about the CFSE-labelled cell density for the z
coordinate where cells have not been observed. Because
the density distribution is supposed to be a continuous
function, the corresponding estimation problem involves
some regularization procedure.
To find a continuous approximation for the histograms
and to smooth the data, we used an algorithm proposed
in [26], which is closely related to the Tikhonov regulari-
zation process [27]. In this approach a user-specified
parameter
τ
, called the smoothing factor, controls the
level of smoothing, such that the average squared devia-
tion of the approximating function from the correspond-
ing original position is limited to
τ
/k, with k being the
number of mesh points in the histogram. To ensure a uni-
form level of smoothing for the whole series of histograms
data available at times t
i
(which differ in the number of
data points M
i
and the cell numbers n
i, j
) we used the fol-
lowing smoothing parameter
τ
i
,
Here q defines the ”global” level of smoothing and m
i
stands for the number of measurements with n
i, j
> a
i
in the
histogram being smoothed. The performance of the con-
tinuous smoothing procedure is presented in Fig. 3 for
two choices of the parameter q. Note that a moderate level
of smoothing (q = 0.03) preserves important features of
the data (the division associated peaks), while q = 0.05
leads to oversmoothing (information loss) as manifested
by the disappearance of the division cohort structure pre-
sented in the histogram. In our study we used q = 0.03.
The histograms obtained by flow cytometry cover the
whole range of the CFSE fluorescence x from 1 to 10
4
. In
particular, the starting population of undivided cells can
spread up to the upper end of 10
4
units. We did not con-
sider the tiny fraction of cells which differ substantially in
their CFSE intensity from the bulk population of homoge-
neously stained cells. These CFSE bright cells might repre-
sent a measurement noise rather than genuine cells as
they remain in the same area of the histogram at later
observation times. Therefore, for parameter estimation we
assumed that there is some maximum CFSE intensity z
max
,
which depends on the initial staining of cells. This upper
level of fluorescence was prescribed specifically for data
sets 1 and 2.
Parameter estimation
The population balance model (4), describing the distri-
bution of cells n(t, z) structured according to the log
10
-
transformed CFSE intensity, depends on the unknown
rate functions of cell division
α
(z), death
β
(z) and the
label loss
ν
(z). The identification of these functions from
the observed CFSE histograms, using some measure of
closeness of the model solution to the observations, rep-
resents an inverse problem. This problem is characterized
by a finite set of observations n
i, j
and an infinite-dimen-
sional space of the functions to be estimated. Follow-
ing a general approach to the numerical solution of the
parameter estimation problem for distributed parameter
systems [28-33], we need to parameterize the elements of
the function space in order to represent them by a
finite set of parameters and to select the cost functional.
To avoid imposing a particular shape of the functions
α
(z)
and
β
(z), we approximate these functions using piecewise
monotone cubic interpolation through the points (z
k
, a
k
)
c
i
i
Z
i
τ
iiii
j
ij i
ma a q n i M== =
2
1, max( ), , , .
,
(6)
The performance of the smoothing procedure for CFSE intensity histogramsFigure 3
The performance of the smoothing procedure for
CFSE intensity histograms. The original CFSE histogram
(black curve) and two smoothed histograms (red curves)
obtained by the algorithm in [26] using the smoothing factor
(6) with q = 0.03 (left) and q = 0.05 (right).
1 2 3
0
1
2
3
x 10
5
z
number of cells
1 2
3
0
1
2
3
x 10
5
z
number of cells
Theoretical Biology and Medical Modelling 2007, 4:26 />Page 7 of 15
(page number not for citation purposes)
and (z
k
, b
k
), respectively, with some z
k
∈ [z
min
, z
max
], k = 1,
, L,
Here
φ
j
are cubic polynomials, such that
φ
j
(z
j
) = 1,
φ
j
(z
k
) =
0 for j ≠ k, and hence
α
L
(z
k
) = a
k
,
β
L
(z
k
) = b
k
, k = 1, , L.
Elements of the vectors and are the
unknowns to be estimated.
For the rate function
ν
(z), we consider two plausible vari-
ants:
In terms of the CFSE fluorescence level x, cf. model (2),
the first case assumes that the rate of label decay is directly
proportional to the amount of label expressed on the cell:
v(x) = cx log 10, while the second one implies that the
CFSE loss does not depend on its level on the cells: v(x) ≡
c, x ∈ [x
min
, x
max
].
Using the above parametrization, the original infinite
dimensional problem of identifying the rate functions
reduces to a finite dimensional one over a vector of
parameters,
p := [a, b, c,
γ
] ∈ ޒ
2L+2
.
The implementation details of the rate functions approxi-
mation are presented in the section ”Applications to CFSE
assay” below.
To estimate the vector of best-fit parameters p*, we follow
a maximum likelihood approach and seek for the param-
eter values which maximize the probability of observing
the experimental data n
i, j
provided that the true values are
specified by the model solution n(t, z; p*). The choice of
the probability function should take into account the sta-
tistical nature of the observation errors. Because the statis-
tical characterization of the CFSE fluorescence histograms
for growing populations of cells is a poorly analyzed issue,
we follow the principle stated in [34]: ” in the absence of
any other information the Central Limit Theorem tells us
that the most reasonable choice for the distribution of a
random variable is Gaussian.” Therefore, we assume that
(i) the observational errors, i.e., the residuals defined as a
difference between observed and model-predicted values,
are normally distributed; (ii) the errors in observations at
successive times are independent; (iii) the errors in cell
counts for consecutive label bins are independent ((ii) –
(iii) imply that the errors in the components of the state
vector are independent); (iv) the variance of observation
errors (
σ
2
) is the same for all the state variables, observa-
tion times and label expression level.
Under the above assumptions the maximization of the
log-likelihood function reduces
ln( (p;
σ
)) = -0.5(n
d
ln(2
π
) + n
d
ln(
σ
2
) +
σ
-2
Φ(p))
(9)
to the minimization of the ordinary least-squares func-
tion, see for details [35],
provided that
σ
2
is assigned the value = Φ(p*)/n
d
,
where p* is the vector which gives a minimum to Φ(p)
and is the total number of scalar measure-
ments. Relevant details of the computational treatment of
the parameter estimation problem for the PDE model (4)
are presented in the next section.
Numerical procedure
The parameter estimation problem for hyperbolic PDEs is
non-trivial due to the hyperbolic nature of the equations
(possible discontinuity of solutions) and due to the large
size of the discretized problem. Moreover, model (4) is
not a standard differential equation due to the solution
term n(t, z + log
10
γ
) with the transformed argument z +
log
10
γ
To our knowledge, no publicly available software
package exists which deals with optimization (parameter
estimation in particular) of models described by hyper-
bolic PDEs. For parabolic PDEs, which, after a suitable
space discretization, can be treated as large systems of
ODEs, available optimization tools (software, numerical
methods) for large-scale problems can be used.
Solutions of a hyperbolic PDE can be discontinuous at the
characteristic curve. Due to the solution term n(t, z + log
10
γ
) in model (4), the discontinuity of solutions at a point
(t, z
0
) on the characteristic curve propagates to the points
(t, z
j
), z
j
= z
0
- j log
10
γ
, j = 1, 2, A discretization of the
initial-boundary value problem (4) should take into
account the hyperbolicity of the equations and it should
be robust and efficient since it is used in an optimization
loop during model parameter identification. Moreover,
available optimization tools for large-scale problems are
based on some variants of Newton's method, which
αφβφ
Ljj
j
L
Ljj
j
L
zaz zbzzzz() (), () (), [ , ],
min max
==∈
==
∑∑
11
(7)
a = {}a
k
L
1
b = {}b
k
L
1
νν
() ()
log( )
,,[,].
min max
zc z
c
czzz
z
≡= ∈∈
+
and
10 10
R
(8)
Φ() ( ( , )),
,,
pp=−
==
∑∑
nntz
ij i ij
j
M
i
M
i
;
2
10
(10)
σ
∗
2
nM
di
i
M
:=
=
∑
1
Theoretical Biology and Medical Modelling 2007, 4:26 />Page 8 of 15
(page number not for citation purposes)
involves the computation of derivatives of the objective
function with respect to the parameters to be estimated.
These derivatives may not exist for discontinuous solu-
tions. Note also that the optimization technique based on
variants of Newton's method is efficient only if a good ini-
tial guess for the estimated parameters is available. For our
problem, a derivative free minimization method which is
robust with respect to the initial guess is preferable. Below
we outline the numerical methods used and computa-
tional details of the problem under study.
The initial-boundary value problem
To solve the initial-boundary value problem (IBVP) for
model (4), we use the Matlab program hpde by L. Shamp-
ine developed for systems of first order hyperbolic PDEs
in one space variable [22]. This program implements the
well established second order Richtmyer's two-step vari-
ant of the Lax-Wendroff method (LxW) [36]. This method
is dispersive and therefore the software contains the pos-
sibility to apply after each time step a nonlinear filter [37]
to reduce the total variation of the numerical solution.
When the solution is smooth, filtering has little effect, but
the filter is helpful in dealing with the oscillations which
are characteristic of the LxW scheme when the solution is
discontinuous or has large gradients. The choice of this
method was also influenced by its ability to be fully vec-
torized, which allows to speed up computations in Matlab
significantly. This is especially important when solving a
PDE in an optimization loop. To compute the solution
term with the transformed argument z + log
10
γ
, we mod-
ified the code hpde so that this term is interpolated,
through its closest neighbors, preserving the second order
accuracy of the LxW scheme.
To compute solutions of (4), we used a mesh Z := [z
0
, z
1
,
, z
N
] with equally spaced mesh points, ∆
z
:= z
j
- z
j - 1
, j =
1, , N. The initial data n
0
(z
j
) on the mesh Z are computed
by interpolation of the given distribution of cells on the
mesh at time t = t
0
, using the Matlab code interp1 with
a shape-preserving piecewise cubic interpolation. The
Courant-Friedrichs-Lewy (CFL) condition
is a sufficient stability condition for the LxW scheme. To
determine the time step in the PDE discretization, we use
the CFL condition with safety factor 0.9,
The time step is recomputed at each iteration of the opti-
mization procedure since it depends on the estimated
function
ν
(z).
It is well known that solutions of a hyperbolic PDE are
discontinuous if the compatibility condition for the initial
and boundary conditions is not fulfilled. In our case the
compatibility condition reads as
n(0, z
max
) = n
0
(z
max
) = 0. (13)
If n
0
(z) is the distribution of cells at the start of the exper-
iment, i.e., t
0
= 0, this condition is not fulfilled. In this
case, the solution n(t, z) is discontinuous along the char-
acteristic z(t) = g(t,
ν
(z)), defined by the ODE
If
ν
(z) is constant, this characteristic is z = z
max
-
ν
t. Due to
the solution term n(t, z + log
10
γ
) in model (4), the discon-
tinuity of the solution n(t, z) at (t) = g(t,
ν
( )) prop-
Z
0
∆
∆
t
z
zZ
zmax ( )
∈
<
ν
1
(11)
∆∆
tz
zZ
z=
∈
09./max().
ν
(12)
dz
dt
zz z==
ν
(), () .
max
0
(14)
z
0
∗
z
0
∗
Propagation of the discontinuities of the solution to model (4) and the effect of the mesh refinement and the filtering procedureFigure 4
Propagation of the discontinuities of the solution to
model (4) and the effect of the mesh refinement and
the filtering procedure. Left: Solution n(t, z) of model (4)
for t = 120 (hours) with the best-fit parameters estimated for
data set 2. Dashed lines indicate positions of the discontinui-
ties of the exact solution: = - j log
10
γ
, j = 0, 1, , 10,
≈ 2.58,
γ
≈ 1.71. Right (top): The effect of the mesh
refinement on the computed solution in a neighborhood of
the discontinuity at z ≈ 2.347. Dashed, solid and dot-dashed
curves indicate the solution computed using the mesh size N
= 500, 1000, 2000, respectively. Right (bottom): The effect of
the filtering procedure: the solution computed with and
without the filtering (dashed, respectively solid curves). N =
1000.
0 1 2 3
0
1
2
3
x 10
5
z
n(t,z)
2.32 2.36 2.4
2.1
2.6
x 10
4
2.34 2.35 2.36 2.37 2.38
2.2
2.6
x 10
4
z
z
j
∗
z
0
∗
z
0
∗
Theoretical Biology and Medical Modelling 2007, 4:26 />Page 9 of 15
(page number not for citation purposes)
agates to the points (t, ), with = - j log
10
γ
, j = 1,
2, , ∀t. This is illustrated in Fig. 4 (left).
Our experience with the solution of the IBVP for model
(4), using the code hpde, has shown that oscillations in
the computed solution, occurring due to the discontinuity
of the exact solution, do not propagate significantly with
respect to z. Hence, the accuracy of the computed solution
is only influenced locally, see Fig. 4. With the mesh refine-
ment, the amplitude of the oscillations grows, while the
interval of the propagation of the oscillations decreases,
cf. Fig. 4 (right, top). The filtering procedure of the hpde
smoothes the oscillations, see Fig. 4 (right, bottom).
If the exact solution of model (4) is smooth, the order of
accuracy of the computed solution on the interval [z
min
,
z
max
] is uniform and corresponds to the order of the LxW
scheme. This is the case for data set 1, for which the initial
function is compatible with the boundary condition,
n
0
(z
max
) = 0 for t
0
= 72 hours. For N = 1000 the accuracy
of the best-fit solution is about 10
-3
- 10
-2
and slowly
decreases with time. For data set 2 the compatibility con-
dition (13) is not fulfilled as n
0
(z
max
) ≠ 0 for t
0
= 0. In this
case the solution is discontinuous at points = - j
log
10
γ
, j = 0, 1, , 10, see Fig. 4, and the above level of
accuracy can only be achieved outside some small inter-
vals around the discontinuity points.
Since model (4) is linear with respect to n(t, z), we scaled
it by the factor 10
-5
to avoid the possible accuracy loss
when dealing simultaneously with very large and small
numbers in computations. To speed up the computations,
the parameter estimation problem was treated in two
stages. First we used a coarser mesh Z with N = 500 to
solve the IBVP. Then the obtained best-fit parameter val-
ues were taken as a starting point to minimize the objec-
tive function using a finer mesh with N = 1000 to solve the
IBVP.
Parameterization of the estimated functions
According to the proposed parameterization (7) of the
functions
α
(z) and
β
(z), the parameters to be estimated
are elements of the vectors and . Each
pair (a
k
, b
k
) approximate the corresponding rate function
at some value z
k
∈ [z
min
, z
max
] so that
α
L
(z
k
) = a
k
and
β
L
(z
k
)
= b
k
, k = 1, , L. Values z
k
should be chosen such that all
the consecutive divisions of cells could be captured prop-
erly. Hence the minimal value of L has to be larger than
the maximal number of divisions cells have undergone.
On the other hand, L should not be very large to treat the
minimization problem efficiently. Values of
α
L
(z) and
β
L
(z) for z ≠ z
k
were evaluated with the code interp1 by
ashape-preserving piecewise cubic interpolation. In the
following we omit the subscript L for simplicity.
For the initial parameterization we used L = 8. After the
best-fit solution was found, the parameterization of
α
(z)
and
β
(z) was updated as follows. For
α
(z), we added new
points, thus introducing additional parameters to be esti-
mated. The increase of L was restricted by the requirement
that adding new parameters should allow one a better fit
of the data, i.e., lead to a significant improvement in the
computed minimum of the objective function. For data
set 1, all estimated b
k
were close to some constant value.
Therefore, we assumed that
β
(z) can be treated as a con-
stant function. This simplifying assumption leads to a
minor change in the values of the objective function
(1%). For data set 2, all b
k
corresponding to z
k
< 2.5 were
zeros and we fixed them to be zero.
Minimization procedure
To solve the minimization problem, we use the Matlab
code fminsearch implementing the Nelder-Mead simplex
method. This method is a classical direct search algorithm
that is widely used in case when the gradient of the objec-
tive function with respect to the estimated parameters can-
not be evaluated. In our case the gradient, if it exists (i.e.,
if the solution of model (4) is continuous), can be com-
puted numerically, but the computational cost is too large
for the parameter estimation problem. As this method can
trap in local minima for nonconvex objective functions, a
number of runs with different initial guesses are necessary.
Applications to CFSE assay
In this section we investigate the appropriateness of the
proposed label-structured PDE model (4), using the two
original data sets introduced in section ”CFSE data”. The
performance of this model with respect to the data sets is
further compared with that of the compartmental ODE
model developed recently in [12].
Mitogen-induced T cell proliferation
Figure 5 shows the experimental data set 1 and the solu-
tion of model (4) corresponding to the best-fit parameter
estimates. The best-fit value of the objective function at
the computed minimum is Φ ≈ 5.78 × 10
11
. The initial
CFSE distribution is available at 72 hours after the begin-
ning of the mitogen-induced T lymphocyte stimulation.
One can see that both the CFSE label distributions, avail-
able at 96, 120, 144 and 168 hours, and the overall pat-
tern of cell population surface are consistently reproduced
by the model.
The best-fit estimates for the rate functions
α
(z) and
β
(z)
are presented in Fig. 6 (left). The birth rate function
α
(z)
appears to be bell-shaped. This is in agreement with our
z
j
∗
z
j
∗
z
0
∗
z
j
∗
z
0
∗
a = {}a
k
L
1
b = {}b
k
L
1
Theoretical Biology and Medical Modelling 2007, 4:26 />Page 10 of 15
(page number not for citation purposes)
earlier results in [12], which showed a bell-shaped
dependence of the birth rate of T lymphocytes on the
number of divisions cells undergone. Following the pro-
posed parameterization of the rate functions, the esti-
mates of b
k
, k = 1, , L, appeared to be close to each other
and Φ did not change much when they all were taken
equal to the corresponding average value, overall suggest-
ing that
β
(z) is a constant function of z. For the label decay
rate
ν
(z), the second variant of parameterization in (8)
with the best-fit estimate of the advection rate c ≈ 0.11
provides a better approximation of the data by the model.
Indeed, the respective values of the least squares function
are 7.34·10
11
and 5.78·10
11
. The Akaike Information Cri-
terion is also smaller for the second form of the advection
rate (8678 versus 8603). This comparison implies that the
label decay rate
ν
(x) as a function of the CFSE intensity per
cell, cf. model (2), is predicted to be independent of x. The
best fit estimate for the dilution parameter
γ
is
γ
≈ 1.93. In
addition, the total population data observed experimen-
tally and predicted by the model (the integral of the distri-
bution density n(t, z) over the observed label intensity
range) are shown in Fig. 6 (right). We observe that the
label-structured model accurately reproduces the kinetics
of mitogen-induced proliferation of T lymphocytes.
CD3/CD28 antibody induced T cell proliferation
Figure 7 shows the experimental data set 2 on the stimu-
lation of labelled T lymphocytes with antibodies against
CD3 and CD28 cell surface receptors and the solution of
model (4) corresponding to the best-fit parameter esti-
mates. The best-fit value of the objective function at the
computed minimum is Φ ≈ 1.14 × 10
12
. The initial CFSE
distribution used corresponds to the beginning of the
experiment. Overall, the kinetics of cell distribution are
consistently reproduced by the model. The predicted shift
in the cell distribution towards z-levels below 2 at 48
hours after the start of the experiment can be explained by
the cell loss due to the culture handling, as described in
the next paragraph.
The best-fit estimates for the division and death rate func-
tions
α
(z) and
β
(z) are presented in Fig. 8 (left). The func-
tion
α
(z) is bell-shaped but less monotone than in the
case of data set 1. A sharp peak of the best-fit death rate
β
(z) around z ≈ 2.6 (or CFSE ≈ 400) implies a large loss of
cells during the first days of proliferation assay. Indeed, to
perform the flow cytometry, the stimulating beads cov-
ered with antibodies need to be removed from the cell cul-
ture. During this separation stage, some of the cells which
stay attached to the beads get also removed. This cell han-
dling results in the predicted peak of the cell death rate
and the spurious left tail of the cell distribution at 48
hours. Once the T cells are activated they detach from the
beads to perform a series of programmed proliferation
rounds and, therefore, one might expect that the effect of
For data set 1: the estimated rate functions and parameters of PDE model (4) and ODE model (15) and the kinetics of the total number of live lymphocytes predicted by both mod-elsFigure 6
For data set 1: the estimated rate functions and
parameters of PDE model (4) and ODE model (15)
and the kinetics of the total number of live lym-
phocytes predicted by both models. Left: Dependence
of the estimated turnover functions
α
(z) and
β
(z
)
on the
log
10
-transformed marker intensity. The best-fit estimates a
k
,
k = 1, , 21, are indicated by circles. Stars specify the best-fit
estimates for the birth and death parameters
α
j
,
β
j
, j = 0, ,
5, of the ODE model (15). They are placed in the middle of
the CFSE intervals which correspond to subsequent division
numbers starting from 0. Right: The kinetics of the total
number of live lymphocytes for data set 1 (circle) predicted
by the PDE and ODE models (solid and dashed curves,
respectively).
0 1 2 3
0
0
.02
0
.04
0
.06
z
0 1 2 3
0
0
.01
0
.02
0
.03
z
80 120 160
1
2
3
4
5
6
x 10
5
t (hours)
number of cells
α(z)
α
j
β(z)
β
j
The experimental data set 1 and the model solution corre-sponding to the best-fit parameter estimatesFigure 5
The experimental data set 1 and the model solution
corresponding to the best-fit parameter estimates.
Two first rows: Experimental data (black curves) and the
best-fit solution of model (4) (red curves). The initial function
is shown by a blue dashed curve. The last row presents the
cell population surface: experimental data (left) and the
model solution (right) as functions of time and the log
10
-
transform of the marker expression level.
0 1 2 3
0
1
2
3
4
5
x 10
5
t=96 (hours)
number of cells
0 1 2 3
0
2
4
6
x 10
5
t=120 (hours)
0 1 2 3
0
2
4
6
8
x 10
5
z
number of cells
t=144 (hours)
0 1 2 3
0
2
4
6
8
x 10
5
z
t=168 (hours)
0
1
2
3
100
150
0
5
x 10
5
z
t (hours)
n
i,j
0
1
2
3
100
150
0
5
x 10
5
z
t (hours)
n(t,z)
Theoretical Biology and Medical Modelling 2007, 4:26 />Page 11 of 15
(page number not for citation purposes)
bead removal on the cell counts will reduce with time. For
this data set, a constant advection rate
ν
(z) ≡ c with the
best-fit estimate c ≈ 3.5 × 10
-3
was enough to ensure a
good approximation of the data by the model. This
implies that the label loss rate v(x) in the original CFSE
model (2) decreases with x as v(x) = cx log 10. The best fit
estimate for label dilution parameter was again smaller
than 2:
γ
≈ 1.71. Figure 8 (right) demonstrates that the
model solution is consistent with the data on the growth
of the total T cell population stimulated with antibodies
to CD3/CD28.
Comparison to compartmental ODE model
The label-structured PDE model allows to describe quan-
titatively the evolution of the heterogeneity of the prolif-
erating T lymphocyte population with respect to the CFSE
fluorescence intensity. It is instructive to compare the per-
formance of this model with a mathematically simpler
compartmental ODE model [12] for the proliferation of T
cells heterogenous with respect to the division number.
To this end, we evaluate how consistent this ODE model
is with the data sets 1 and 2 reduced to the mean fluores-
cence intensities per generation. Using a uniform spacing
between the consecutive cell generations, the CFSE histo-
gram data suggest the division number cell distributions
summarized in Table 1.
The compartmental model considers the proliferation
dynamics of cell populations. It assumes that the per cap-
ita proliferation and death rates of T lymphocytes,
α
j
and
β
j
, depend on the number of divisions the lymphocytes
performed. The rate of change of the population of live
lymphocytes having undergone j divisions (which define
the j-th compartment), N
j
(t), is modelled by the following
system of ODEs,
The term 2
α
j - 1
N
j - 1
(t) for j ≥ 1 represents the cell birth
(influx from the previous compartment because of divi-
sion), whereas the term (
α
j
+
β
j
)N
j
(t) represents cell loss
(outflux from the compartment) due to division and
death. The model (15) allows an analytical solution
which was used in the parameter estimation procedure.
To estimate the best-fit parameters of this model, we used
the objective function
dN
dt
tNt
dN
dt
tNt Nt
j
jj jjj
0
000
11
2
() ( ) (),
() () ( ) (),
=− +
=−+
−−
αβ
ααβ
jjJ= 1, , .
(15)
For data set 2: the estimated rate functions and parameters of PDE model (4) and ODE model (15) and the kinetics of the total number of live lymphocytes predicted by both mod-elsFigure 8
For data set 2: the estimated rate functions and
parameters of PDE model (4) and ODE model (15)
and the kinetics of the total number of live lym-
phocytes predicted by both models. Left: Dependence
of the estimated cell turnover functions
α
(z) and
β
(z) on the
log
10
-transformed marker intensity. The best-fit estimates a
k
,
b
k
, k = 1, , 22, are indicated by circles. Stars specify the
best-fit estimates for the birth and death parameters
α
j
,
β
j
, j
= 0, , 5, of the ODE model (15). They are placed in the mid-
dle of the CFSE intervals which correspond to subsequent
division numbers starting from 0. Right: The kinetics of the
total number of live lymphocytes for data set 2 (circle) pre-
dicted by the PDE and ODE models (solid and dashed curves,
respectively).
0 1 2 3
0
0
.02
0
.04
z
0 1 2 3
0
0
.02
0
.04
z
0 50 100
0
4
8
12
16
x 10
4
t (hours)
number of cells
α(z)
α
j
β(z)
β
j
The experimental data set 2 and the model solution corre-sponding to the best-fit parameter estimatesFigure 7
The experimental data set 2 and the model solution
corresponding to the best-fit parameter estimates.
Two first rows: Experimental data (black curves) and the
best-fit solution of model (4) (red curves). The initial function
is shown by a blue dashed curve. The last row presents the
cell population surface: experimental data (left) and the
model solution (right) as functions of time and the log
10
-
transform of the marker expression level.
0 1 2 3
0
5
10
15
x 10
4
t=24 hours
number of cells
0 1 2 3
0
4
8
x 10
4
t=48 hours
0 1 2 3
0
1
2
x 10
5
t=96 hours
z
number of cells
0 1 2 3
0
2
x 10
5
t=120 hours
z
0
1
2
3
0
50
100
0
1
2
x 10
5
z
t (hours)
n(t,z)
0
1
2
3
0
50
100
0
1
2
x 10
5
z
t (hours)
n
i,j
Theoretical Biology and Medical Modelling 2007, 4:26 />Page 12 of 15
(page number not for citation purposes)
which corresponds, under a set of assumptions similar to
those presented above for the PDE model, to the maxi-
mum likelihood approach, see [12] for details. Here
and N
j
(t
i
; p) specify the data and the model solution for
the cell generation j at time t
i
, p is the vector of estimated
parameters
α
j
and
β
j
.
The best-fit parameter values
α
j
and
β
j
for data sets 1 and
2 are presented in Figs. 6 and 8. Note that these values are
plotted at the middle of the intervals of the log10-trans-
formed CFSE intensity which correspond to cells divided
j times. Quantitatively, the rate functions
α
(z),
β
(z) and
parameters
α
j
,
β
j
provide a different characterization of the
cell kinetics. The qualitative bell-shaped behavior of the
division rate with respect to the structure variable is simi-
lar for the PDE and ODE models (CFSE level and division
number, respectively).
The ODE model provides a poorer fit of the total T cell
population growth for data set 2, see Fig. 8 (right). In
addition, this model fails to describe consistently the divi-
sion number related structure of the cell populations
which divided less than 3 times (except undivided cells for
data set 2), as shown in Figs. 9 and 10. The above compar-
ison suggests that the PDE model allows to describe in a
more consistent way the dynamics of heterogenous CFSE-
labelled cell populations and, therefore, reliably estimate
the rates of the underlying turnover processes.
Conclusion
Many immunological phenomena result from cell prolif-
eration. To quantify the cell proliferation, the technology
based upon flow cytometry in conjunction with fluores-
cent dye (such as CFSE) that stain cell membrane or cyto-
plasm is extensively used in experimental and clinical
Φ() ( ( ; )),p =−
==
∑∑
NNt
j
i
ji
j
J
i
p
2
01
4
(16)
N
j
i
Experimental data set 1 and the best-fit solution of the com-partmental ODE modelFigure 9
Experimental data set 1 and the best-fit solution of
the compartmental ODE model. Experimental data are
denoted by circles, the best-fit solution is denoted by solid
lines. N
j
is the number of cells divided j times.
80 120 160
1
1
.5
2
2
.5
3
x 10
4
N
0
80 120 160
1.2
1.6
2
2.4
x 10
4
N
1
80 120 160
2
3
4
x 10
4
N
2
80 120 160
4
5
6
x 10
4
N
3
80 120 160
5
10
15
x 10
4
t (hours)
N
4
80 120 160
0.5
1
1.5
2
2.5
x 10
5
t (hours)
N
5
80 120 160
2
4
6
8
10
x 10
4
t (hours)
N
6
80 120 160
1000
2000
3000
t (hours)
N
7
Table 1: The total number of live lymphocytes, N
i
, and the distribution of lymphocytes with respect to the number of divisions they
have undergone, , at the indicated times t
i
Time days t
i
Total
number of
live cells N
i
Numbers of cells w.r.t. the number of divisions (j) they undergone
01234567
data set 1
31.4 × 10
5
29358 22876 43372 39970 5208 98 14
42.5 × 10
5
16050 12600 22650 57025 96350 46950 2500 25
54.4 × 10
5
14476 14784 25344 58652 141460 156290 32076 440
65.0 × 10
5
13500 12150 24150 55000 137850 188950 69450 2150
75.7 × 10
5
13509 12198 21603 51927 140560 232160 96102 3420
data set 2
0 30000 30000
1 20805 20623 182
2 23725 13378 10042 305
4 109218 4140 5504 16000 39276 36445 7845 8
5 168156 3301 4012 9354 31713 60753 53486 5537
N
j
i
N
j
i
Theoretical Biology and Medical Modelling 2007, 4:26 />Page 13 of 15
(page number not for citation purposes)
research. It provides large amounts of data on the evolu-
tion of the histograms of fluorescence intensity of the cell
population growing in response to a perturbing agent. The
challenge is not only to collect the data, but also to ana-
lyze them in a way that enhances our understanding of the
kinetics of the cellular responses. To this end, mathemati-
cal models are needed that quantitatively describe and
interpret the data, in particular allowing one to estimate
the rates of cell division and death.
Recently a number of different mathematical approaches
have been proposed for the analysis of CFSE data [7-
10,12,17,25]. The corresponding models were instructive
in appreciating the complexity of the parameter estima-
tion problem from CFSE distribution data. These models
take into account the heterogeneity of the growing cell
populations with respect to the division number and are
based upon systems of ordinary, delay or (age-structured)
partial differential equations. None of these models con-
sidered the label intensity as a structure variable thus the
CFSE histograms must be transformed into simplified
descriptions of the generation structure of the population.
This can be a vaguely defined procedure if the initial stain-
ing is not homogeneous. Such models, although easier to
solve, cannot describe cell growth accurately enough due
to the lack of structure information included.
In this study we developed a computational approach
which allows a direct reference to the CFSE distributions.
The label-structured cell population dynamics is
described by a first order hyperbolic PDE model similar to
those proposed by Bell and Anderson [19] for heteroge-
nous cell populations structured by volume or size. The
proposed model characterizes cell populations using the
rate functions of cell division, death, label decay and the
label dilution factor. We showed that this model provides
a consistent mathematical tool for the analysis of CFSE-
structured lymphocyte populations.
We presented a numerical approach for the parameter
estimation implemented in the widely used package Mat-
lab [38]. The major elements of this approach are: (i) the
smoothing of the histograms of CFSE data, which gener-
ates a continuous functional approximation of the distri-
bution density of the cell population with a reduced level
of noise; (ii) the software for the solution of the initial-
boundary value problem for the proposed PDE model
using the second-order Lax-Wendroff scheme; (iii) the
parameterization of the rate functions in order to reduce
the variational problem of CFSE data assimilation to a
finite-dimensional parameter optimization task; (iv) the
maximum likelihood approach to the parameter estima-
tion.
Two original data sets from in vitro CFSE proliferation
assays with human T lymphocytes were used to evaluate
the performance of the proposed approach. It was shown
that the model quantitatively describes the kinetics of the
cell populations both at the global level and with respect
to the fine structure of the CFSE distribution. The esti-
mated rate functions provide a deeper insight into the
turnover kinetics of the growing T cell populations. By
computing the mean values of the rate functions for con-
secutive CFSE ranges corresponding to the sequential gen-
erations, one can characterize the division number
dependent T cell turnover rates. In particular, the esti-
mated rate functions
α
(z) imply the following division
number dependent proliferation rates = [0.0023,
0.014, 0.020, 0.023, 0.010, 0.0032, 0.00002, 0] for data
set 1 and = [0.0033, 0.0088, 0.033, 0.016, 0.0082,
0.0011] for data set 2, where j stands for the division
number. The best-fit estimate of the reduction factor for
CFSE per cell after division is smaller than two, ranging
from 1.9 (data set 1) to 1.7 (data set 2). A possible inter-
pretation might be that the CFSE molecules bonded to
proteins upon release from cells dying in the process of
division can be taken up actively or adhere to the live cells.
Interestingly, the a quantitative CFSE data analyses pub-
lished recently also indicates that the factor difference in
median fluorescence intensity of adjacent CFSE peaks is
typically not exactly 2 [39] and there might be a few per-
cent difference among siblings in the CFSE fluorescence
inherited from the mother cell [24].
[]
α
jj=0
7
[]
α
jj=0
5
Experimental data set 2 and the best-fit solution of the com-partmental ODE modelFigure 10
Experimental data set 2 and the best-fit solution of
the compartmental ODE model. Experimental data are
denoted by circles, the best-fit solution is denoted by solid
lines. N
j
is the number of cells divided j times.
0 50 100
1
2
3
x 10
4
N
0
0 50 100
2000
6000
10000
N
1
0 50 100
0
5000
10000
15000
N
2
0 50 100
0
1
2
3
4
x 10
4
N
3
0 50 100
0
2
4
6
x 10
4
N
4
t (hours)
0 50 100
0
2
4
x 10
4
N
5
t (hours)
0 50 100
0
2000
4000
6000
N
6
t (hours)
Theoretical Biology and Medical Modelling 2007, 4:26 />Page 14 of 15
(page number not for citation purposes)
A number of issues require further systematic analysis: (i)
the statistical error model underlying the fluctuations in
the CFSE histograms; (ii) the level of noise smoothing
used in the generation of the continuous distributions
from the histogram data; (iii) the convergence of the
finite-dimensional approximation of the rate functions
estimation problem; (iv) the analysis of the confidence
bounds for the estimated rate functions; (v) the applica-
tion of Tikhonov regularization for the function identifi-
cation (inverse) problem.
Overall, our study suggests that the label-structured mod-
elling of cell population balance could become a compo-
nent of the CFSE flow cytometry analysis software. The
model's modifications can be used as building blocks for
integrative mathematical description of complex in vivo
labelling experiments in infected subjects such as those
presented recently in [40,41] for investigation of T cell
activation and homeostasis.
Competing interests
The author(s) declare that they have no competing inter-
ests.
Authors' contributions
TL performed the numerical identification work and
drafted together with DR and GB the manuscript. DR
supervised the computations with PDEs. TS and MS con-
ducted the CFSE proliferation experiments on CD3/CD28
antibody stimulation. SE designed experimental study
that provided the data set on PHA stimulation. AM per-
formed the experimental design for data set on CD3/
CD28 antibody stimulation. GB conceived the study and
participated in its design and co-oordination. All authors
have read and approved the final manuscript.
Acknowledgements
The authors would like to acknowledge with thanks financial support of this
work provided by the Russian Foundation of Basic Research (RFBR) and the
Ministry of Flanders (MF) Programme ”Bilateral scientific cooperation”
(RFBR-MF-05-01-02853-MF-a), the RFBR Grant RFBR-05-01-00732 and the
U.S. Civilian Research and Development Foundation (Award RUX1-2710-
MO-06).
References
1. Doherty PC, Christensen JP: Accessing complexity: The dynamics
of virus-specific T cell responses. Annu Rev Immunol 2000,
18:561-592.
2. Abu-Absi NR, Zamamiri A, Kacmar J, Balogh SJ, Srienc F: Automated
flow cytometry for acquisition of time-dependent population
data. Cytom Part A 2003, 51:87-96.
3. Liu D, Yu J, Chen H, Reichman R, Wu H, Jin X: Statistical determi-
nation of threshold for cellular division in the CFSE-labeling
assay. J Immunol Methods 2006, 312:126-136.
4. Srienc F: Cytometric data as the basis for rigorous models of
cell population dynamics. J Biotechnol 1999, 71:233-238.
5. Lyons AB, Doherty KV: Flow cytometric analysis of cell division
by dye dilution. Current Protocols in Cytometry 2004:9.11.1-9.11.10.
6. Lyons AB: Divided we stand: tracking cell proliferation with car-
boxyfluorescein diacetate ester. Immunol Cell Biol 1999,
77:509-515.
7. Gett AV, Hodgkin PD: A cellular calculus for signal integration by
T cells. Nat Immunol 2000, 1:239-244.
8. Leon K, Faro J, Carneiro J: A general mathematical framework to
model generation structure in a population of asynchronously
dividing cells. J Theor Biol 2004, 229:455-476.
9. De Boer RJ, Perelson AS: Estimating division and death rates
from CFSE data. J Comput Appl Math 2005, 184:140-164.
10. Ganusov VV, Pilyugin SS, De Boer RG, Murali-Krishna K, Ahmed R,
Antia R: Quantifying cell turnover using CFSE data. J Immunol
Methods 2005, 298:183-200.
11. De Boer RJ, Ganusov VV, Milutinovic D, Hodgkin PD, Perelson AS:
Estimating lymphocyte division and death rates from CFSE
data. Bul Math Biology 2006, 68(5):1011-1031.
12. Luzyanina T, Mrusek S, Edwards JT, Roose D, Ehl S, Bocharov G: Com-
putational analysis of CFSE proliferation assay. J Math Biol 2007,
54:57-89.
13. Mantzaris NV, Liou JJ, Daoutidis P, Srienc F: Numerical solution of a
mass structured cell population balance model in an environ-
ment of changing substrate concentration. J Biotechnol 1999,
71:157-174.
14. Gurtin ME, MacCamy RC: Some simple models for nonlinear age-
dependent population dynamics. Math Biosci 1979, 43(3/
4):199-211.
15. Murray JD: Mathematical Biology Springer; 1993.
16. Webb GF: Theory of Nonlinear Age-Dependent Population Dynamics New
York: Marcel Dekker; 1985.
17. Bernard S, Pujo-Menjouet L, Mackey MC: Analysis of cell kinetics
using a cell division marker: mathematical modelling of exper-
imental data. Biophys J 2003, 84:3414-3424.
18. Sinko JW, Streifer W: A model for populations reproducing by
fission. Ecology 1971, 52:330-335.
19. Bell GI, Anderson EC: Cell growth and division I. A mathematical
model with application to cell volume distributions in mam-
malian suspension cultures. Biophys J 1967, 7:330-351.
20. Diekmann O, Heijmans HJM, Thieme HR: On the stability of the cell
size distribution. J Math Biol 1984, 19:227-248.
21. Metz JAJ, Diekmann O: The dynamics of physiologically struc-
tured populations. In Lecture Notes in Biomathematics Volume 68. Ber-
lin: Springer; 1986.
22. Shampine L: Solving hyperbolic PDEs in MATLAB. Appl Numer
Analysis and Comput Math 2005, 2(3):346-358.
23. Givan AL, Fisher JL, Waugh M, Ernstoff MS, Wallace PK: A flow cyto-
metric method to estimate the precursor frequencies of cells
proliferating in response to specific antigens. J Immunol Methods
1999, 230:99-112.
24. Matera G, Lupi M, Ubezio P: Heterogeneous cell response to
topotecan in a CFSE-based proliferation test. Cytometry A 2004,
62(2):118-128.
25. Asquith B, Debacq C, Florins A, Gillet N, Sanchez-Alcaraz T, Mosley A,
Willems L: Quantifying lymphocyte kinetics in vivo using car-
boxyfluorescein diacetate succinimidyl ester (CFSE). Proc R Soc
B 2006, 273:1165-1171.
26. Volodine T, Vanderstraeten D, Roose D: Smoothing of meshes and
point clouds using weighted geometry-aware bases. In Lecture
Notes in Computer Science Volume 4077. Edited by: Kim MS, Shimada K.
Springer; 2006:687-693.
27. Hansen PC: Rank-Deficient and Discrete Ill-Posed Problems: Numerical
Aspects of Linear Inversion Philadelphia, PA, USA; 1998.
28. Bertuzzi A, Gandolfi A, Vitelli R: Influence of cell loss in the analysis
of proliferating populations by flow cytometry. Math Biosc 1986,
82:257-260.
29. Banks HT, Fitzpatrick BG: Statistical methods for model compa-
rizon in parameter estimation problems for distributed sys-
tems. J Math Biol 1990, 28:501-527.
30. Banks HT, Fitzpatrick BG: Estimation of growth rate distributions
in size structured population models. Q Appl Math 1991,
XLIX(2):215-235.
31. Banks HT, Reich S, Rosen IG: An approximation theory for the
identification of nonlinear distributed parameter systems.
SIAM J Control Optim 1990, 28:552-569.
32. Banks HT: Some remarks on estimation techniques for size-
structured population models. In Lecture Notes in Biomathematics
Volume 100. Brlin: Springer; 1994.
33. Schittkowski K: Numerical Data Fitting in Dynamical Systems Dordrecht:
Kluwer Academic Publishers; 2002.
34. Gershenfeld N: The Nature of Mathematical Modelling Cambridge Uni-
versity Press; 2002.
35. Baker CTH, Bocharov GA, Paul CAH, Rihan FA: Computational
modelling with functional differential equations: identifica-
tion, selection and sensitivity. Appl Numer Math 2005, 53:107-129.
36. Richtmyer RD, Morton KW: Difference Methods for Initial-Value Problems
New York: Wiley Interscience; 1967.
Publish with BioMed Central and every
scientist can read your work free of charge
"BioMed Central will be the most significant development for
disseminating the results of biomedical research in our lifetime."
Sir Paul Nurse, Cancer Research UK
Your research papers will be:
available free of charge to the entire biomedical community
peer reviewed and published immediately upon acceptance
cited in PubMed and archived on PubMed Central
yours — you keep the copyright
Submit your manuscript here:
/>BioMedcentral
Theoretical Biology and Medical Modelling 2007, 4:26 />Page 15 of 15
(page number not for citation purposes)
37. Engquist B, Lötstedt P, Sjögreen B: Numerical filters for efficient
shock computations. Math Comput 1989, 52:509-537.
38. Matlab [ />]
39. Yates A, Chan C, Strid J, Moon S, Callard R, George AJ, Stark J: Recon-
struction of cell population dynamics using CFSE. BMC Bioinfor-
matics 2007, 8:196.
40. Grossman Z, Meier-Schellersheim M, Paul WE, Picker LJ: Pathogene-
sis of HIV infection; what the virus spares is as improtant as
what it destroys. Nature Medicine 2006, 12:289-295.
41. Hataye J, Moon JJ, Khoruts A, Reilly C, Jenkins MK: Naive and mem-
ory CD4
+
T cell survival controlled by clonal abundance. Sci-
ence 2006, 312:114-116.