Báo cáo y học: "A unified framework of immunological and epidemiological dynamics for the spread of viral infections in a simple network-based population" ppt
Bạn đang xem bản rút gọn của tài liệu. Xem và tải ngay bản đầy đủ của tài liệu tại đây (822.21 KB, 13 trang )
BioMed Central
Page 1 of 13
(page number not for citation purposes)
Theoretical Biology and Medical
Modelling
Open Access
Research
A unified framework of immunological and epidemiological
dynamics for the spread of viral infections in a simple
network-based population
David M Vickers*
1,2
and Nathaniel D Osgood*
2
Address:
1
Interdisciplinary Studies, College of Graduate Studies and Research, University of Saskatchewan, Saskatoon, Saskatchewan, Canada and
2
Department of Computer Science, College of Arts and Science, University of Saskatchewan, Saskatoon, Saskatchewan, Canada
Email: David M Vickers* - ; Nathaniel D Osgood* -
* Corresponding authors
Abstract
Background: The desire to better understand the immuno-biology of infectious diseases as a
broader ecological system has motivated the explicit representation of epidemiological processes
as a function of immune system dynamics. While several recent and innovative contributions have
explored unified models across cellular and organismal domains, and appear well-suited to
describing particular aspects of intracellular pathogen infections, these existing immuno-
epidemiological models lack representation of certain cellular components and immunological
processes needed to adequately characterize the dynamics of some important epidemiological
contexts. Here, we complement existing models by presenting an alternate framework of anti-viral
immune responses within individual hosts and infection spread across a simple network-based
population.
Results: Our compartmental formulation parsimoniously demonstrates a correlation between
immune responsiveness, network connectivity, and the natural history of infection in a population.
It suggests that an increased disparity between people's ability to respond to an infection, while
maintaining an average immune responsiveness rate, may worsen the overall impact of an outbreak
within a population. Additionally, varying an individual's network connectivity affects the rate with
which the population-wide viral load accumulates, but has little impact on the asymptotic limit in
which it approaches. Whilst the clearance of a pathogen in a population will lower viral loads in the
short-term, the longer the time until re-infection, the more severe an outbreak is likely to be. Given
the eventual likelihood of reinfection, the resulting long-run viral burden after elimination of an
infection is negligible compared to the situation in which infection is persistent.
Conclusion: Future infectious disease research would benefit by striving to not only continue to
understand the properties of an invading microbe, or the body's response to infections, but how
these properties, jointly, affect the propagation of an infection throughout a population. These
initial results offer a refinement to current immuno-epidemiological modelling methodology, and
reinforce how coupling principles of immunology with epidemiology can provide insight into a
multi-scaled description of an ecological system. Overall, we anticipate these results to as a further
step towards articulating an integrated, more refined epidemiological theory of the reciprocal
influences between host-pathogen interactions, epidemiological mixing, and disease spread.
Published: 20 December 2007
Theoretical Biology and Medical Modelling 2007, 4:49 doi:10.1186/1742-4682-4-49
Received: 16 August 2007
Accepted: 20 December 2007
This article is available from: />© 2007 Vickers and Osgood; licensee BioMed Central Ltd.
This is an Open Access article distributed under the terms of the Creative Commons Attribution License ( />),
which permits unrestricted use, distribution, and reproduction in any medium, provided the original work is properly cited.
Theoretical Biology and Medical Modelling 2007, 4:49 />Page 2 of 13
(page number not for citation purposes)
Background
Epidemics consist of dynamic processes at multiple bio-
logical scales. From host-pathogen interactions to host-
host interactions infectious diseases have had a major
influence on the development of our immune systems
and the evolution of human ecology [1,2]. In recent dec-
ades, remarkable advances in immunology and virology
have provided fundamental insights into the detailed
mechanisms of infection pathogenesis and immune rec-
ognition [3,4]. Meanwhile epidemiological modelling has
enriched our understanding of the properties of infectious
disease thus enabling humankind to better control its
spread [2].
Within an individual host, a major factor governing infec-
tious disease dynamics is how quickly and effectively the
immune system can respond to infection (hereafter
referred to as immune responsiveness) [1]. For clearing a
viral infection, this is defined as the average rate at which
naive CD8+ cells proliferate into cytotoxic T-lymphocytes
(CTLs) after encountering a viral antigen for the first time
[2-4]. The CTL responsiveness against a specific viral anti-
gen is likely to vary between individuals, as well as within
individuals over time (for example, at successive stages of
HIV infection) [1]. The effectiveness of an anti-viral CD8+
response will depend on molecular factors such as the
affinity of the T-cell receptor for the viral peptide in the
context of Major Histocompatibility Complex (MHC)
molecules, as well as MHC polymorphisms that deter-
mine which particular viral peptides are presented to the
immune system [1,3,5].
At epidemiological (or population) levels, the importance
of contact structure (or network connectivity) for disease
transmission has long been acknowledged [6]. Locally
structured networks can qualitatively alter infection
dynamics through clustering behaviour with pairs of con-
nected individuals sharing many common neighbours.
The effects of population heterogeneity on infection
spread are important but complex. Thus, when compared
to well-mixed populations, local heterogeneous contact
patterns can either slow or accelerate the progression of
infection – depending on the structure of the network [6-
14].
There are rich traditions of modelling centered specifically
on the dynamics of infections at cellular [1,15] and popu-
lation levels [2] that have profoundly advanced our
understanding of disease dynamics and control. While the
insights gained from these modelling techniques is
remarkable, it is becoming evident that there are unique
epidemiological processes of infectious diseases that are
likely governed by the dynamics of the immune systems
of individuals in a population (e.g., rebounds in the prev-
alence of some infectious diseases, antigenic variation and
competition, waning immunity, and transient cross-
immunity of sexually transmitted infections) [16]. Many
of these may have significant consequences for creating
optimum prevention strategies (e.g., vaccination or pro-
phylactic chemotherapies) and establishing an adequate
level of herd immunity.
In spite of the focused nature of current modelling appli-
cations, the need for integrating an immune system mech-
anism into epidemiological models has been recognized
[17-19], and unified theoretical templates of these biolog-
ical domains have been developed [20,21]. Although
these initial immuno-epidemiological frameworks dem-
onstrate innovation and clarity, they lack the representa-
tion of certain cellular components and immunological
processes needed to characterize important epidemiolog-
ical contexts such as antigenic variation, coinfection, and
the immunological impact of prevention efforts. As a
result, the link between host-pathogen interactions and
their impact on the spread of infectious diseases across a
population remains under-explored. Here, we present a
simple mathematical framework that provides an alter-
nate approach for unifying infection dynamics at the
immune system and epidemiological scales. Although the
analyses presented in this paper are almost entirely
abstract, in the broadest context we advance the argu-
ments that: one, individual immune response dynamics
are important for shaping population-wide disease
dynamics; and two, a modelling framework should not
only be focused on a linked transmission system that can
advance overall theoretical understanding, but also
inform infection control decisions.
Methods
Combined model for infection dynamics
To gain insight into how the basic laws of viral dynamics,
within an individual, will eventually affect the spread of a
virus throughout a population of connected individuals,
we considered a simple integrated model of the immune
response and population structure. To this end, we elabo-
rated on a simple, previously described model of the inter-
actions between a replicating virus, host cells, and cells of
the immune system specific for infected host cells
(namely CD8+ T-lymphocytes) [1,4]. We have modified
this framework by placing each individual in the popula-
tion within a simple randomly-distributed (Poisson) net-
work of 1000 people such that the viral load of a given
individual is linked with the viral load of adjacent individ-
uals within the network (described below). This basic
model of anti-viral immune responses and population
dynamics for each individual contains five variables:
uninfected cells x
i
, infected cells y
i
, free virus particles v
i
,
precursor CTLs (CTL
P
) (i.e., CD8+ cells that have recog-
nized a specific antigen but lack specific effector func-
Theoretical Biology and Medical Modelling 2007, 4:49 />Page 3 of 13
(page number not for citation purposes)
tions) w
i
, and CTL
P
cells that differentiate and inhibit viral
replication through cytotoxic effector activity (CTL
E
) z
i
.
Following Nowak and May [1] and Wodarz and col-
leagues [4], the emergence of uninfected cells occurs at a
constant rate
λ
. Infected cells arise through contact
between uninfected cells and free viral particles at a rate
β
x
i
v
i
and die at a rate ay
i
. A person's free virus load is pro-
duced by infected cells, at a rate ky
i
, and declines at a rate
uv
i
. The rate of CTL
P
proliferation for each person in the
population in response to antigen is given by c
i
y
i
w
i
. The
parameter c
i
denotes the CTL
P
responsiveness, which is
defined as the proliferation of specific precursor CTLs cells
(i.e., CTL
P
cells) after their first encounter with a foreign
antigen at the site of infection. While antigen is present,
CTL
P
cells differentiate into CTL
E
cells at a rate c
i
q. In the
absence of antigenic stimulation, each ith person's CTL
P
population decays at a rate bw
i
. Infected cells are killed by
CTL
E
cells at a rate of py
i
z
i
. The parameter p specifies the
rate at which CTL
E
cells kill infected cells. Once the infec-
tion is brought under control by the immune system, the
CTL
E
population decays at a rate hz
i
.
To this model, we have added an additional term specify-
ing that the rate at which a person's incoming flow of free
viral particles is proportional to the viral load of their
neighbours,
ω
i
∑
j∈P
A
ij
v
j
. Here,
ω
i
is the (typically very
small) coefficient of connectedness that defines the
weights on each of the connections between neighbours.
We hereafter refer to
ω
i
as the connectivity coefficient. The
expression A
ij
is a randomly selected, symmetric, binary n
× n adjacency matrix that describes "who is connected to
whom". This matrix describes the structure of the Poisson-
distributed network. The vector, v
j
, is the viral load of the
jth network contact of person i, and P is the population.
These assumptions lead to the following system of ordi-
nary differential equations:
=
λ
- x
i
(d +
β
v
i
)
=
β
x
i
v
i
- y
i
(a + pz
i
)
= ky
i
+
ω
i
∑
j∈P
A
ij
v
j
- uv
i
= c
i
y
i
w
i
(1 - q) - bw
i
= c
i
qy
i
w
i
- hz
i
.
We numerically solved the above system of equations for
each individual i in the population (i = 1, , 1000). The
initial conditions that accompanied this system of equa-
tions for viral introduction were:
In all simulation experiments, parameter values were
based on those presented previously by Wodarz and col-
leagues [4] (see Table 1). Symbolic equilibrium analyses
are presented in the Results section below.
For describing infection spread among the population, we
used the mean and accumulated mean viral load as our
main measure of infection prevalence. The accumulated
mean viral load, A
v
(t), in the population was the integral
of the mean viral load from the beginning of a given sim-
ulation (time 0) until time t, and was used as a proxy for
the final size and severity of an outbreak. It was defined as
x
i
y
i
v
i
w
i
z
i
xdy
i
v
i
ii
i
() / , ()
.,
,
,
()
.,
00
01 3
0
0
001 3
==
=
=
=
λ
if
otherwise
if
00
0001 00
,
, ()., ().
otherwise
and
==wz
ii
Table 1: Parameter values that were used in the simulations of the basic model.
Parameter Description Value (units)
λ
Production rate of uninfected cells 10.0 (cells/day)
d Rate of uninfected cell die-off 0.1 (day-1)
β
Rate infected cells are produced from uninfected cells and free virus 0.01 (virion·day
-1
)
a Infected cell death rate (due to virus) 0.5 (day
-1
)
p Rate that infected cells are killed by CTL
E
cells 1.0 (cells/day)
b Rate that CTL
P
die-off 0.001 (day
-1
)
q Fraction of CTL
P
cells that proliferate into CTL
E
cells 0.1 (T-cell/T-cell)
h Rate of CTL
E
die-off 0.1 (day
-1
)
k Rate at which free virions are produced from infected cells 3.0 (virion·day
-1
)
u Viral decay rate 3.0 (day
-1
)
Simulations were based on values used in Nowak and May [1], Nowak and Bangham [3] and Wodarz and colleagues [4]. Immune responsiveness
(c
i
) and the connectivity coefficient (
ω
i
) were varied throughout this paper. Their specific values for each simulation experiment are described in
the Methods section.
Theoretical Biology and Medical Modelling 2007, 4:49 />Page 4 of 13
(page number not for citation purposes)
, where is the mean viral
load in the population at time t, and where |P| is the
number of people in the population.
Individual immune responsiveness
For experiments associated with parameter c
i
, we exam-
ined the effect of assuming specific values (homogeneous
across the population) on infection spread. However,
because individuals are likely to vary in their ability to
respond to infection [4,5], we also conducted experiments
in which the population was divided into two halves with
different c
i
, and in which each individual's immune
responsiveness was drawn from a truncated normal distri-
bution with (
µ
= 0.063 and
σ
2
= 0.0005) and confined to
support over the interval [0.01,0.1]. Variance was esti-
mated from the square of the interval divided by four:
. Our mean and range values were derived
from the values studied by Wodarz and colleagues [4]. In
all cases, values of c
i
were set at the beginning of the sim-
ulation, and remained static for the duration of that sim-
ulation.
Weight of network connectivity between people and
infection spread
One of the most obvious features of viruses is their capac-
ity for person-to-person transmission [7]. Contact pat-
terns provide important information for understanding
the transmission properties of the pathogens, themselves,
as well as where to concentrate prevention efforts [6].
Because exact values for the connectivity coefficient
ω
i
will
often vary over time [7], we assumed that
ω
i
followed a
random uniform distribution with mean,
and variance, . The value of
ω
i
was
dynamically varied for the majority of our analyses. Just as
with immune responsiveness, the circumstances that
focused on the specific effect of a person's connectivity,
ω
i
was assigned a constant value for the entire population.
High, moderate, and low values of
ω
i
were arbitrarily
assumed to be 1.0 × 10
-3
, 1.0 × 10
-6
, and 1.0 × 10
-9
, respec-
tively.
Time until re-infection and immunological memory
A direct consequence of an individual's ability to respond
to and eliminate an infection is the formation of immu-
nological memory. Within the host, memory CD8+ T-cell
populations have the ability to rapidly elaborate effector
functions to respond quickly and efficiently when re-
exposed to infection. These properties of memory cells
will not only decrease the duration of subsequent infec-
tion within the host, but their presence is considered to
increase the level of herd immunity in a population
[22,23]. And yet, the generation of memory T-cells exhib-
its both antigen-dependent and antigen-independent
characteristics [4,24]. This appears to rely on the time
scale of the infection being studied: antigen-independent
immunological memory has largely been observed in
acute infections, while antigen-dependence has been
observed in the context of persistent infections [25].
To examine the effect of re-infection on the accumulated
viral load in the population, we considered two different
scenarios. Scenario one was after an acute infection that
was completely cleared by the immune system and where
memory CTLs (here a proportion of CTL
P
cells) persist for
long periods of time in an antigen-independent environ-
ment. Scenario two was for a low-grade persistent infec-
tion characterized by a high acute-phase viral load
followed by a reduction to very low levels but not com-
plete elimination. Specifically, this involved re-introduc-
ing infection at a disease-free equilibrium (see below),
where viral antigen has been eliminated (scenario one),
and comparing it to re-introducing infection near an
endemic equilibrium (see below), where viral antigen has
persisted at low levels (scenario two). For all re-infection
experiments, both the population and an individual were
separately re-infected at time t = 9000 days with a viral
load that is equal to the initial amount of virus, v
i
(0). We
also investigated periodically re-infecting the population
and an individual at t = 1000, 3000, 6000, and 9000 days.
For each scenario, the values of c
i
(immune responsive-
ness) and b (rate of CTL
P
die off) assumed values accord-
ing to Wodarz and colleagues [4] for the comparison of
antigenic persistence and elimination. Here, individuals
were assumed to be strong responders c
i
= 0.1, and have a
slow rate of CTL
P
die off b = 0.001.
Because our basic model is deterministic and was origi-
nally used to describe persistent viral infections [3], CTL
E
responses cannot reduce both v
i
(t) and A
v
(t) → 0. There-
fore, following Wodarz and colleagues [4], for scenario
one (above) we defined a threshold value where virus,
although likely at low levels, was considered extinct, v
ext
.
For our simulations of long-term dynamics that assumed
that the virus was eliminated, our extinction threshold
was chosen (arbitrarily) to be marginally larger than the
endemic equilibrium value = 0.013. Here v
ext
= 0.015.
At v d
v
t
() ( )=
∫
ττ
0
vt
v
i
t
i
P
()
()
=
∑
01 001
4
2
−
θθ
12
2
05
+
= .
()
.
θθ
21
2
12
0 083
+
=
ˆ
v
i
Theoretical Biology and Medical Modelling 2007, 4:49 />Page 5 of 13
(page number not for citation purposes)
Varying the infecting dose
The outcome of viral infection, in general, is thought to be
related to the size of the infecting dose a person initially
receives [23]. Therefore, we also investigated the impact of
varying the infecting doses a person received from their
network contacts. More specifically, we examined the sit-
uation of = ky
i
+
ω
i
φ
∑
j∈P
A
ij
v
j
- uv
i
, where
φ
is the con-
stant for the infecting dose received by a person from their
network contacts, with
φ
= 1 being the default value. These
experiments allowed to us to obtain an initial understand-
ing of the dynamical behaviour of the model under differ-
ent viral quantities transmitted throughout the
population. For these experiments a person's immune
responsiveness, c
i
, was a static random variable and the
network connectivity coefficient,
ω
i
, was a stochastically-
varied random variable.
Results
Equilibrium analyses
For a single-person where A
1,1
= 0, the equations in the
basic model are associated with three equilibria. The first
is a disease-free equilibrium in which free virus, infected
cells, CTL
P
, and CTL
E
cells are all absent, and only unin-
fected cells are present: .
This equilibrium is unstable for the scenario in which viral
antigen persists, but is locally stable when viral antigen is
eliminated. The second equilibrium is a stable endemic
equilibrium, in which free viral particles and infected cells
are in balance with uninfected, CTL
P
, and CTL
E
cells:
The final equilibrium is an unstable "defense-free" equi-
librium in which free viral particles, uninfected cells, and
infected cells are present, but at which CTL
P
and CTL
E
cells
are absent:
The equilibria described above for a single-person have a
close relationship with the equilibria for a connected
multi-person population. For a multi-person population,
the number of equilibria for our basic model rises geomet-
rically with population size. While the count and stability
of these equilibria differ significantly for the cases of anti-
genic persistence and elimination, two equilibria are
shared by both scenarios: the first is a unique disease-free
equilibrium, in which the values of the state variables for
each individual in the population are identical to those
under the single-person disease-free equilibrium.
Compared to the corresponding single-person equilib-
rium, this multi-person equilibrium is unstable for the
case in which viral antigen is assumed to persist, but is
locally stable for the case in which a viral antigen is elim-
inated; the second is a unique stable endemic equilib-
rium, in which the values of the state variables for each
individual in the population are very close to those that
would obtain for a single-person endemic equilibrium,
but are slightly offset due to the small rate of virions trans-
mitted by neighbours. For example, given a very high cou-
pling coefficient (
ω
i
= 0.001), the difference of viral levels
between the single-person and multi-person endemic
equilibrium is only 3 per cent for an individual with 5
neighbours (not shown). The exact formula for each equi-
libria value, of each individual, will depend on popula-
tion size and network structure; because of this
dependence, and because the equilibria for each individ-
ual within a multi-person population are similar to the
corresponding single-person equilibrium, we do not
describe a general formula here.
The number and stability of the remaining equilibria
beyond the two just described depend on whether viral
antigen is assumed to be eliminated. If antigen persists,
and we ignore all non-physical equilibria associated with
negative values of state variables, a total of 2
|P|
+ 1 distinct
equilibria will be associated with a population of size |P|.
In addition, there is a set of unstable 2
|P|
- 1 "combinato-
rial" equilibria in which some individuals are in a state
very close to the defense-free equilibrium or to the
endemic equilibrium for the single person case. Thus,
each such population-wide unstable equilibrium is essen-
tially a simple superposition of the single-person defense-
free and endemic equilibria. As in the single-person case,
the endemic equilibrium is the sole stable equilibrium.
For a model that assumes viral antigen is eliminated, the
structure and stability of the equilibria are significantly
different. Recall that for a given non-zero virus extinction
threshold, the disease free equilibria for each individual in
isolation and for the population as a whole are locally sta-
ble. However, if a virus is driven extinct within a person,
any finite-rate perturbations to the viral load in that indi-
vidual disease free equilibrium will be insufficient to ele-
vate their viral load, and will therefore maintain complete
extinction of the virus. A given individual who has under-
gone viral clearance will therefore remain virus-free even
in response to coupling with neighbours. As a result, a
population of size |P| will exhibit 3
|P|
equilibria. Specifi-
cally, for different individuals this will include both 2
|P|
v
i
ˆ
() ,
ˆˆˆ
ˆ
xx yvwz
d
======00
λ
ˆ
()
()
ˆ
()
ˆ
()
ˆ
()(
x
uc q
duc q kb
y
b
cq
v
kb
uc q
w
hq
=
−
−−
=
−
=
−
=
−
λ
β
βλ
1
111
1
2
cck aduc a kb q
qbp duc q kb
z
aduc ck
−− −
()
−+
=−
−
)()
(( ) )
ˆ
()
β
β
βλ
1
1
and
(()
()
.
qakb
pduc q p kb
−−
−−
1
1
β
β
ˆ
,
ˆ
,
ˆ
,
ˆ
ˆ
.x
ua
k
y
uad k
ak
v
uad k
ua
wz==
−
=
−
==
β
λβ
β
λβ
β
and 0
Theoretical Biology and Medical Modelling 2007, 4:49 />Page 6 of 13
(page number not for citation purposes)
globally stable endemic and disease-free equilibria and
3
|P|
- 2
|P|
unstable defense-free equilibria.
Simulation experiments
Immune responsiveness limits viral transmission
The abundance of virus – that is, the viral load – is an
important correlate of pathogenicity and disease progres-
sion of many viral infections [3]. Our integrated model
both reproduced the well-known relationships between
an individual's immune responsiveness c
i
and their viral
load (Figs. 1 and 2) [1,4], and demonstrated the implica-
tions of this relationship to the short-term dynamics of an
outbreak (Fig. 3). Overall, a population that possesses a
high value for c
i
will reduce the scale and overall severity
of an outbreak when compared to a population of weaker
responders (Fig. 3A and 3B). Interestingly, these results
demonstrate a correlation between immune responsive-
ness and the natural history of infection in the popula-
tion. For populations of strong responders, infection is
eliminated (or at least depleted to very low levels),
whereas in a population of weak responders infection is
likely to become endemic (Fig. 3A). If we assume that a
population is composed of a combination of strong and
weak responders, then starting an infection in either a
weak (low c
i
) or strong (high c
i
) responder, interestingly,
had no significant impact on the overall severity of an out-
break (Fig. 3C). More realistic assumptions of heterogene-
ity, in which a person's immune responsiveness is drawn
from a random normal distribution, resulted in a lower
viral load in the population. On the whole, these experi-
ments suggest that increasing the disparity between peo-
ple's ability to respond to an infection, while maintaining
an average rate may worsen the overall impact of an out-
break within that population (Fig. 3A and 3B).
Network connectivity affects the time between peaks in the viral load
Varying the magnitude of peoples' connectivity coefficient
ω
i
in our model re-produced previously described behav-
iour of infection spread, and therefore built confidence in
our model structure with respect to previous discussions
of contact patterns [6-8,14] (Fig. 4). High values for
ω
i
reduced the time until the peak of an outbreak as well as
the timing between peak viral levels in neighbouring indi-
viduals, while infection spread was delayed among the
population when values of
ω
i
were low (Fig. 4A). Given
these particular assumptions regarding the strength of
connectivity among individuals, it is also likely that delays
in disease progression (demonstrated by an increased
period between oscillatory peaks) will be observed. With
larger values of
ω
i
, the numbers of peaks and troughs in
the prevalence are reduced, and begin to merge into a
more continuous (and more familiar) outbreak pattern
(Fig. 5). While changing
ω
i
changes the rate with which
the population-wide viral load accumulates, it has little
impact on the asymptotic limit of that viral load (Fig. 4B).
Our present methodology also allowed us to investigate,
in the context of different combinations of immune
responsiveness, the impact of a person's connectivity coef-
ficient
ω
i
, on infection spread in a population. These con-
siderations demonstrate, rather intuitively, that the peak
mean viral load and the subsequent accumulated viral
load in the population will decrease for a combination of
low connectivity and high immune responsiveness, while
increasing for high connectivity and low immune respon-
siveness (Fig. 4C and 4D). Furthermore, performing 100
Monte Carlo iterations across randomly varied parameter
values for immune responsiveness, the connectivity coef-
ficient, and randomly generated network structures high-
lighted that the above results are likely to be quite robust
for many different combinations of parameter values (Fig.
6).
Re-infection, immunological memory, and herd immunity
Figures 7 and 8 present the simulation experiments for re-
infection. Under scenario one, our model indicates that
the longer the period until re-infection, the larger the
post-exposure mean viral load in the population will be
(Fig. 7A). This reflects that, as the time prior to re-infec-
tion increases, the CTL
P
populations are likely to decline
towards naive levels and approach the disease-free equi-
librium. With increasing time until re-infection, an indi-
vidual will require a longer time to mount an effective
immune response to reduce the severity of that re-infec-
tion (Fig. 8A). For scenario two (i.e., viral antigen persists
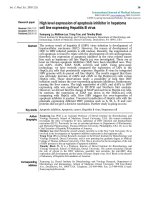
Evolution of individual viral load of infected cases and their network contactsFigure 1
Evolution of individual viral load of infected cases and
their network contacts. For illustrative purposes, results
displayed here are for three people in the population. Person
3 (black lines) and Person 1 (blue lines) are connected, and
Person 1 and Person 2 (red lines) are connected. Here, c
i
=
0.01 (dotted lines), 0.05 (solid lines), and 0.1 (dashed lines)
(Here v
ext
= 0.015 and
ω
i
was assumed to be a uniformly dis-
tributed random variable).
Theoretical Biology and Medical Modelling 2007, 4:49 />Page 7 of 13
(page number not for citation purposes)
after primary exposure), the recovered population does
not experience positive viral growth if the virus is reintro-
duced (Fig. 7B). Therefore, any re-infection that is likely to
occur will result in immediate inhibition of viral particles,
and no considerable infection will take hold. What is
interesting is that the asymptotic accumulated viral load
from re-infection is essentially the same regardless of anti-
genic requirements or whether re-infection occurs repeat-
edly over time or infrequently later in time (Fig. 7B).
Notably, having key core people's immune system primed
against re-infection causes them to serve as barriers that
prevent that infection from reaching the rest of the popu-
lation (Fig. 9A). We expect this to be because by time t =
9000 days, one person possess an elevated level of virus-
specific CTL
P
cells (Fig. 9B) and will be able to easily
increase the abundance of CTL
E
cells (Fig. 9C). Thus, this
person is able to (almost instantaneously) clear the infec-
tion when it is reintroduced at t = 9000 days. This interest-
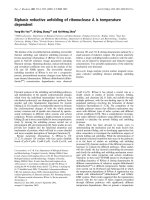
The impact of a person's immune responsiveness for the short-term dynamics of an outbreakFigure 3
The impact of a person's immune responsiveness for
the short-term dynamics of an outbreak. (A and B) A
comparison between the immune responsiveness and the
overall behaviour of an outbreak (A), as well as the overall
severity an outbreak (B), as measured by the mean and accu-
mulated viral load in the population, respectively. Mean and
accumulated viral loads were computed from simulating our
basic model for constant values of immune responsiveness: c
i
= 0.001 (blue line), 0.01 (red line), 0.1 (yellow line), and ran-
dom uniformly distributed (black line). (C) Assuming that the
population is composed of an equal proportion of stronger c
i
= 0.1 and weaker responders c
i
= 0.016, the model was simu-
lated to study the effect on the accumulated viral load in the
population by starting the infection in the sub-population of
stronger responders (red line) and weaker responders (blue
line). These experiments demonstrate no clear correlation
between viral load and starting an infection in either strong
or weak responders. For scenarios (A, B, and C) the connec-
tivity coefficient,
ω
i
, was a stochastic random variable. All
other parameter values were based on values presented by
Wodarz and colleagues [4] and are displayed in Table 1.
Variations in parameter values and their effect on the popula-tion-wide accumulated viral loadFigure 2
Variations in parameter values and their effect on
the population-wide accumulated viral load. Additional
parameter values investigated when studying the effect of (A)
immune responsiveness and the connectivity coefficient (B)
on the population-wide accumulated viral load.
Theoretical Biology and Medical Modelling 2007, 4:49 />Page 8 of 13
(page number not for citation purposes)
ingly implies that, given the assumptions used in the
model here, re-infecting key core people can be beneficial
to the population.
Variations in the infecting dose
As expected, increases to the constant
φ
resulted in an
increase in a person's viral load. It bears noting that,
increasing the viral load incoming from a person's neigh-
bour also appeared to have a similar effect on the timing
of a person's peak viral load (i.e., larger values of
φ
lead to
tighter spacing in time between the peaks in viral load of
connected individuals) (Fig. 10A). However, this change
in behaviour at the individual level did not appear to have
quite the same impact at the population level, as there was
no substantial change in the asymptotic behaviour of the
accumulated viral load (Fig. 10B).
Discussion
Future infectious disease research would benefit by striv-
ing to not only understand the properties of the invading
microbe, or the body's response to infections [5], but also
how individual responses affect the propagation of an
infection throughout a population. Whilst this is not the
first attempt to explicitly combine the nonlinear dynamics
of immune reactions within individuals and the overall
nonlinear dynamics of the interaction between an infec-
tion and a population of hosts, previous frameworks are
better adapted to understanding very specific aspects of
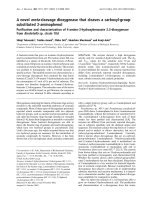
The transmission of virus across the population differs for variations in the connectivity coefficient,
ω
i
Figure 4
The transmission of virus across the population differs for variations in the connectivity coefficient,
ω
i
. (A)
Higher values of the connectivity coefficient (
ω
i
= 1.0 × 10
-3
) shortened the time required to spread the disease through the
population, as well as the peak of the outbreak (blue line). Lower values of the connectivity coefficient (
ω
i
= 1.0 × 10
-4
and 1.0
×10
-5
) had the opposite effect (red and yellow lines, respectively). (B) Both high and low values of
ω
i
demonstrated no apparent
sizeable relationship with the accumulated viral load in the population (colour code the same as 3A). For scenarios (A and B) a
person's immune responsiveness was randomly determined from a random normal distribution with
µ
= 0.063 and
σ
= 0.0225
(see Methods for further details). For scenarios (C and D), immune responsiveness for fixed values of c
i
= 0.1 and 0.016 were
combined in simulations with different fixed values of
ω
i
= 1.0 × 10
-3
and 1.0 × 10
-5
. The colour code is the same for 3A.
Theoretical Biology and Medical Modelling 2007, 4:49 />Page 9 of 13
(page number not for citation purposes)
viral infections, such as re-exposure to viral antigen [20]
and the role of memory T-cells in clearing reinfection [21].
In our opinion, our framework complements such previ-
ous contributions by incorporating a more detailed repre-
sentation of the mechanisms of antiviral immune
response, and thus will contribute towards improved
understanding the immuno-epidemiological dynamics of
viruses and other intracellular pathogens.
Viral dynamics for re-infection to antigen when it is elimi-nated compared to when it persistsFigure 7
Viral dynamics for re-infection to antigen when it is
eliminated compared to when it persists. Antigen was
re-introduced to the whole population, at t = 1000, 3000,
6000, and 9000 days (yellow and blue lines), or at a single
time step (t = 9000 days) (black and red lines) under the
assumption of antigenic elimination and antigenic persistence,
respectively. Here,
ω
i
= 0.1, and a v
ext
= 0.015 was used in
antigenic elimination simulations. (A) With the exception of
antigenic persistence (red and blue lines), re-infection for the
population at different intervals produces qualitatively differ-
ent behaviour than antigenic elimination (yellow and black
lines). However, the asymptotic accumulated viral load in the
population is similar, regardless of whether or not antigen
persists or is eliminated. (B) These qualitative differences are
also observable for the mean viral load in the population.
Assuming either scenario one or two, a small positive growth
in the mean viral load following re-infection at t = 1000,
3000, 6000 days (yellow line), and at t = 9000 days (black and
red lines) occurs.
Mean (A) and accumulated (B) viral loads in the population after 100 Monte Carlo realizationsFigure 6
Mean (A) and accumulated (B) viral loads in the pop-
ulation after 100 Monte Carlo realizations. Each reali-
zation is associated with a randomly selected Poisson
network, as well as a randomly selected value of immune
responsiveness (drawn from a normal distribution) and dis-
tinct stochastic trajectories for network connectivity coeffi-
cients (drawn from a uniform distribution).
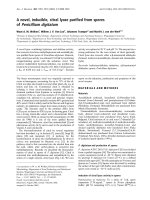
Prevalence of a disease (per 1000 population) based on dif-ferent values of
ω
i
Figure 5
Prevalence of a disease (per 1000 population) based
on different values of
ω
i
. Here,
ω
i
= 1.0 × 10
-1
(red curve),
1.0 × 10
-3
(yellow curves), 1.0 × 10
-6
(black curves), and 1.0 ×
10
-9
(blue curves).
Theoretical Biology and Medical Modelling 2007, 4:49 />Page 10 of 13
(page number not for citation purposes)
These initial results reinforce how coupling principles of
immunology with epidemiological mixing provide a
multi-scaled description of the relational aspects of an
ecological system. In the short-term, the immune respon-
siveness of the population as a whole produces some very
well-defined emergent properties and thus is likely to
determine the natural history of disease in that popula-
tion [21]. That is, there exist levels of immune responsive-
Having people's immune systems primed through re-infection prevents infection from reaching the rest of the populationFigure 9
Having people's immune systems primed through re-
infection prevents infection from reaching the rest of
the population. Having key core people's immune system
primed against re-infection (A and B) causes them to serve as
barriers that prevent an outbreak from reaching the rest of
the population, as measured by the accumulated viral load
(C).
Immune system dynamics for re-infection when viral antigen is eliminated compared to when it persistsFigure 8
Immune system dynamics for re-infection when viral
antigen is eliminated compared to when it persists.
Here, the same re-introduction protocol as for Fig. 5 was fol-
lowed. (A) Antigenic persistence (red and blue lines) keeps
CTL
P
abundance continually high regardless of when antigen
is re-introduced repeatedly at t = 1000, 3000, 6000, and 9000
days (blue line) or only once at t = 9000 days (red line). Anti-
genic elimination (with slow rates of CTL
P
decline, b = 0.001
day
-1
, high immune responsiveness, c
i
= 0.1, and assumed v
ext
= 0.015) demonstrates that re-expansion requires time for
individuals to mount an effective immune response (yellow
and black lines). (B and C) There is also a proportional, posi-
tive growth in the abundance of CTL
E
cells that follows
directly from the expansion of CTL
P
cells after single instance
of re-introducing viral antigen (B) assuming antigen is elimi-
nated (black line) or antigen persists (red line), as well as
repeated re-introduction (C) assuming antigen persistence
(blue line) and antigenic elimination (yellow line).
Theoretical Biology and Medical Modelling 2007, 4:49 />Page 11 of 13
(page number not for citation purposes)
ness whereby a population of connected individuals will
be able to eliminate a viral infection, while at others, it
will likely become endemic. Interestingly, these emergent
properties of our model demonstrate consistency with
both traditional susceptible-infectious-removed proper-
ties (for populations with higher values of immune
responsiveness) and susceptible-infectious-susceptible
properties (for populations of weaker responders) within
the clusters of people in the population even though these
compartments were not explicitly defined (see Figs. 3A
and 5). They also reproduce well-known dynamics of re-
infection in a population after long periods of time [2], as
well as intuition-based observations of how host-patho-
gen interactions influence herd immunity [22,24]. How-
ever, because these population-based results stem from an
explicit description of the immune system, hypotheses
relating the production of immunological memory to the
long-term effects of re-exposure on the population can
now be mathematically formulated and studied.
Another interesting result from this particular system is
that the asymptotic accumulated viral load after re-infec-
tion is essentially conserved regardless of whether the
virus is eliminated, if it persists, or whether re-infection
occurs repeatedly over time or infrequently later in time.
This conservation property reflects the fact that given the
same starting point in state space, the value of z (t) and w
(t) depends only on the integral of the count of infected
cells y from 0 to t, and not on the specific trajectory taken
by y within that interval. Conservation of morbidity
within the population also raises a potentially important
(and possibly controversial) question when it comes to
creating control strategies, particularly for recurrent dis-
eases such as influenza: is preventing population-wide
reinfection until later in time that much more effective
than having continual population-wide reinfection over
time when the end results are likely to be similar?
Our methodology has made several simplifying assump-
tions that should be investigated. We imposed neither
viral load thresholds required for contagion, nor any dif-
ference or quantization in the infecting dose people
received. Although the outcome of viral infection, in gen-
eral, is thought to be related to the size of the infecting
dose a person initially receives [18], we found that our
results were robust against variations in this parameter
(see Fig. 10). Investigating the impact of different network
structures (e.g., scale-free and small-world networks) is an
important area of ongoing work.
Following Nowak and May [1], we have also assumed a
basic model for virus dynamics. Because of the known
role of CD8+ T-cells in the elimination of virally-infected
host cells (e.g., influenza A infections [26-29], or adenovi-
rus infections [30]), we have focused our discussion of
immune responsiveness on CTLs, and thus ignored other
types of innate and specific immunity. Our focus on CTL-
mediated viral elimination was, largely, an attempt to
establish plausibility of the multi-scale methods pre-
sented, not necessarily their complete adherence to
immunological reality; the cytotoxic properties of acti-
vated CD8+ cells for clearing a viral infection are certainly
not the whole story, and other immune responses are
likely to affect the production of free virus. It should be
noted, however, that the effect of other immune responses
can be described in terms of this basic model by modify-
ing its existing parameters. For example, production of
cytokines by CD4+ T
H
cells are likely to reduce the infec-
tivity parameter
β
and/or the rate at which infected cells
are produced, k, while the role of neutralizing antibody-
or complement-mediated responses may also enhance the
Simulations of increasing the viral load transmitted to a per-son from their network contactsFigure 10
Simulations of increasing the viral load transmitted
to a person from their network contacts. Individual
viral loads (A), and accumulated viral load in the population
(B) for a two- (dashed curves) and five-fold (dotted curves)
increases in the quantity of free viral particles transmitted
from a person's neighbour, compared to the simulations of
the basic model used in the main text (solid curves). Again
for illustrative purposes, the results in (A) are displayed for
the same three individuals used in Fig. 1: Person 1 (blue
curves), Person 2 (red curves), and Person 3 (black curves).
Theoretical Biology and Medical Modelling 2007, 4:49 />Page 12 of 13
(page number not for citation purposes)
removal rate of free viral particles, u [1]. Although consid-
ering other immune responses is assumed to have an
additional influence on the viral dynamics at population
levels [31,32], previous research at the individual level
suggest that they are associated with qualitatively similar
dynamics to those governing CTLs [1,3,4]. However,
explicitly describing the cooperative interactions between
CTLs and other immune responses, in the form of addi-
tional state equations, and their effect on the transmission
of specific microparasite infections is also an important
area of ongoing study.
Conclusion
Despite the extensive use of mathematics in epidemiol-
ogy, many theoretical challenges remain [33]. To improve
our understanding of infectious diseases, future research
will require theoretical tools that incorporate immuno-
logical and epidemiological features into a unified tem-
plate [16,18]. Our goal in this paper was to expand upon
the utility of merging aspects of immunology and epide-
miology into a single conceptual framework. This analysis
has produced some interesting and potentially important
conclusions. We anticipate this framework to be a step
towards articulating an overall, integrated, and more
refined epidemiological theory that simultaneously
describes broad categories of diseases dynamics at both
cellular and organismal levels. Under a unified frame-
work, continued molecular research on disease pathogen-
esis and host-pathogen interactions will likely have a
reciprocal influence on epidemiological theory. Ideally,
improvements to these combined theoretical templates
will prove useful for the prediction of future trends in
infectious disease epidemiology. Such combined method-
ologies could also lead to novel insights into understand-
ing microparasite evolution and its role in disease
virulence and persistence. Ultimately, these initial find-
ings suggest that there are important immunological con-
sequences to consider when designing effective
interventions to control new variations of familiar dis-
eases.
Competing interests
The author(s) declare that they have no competing inter-
ests.
Authors' contributions
D.M.V. and N.D.O. contributed equally to the writing of
this manuscript and both have approved the final version.
Acknowledgements
N.D.O. and D.M.V. are indebted to Dr. Beni Sahai and two anonymous
Reviewers for their helpful immunological and modelling comments,
respectively, on earlier versions of this manuscript, as well as to Qian Zhang
for assisting with some analyses for the revised version of this manuscript.
N.D.O. would also like to thank the Natural Sciences and Engineering
Research Council of Canada for their financial support of his research
(NSERC Discovery Grant RGPIN-327290-20).
References
1. Nowak M, May R: Virus Dynamics Oxford University Press; 2000.
2. Anderson R, May R: Infectious Diseases of Humans Oxford Univeristy
Press; 1991.
3. Nowak M, Bangham R: Population dynamics of immune
responses to persistent viruses. Science 1996, 272:74-79.
4. Wodarz D, May RM, Nowak MA: The role of antigen-independ-
ent persistence of memory cytotoxic T lymphocytes. Int
Immunol 2000, 12(4):467-477.
5. Mims C, Nash A, Stephen J: Mims Pathogenesis of Infectious Diseases
Elsevier Academic Press; 2002.
6. Mollison D: Spatial contact models for ecological and epi-
demic spread. Journal of the Royal Statistical Society, Series B 1977,
29:283-326.
7. Wallinga J, Edmunds W, Kretzschmar M: Perspective: human con-
tact patterns and the spread of airborne infectious diseases.
TRENDS in Microbiology 1999, 7:327-377.
8. Newman M, Barabasi A, Watts D: The Structure and Dynamics of Net-
works Princeton University Press; 2006.
9. Ball F, Mollison D, Scalia-Tomba G: Epidemics with two levels of
mixing. Annals of Applied Probability 1997, 7:46-89.
10. Keeling M: The effects of local spatial structure on epidemio-
logical invasions. Proceedings of the Royal Society of London B 1999,
266:859-867.
11. Kuperman M, Abramson G: Small world effect in an epidemio-
logical model. Phys Rev Lett 2001, 86(13):2909-2912.
12. Pastor-Satorras R, Vespignani A: Epidemic spreading in scale-
free networks. Phys Rev Lett 2001, 86(14):3200-3203.
13. Aparicio J, Pascual M: Building epidemiological models from R0:
an implicit treatment of transmission in networks. Proceedings
of the Royal Society B 2007, 274:505-512.
14. Lloyd A, May R: How viruses spread among computers and
people. Science 2001, 292:1316-1317.
15. Antia R, Nowak MA, Anderson RM: Antigenic variation and the
within-host dynamics of parasites. Proc Natl Acad Sci USA 1996,
93(3):985-989.
16. Lena S, Pourbohloul B, Brunham RC: Effect of immune response
on transmission dynamics for sexually transmitted infec-
tions. J Infect Dis 2005, 191(Suppl 1S78-S84 [ />10.1086/425289].
17. Dushoff J: Incorporating immunological ideas in epidemiolog-
ical models. J Theor Biol 1996, 180(3181-187 [ />10.1006/jtbi.1996.0094].
18. Hellriegel B: Immunoepidemiology-bridging the gap between
immunology and epidemiology. Trends Parasitol 2001,
17(2):102-106.
19. Grenfell B, Pybus O, Cog J: Unifying the epidemiological and
evolutionary dynamics of pathogens. Science 2004,
303:327-332.
20. Tuckwell H, Toubiana L, Vibert J: Spatial epidemic network mod-
els with viral dynamics. Physical Review E 1998, 57:2163-2169.
21. Kostova T: Persistence of viral infections on the population
level explained by an immunoepidemiological model. Math
Biosci 2007, 206(2309-319 [ />j.mbs.2005.08.003].
22. Welsh RM, Selin LK, Szomolanyi-Tsuda E: Immunological mem-
ory to viral infections. Annu Rev Immunol 2004, 22:711-743 [http:/
/dx.doi.org/10.1146/annurev.immunol.22.012703.104527].
23. Badovinac VP, Harty JT: Programming, demarcating, and
manipulating CD8+ T-cell memory. Immunol Rev 2006,
211:67-80 [ />].
24. Bachmann MF, Beerli RR, Agnellini P, Wolint P, Schwarz K, Oxenius
A: Long-lived memory CD8+ T cells are programmed by pro-
longed antigen exposure and low levels of cellular activation.
Eur J Immunol 2006, 36(4842-854 [ />eji.200535730].
25. Wherry EJ, Barber DL, Kaech SM, Blattman JN, Ahmed R: Antigen-
independent memory CD8 T cells do not develop during
chronic viral infection. Proc Natl Acad Sci USA 2004,
101(4516004-16009 [ />].
Publish with BioMed Central and every
scientist can read your work free of charge
"BioMed Central will be the most significant development for
disseminating the results of biomedical research in our lifetime."
Sir Paul Nurse, Cancer Research UK
Your research papers will be:
available free of charge to the entire biomedical community
peer reviewed and published immediately upon acceptance
cited in PubMed and archived on PubMed Central
yours — you keep the copyright
Submit your manuscript here:
/>BioMedcentral
Theoretical Biology and Medical Modelling 2007, 4:49 />Page 13 of 13
(page number not for citation purposes)
26. Keating R, Yue W, Rutigliano JA, So J, Olivas E, Thomas PG, Doherty
PC: Virus-specific CD8+ T cells in the liver: armed and ready
to kill. J Immunol 2007, 178(5):2737-2745.
27. Wiley JA, Tighe MP, Harmsen AG: Upper respiratory tract resist-
ance to influenza infection is not prevented by the absence
of either nasal-associated lymphoid tissue or cervical lymph
nodes. J Immunol 2005, 175(5):3186-3196.
28. Wiley JA, Hogan RJ, Woodland DL, Harmsen AG: Antigen-specific
CD8(+) T cells persist in the upper respiratory tract follow-
ing influenza virus infection. J Immunol 2001, 167(6):3293-3299.
29. Turner SJ, Cross R, Xie W, Doherty PC: Concurrent naive and
memory CD8(+) T cell responses to an influenza A virus. J
Immunol 2001, 167(5):2753-2758.
30. Tatsis N, Fitzgerald JC, Reyes-Sandoval A, Harris-McCoy KC, Hensley
SE, Zhou D, Lin SW, Bian A, Xiang ZQ, Iparraguirre A, Lopez-Cama-
cho C, Wherry EJ, Ertl HCJ: Adenoviral vectors persist in vivo
and maintain activated CD8+ T cells: implications for their
use as vaccines. Blood 2007, 110(61916-1923 [ />10.1182/blood-2007-02-062117].
31. Gog JR, Rimmelzwaan GF, Osterhaus ADME, Grenfell BT: Popula-
tion dynamics of rapid fixation in cytotoxic T lymphocyte
escape mutants of influenza A. Proc Natl Acad Sci USA 2003,
100(1911143-11147 [ />].
32. Holmes EC, Ghedin E, Miller N, Taylor J, Bao Y, George KS, Grenfell
BT, Salzberg SL, Fraser CM, Lipman DJ, Taubenberger JK: Whole-
genome analysis of human influenza A virus reveals multiple
persistent lineages and reassortment among recent H3N2
viruses. PLoS Biol 2005, 3(9e300 [ />nal.pbio.0030300].
33. Mollison D: Epidemic models: their structure and relation to data Cam-
bridge University Press; 1995.