Báo cáo y học: " Origin of the blood hyperserotonemia of autism Skirmantas Janušonis" pps
Bạn đang xem bản rút gọn của tài liệu. Xem và tải ngay bản đầy đủ của tài liệu tại đây (901.2 KB, 16 trang )
BioMed Central
Page 1 of 16
(page number not for citation purposes)
Theoretical Biology and Medical
Modelling
Open Access
Research
Origin of the blood hyperserotonemia of autism
Skirmantas Janušonis
Address: Department of Psychology, University of California, Santa Barbara, CA 93106-9660, USA
Email: Skirmantas Janušonis -
Abstract
Background: Research in the last fifty years has shown that many autistic individuals have elevated
serotonin (5-hydroxytryptamine, 5-HT) levels in blood platelets. This phenomenon, known as the
platelet hyperserotonemia of autism, is considered to be one of the most well-replicated findings
in biological psychiatry. Its replicability suggests that many of the genes involved in autism affect a
small number of biological networks. These networks may also play a role in the early development
of the autistic brain.
Results: We developed an equation that allows calculation of platelet 5-HT concentration as a
function of measurable biological parameters. It also provides information about the sensitivity of
platelet 5-HT levels to each of the parameters and their interactions.
Conclusion: The model yields platelet 5-HT concentrations that are consistent with values
reported in experimental studies. If the parameters are considered independent, the model
predicts that platelet 5-HT levels should be sensitive to changes in the platelet 5-HT uptake rate
constant, the proportion of free 5-HT cleared in the liver and lungs, the gut 5-HT production rate
and its regulation, and the volume of the gut wall. Linear and non-linear interactions among these
and other parameters are specified in the equation, which may facilitate the design and
interpretation of experimental studies.
Background
The blood hyperserotonemia of autism is an increase in
the serotonin (5-hydroxytryptamine, 5-HT) levels in the
blood platelets of a large subset of autistic individuals. It
is usually reported as mean platelet 5-HT elevations of
25% to 50% in representative autistic groups [1] that
almost invariably contain hyperserotonemic individuals.
Since the first report in 1961 [2], this phenomenon has
been described in autistic individuals of diverse ethnic
backgrounds by many groups of researchers [3-9]. Despite
the fact that the hyperserotonemia of autism is considered
to be one of the most-well replicated findings in biologi-
cal psychiatry [1], its biological causes remain poorly
understood.
Blood platelets themselves do not synthesize 5-HT. Dur-
ing their life span of several days, they actively take up 5-
HT from the blood plasma using a molecular pump, the
5-HT transporter (SERT). The plasma 5-HT originates in
the gut, where most of it is synthesized by enterochroma-
ffin cells (EC) of the gut mucosa [10]. Some of the gut 5-
HT is used locally as a neurotransmitter of the enteric
nervous system and it also can be taken up into gut cells
that express SERT and low-affinity serotonin transporters
[11,12]. Some of the gut 5-HT diffuses into the general
blood circulation, where most of it is rapidly cleared by
the liver and the lungs [13,14]. Free 5-HT in the blood
plasma becomes available to platelets. The circulation of
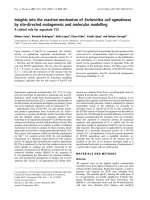
peripheral 5-HT is summarized in Figure 1.
Published: 22 May 2008
Theoretical Biology and Medical Modelling 2008, 5:10 doi:10.1186/1742-4682-5-10
Received: 25 February 2008
Accepted: 22 May 2008
This article is available from: />© 2008 Janušonis; licensee BioMed Central Ltd.
This is an Open Access article distributed under the terms of the Creative Commons Attribution License ( />),
which permits unrestricted use, distribution, and reproduction in any medium, provided the original work is properly cited.
Theoretical Biology and Medical Modelling 2008, 5:10 />Page 2 of 16
(page number not for citation purposes)
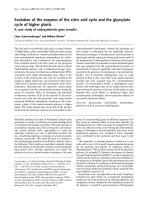
The peripheral 5-HT circulationFigure 1
The peripheral 5-HT circulation. The thick black arrow represents the influx of 5-HT from the gut and the red arrows
represent the clearance of 5-HT. For explanation of the variables, see the text, Table 1, and Appendix 2.
LIVER
GUT
LUNGS
F
zgF
db[G-F/(σQtot)]
θh
θp
ΔNng
Δt
ΔNng
Δt
ΔN
ng
Δt
zngF
ΔNng
Δt
k = 0k = K-1
NG-system
G-system
Q
tot
Figure 1
θh(zgF + db[G-F/(σQtot)]) + zngθvF
zngθvF
Theoretical Biology and Medical Modelling 2008, 5:10 />Page 3 of 16
(page number not for citation purposes)
The blood-brain barrier is virtually impermeable to 5-HT
and, therefore, free 5-HT in the blood plasma is unlikely
to reach cerebrospinal fluid or brain parenchyma. How-
ever, biological factors that cause the platelet hypersero-
tonemia may play a role in the early development of the
autistic brain, since the brain and peripheral organs
express many of the same neurotransmitter receptors and
transporters. The consistency of the platelet hypersero-
tonemia suggests that many of the genes implicated in
autism [15,16] may control a small number of functional
networks. Since blood platelets are short-lived, the altered
processes may remain active in the periphery years after
the brain has formed. In contrast, most of the brain devel-
opmental processes are over by the time an individual is
formally diagnosed with autism. SERT is expressed by
brain neurons and blood platelets [17] and its altered
function may both affect brain development and lead to
abnormal 5-HT levels in platelets. To date, most experi-
mental studies have focused on SERT polymorphisms as a
likely cause of the platelet hyperserotonemia, but the
results have been inconclusive. While SERT polymorphic
variants may partially determine platelet 5-HT uptake
rates [18] or even platelet 5-HT levels [19], these polymor-
phisms, alone, are unlikely to cause the platelet hyperser-
otonemia of autism [18,20]. Some evidence suggests that
the platelet hyperserotonemia may be caused by altered 5-
HT synthesis or release in the gut [21-23] or by interac-
tions among several genes [24-26].
To date, most research into the causes of the platelet
hyperserotonemia has focused on a specific part of the
peripheral 5-HT system. However, this system is cyclic by
nature and does not allow easy intuitive interpretation. It
is not clear what parameters and their interactions platelet
5-HT levels are likely to be sensitive to, as well as what
parameters should be controlled for when others are var-
ied. For instance, an increase in SERT activity may increase
platelet 5-HT uptake, but it may also increase 5-HT uptake
in the gut and lungs and, consequently, may reduce the
amount of free 5-HT in the blood plasma.
Here, we develop an equation that yields platelet 5-HT
levels that are consistent with published experimental
data. The equation also provides information about the
sensitivity of platelet 5-HT levels to a set of biological
parameters and their interactions.
Results and Discussion
Platelets take up 5-HT at low plasma 5-HT concentrations
Suppose blood platelets are produced at a constant rate,
their half-life is t
1/2
, and we are interested in the steady
state when the total number of platelets (N
tot
) remains
constant. Then the number of the platelets whose age
ranges from x ≥ 0 to x + dx is given by (Appendix 1)
where
τ
= t
1/2
/ln 2 ≈ 1.44t
1/2
.
The 5-HT uptake rate of an "average" platelet at time t can
be defined as follows:
where u
i
(t) is the 5-HT uptake rate (mol/min) of platelet i
at time t.
At any two times t
1
and t
2
(t
1
≠ t
2
), at least some of the indi-
vidual platelets in the circulation will be physically differ-
ent, because platelets are constantly removed from the
circulation and replaced by new platelets. Also, at least
some individual platelets will be routed by the circulation
to different blood vessels, which may have different con-
centrations of free 5-HT in the blood plasma. Since the
platelet uptake rate depends on the 5-HT concentration in
the surrounding plasma, generally, u
i
(t
1
) ≠ u
i
(t
2
). How-
ever, the 5-HT uptake and distribution of platelets appear
to be little affected by their age or by how much 5-HT they
have already accumulated [14,27]. Also, the numbers of
platelets in blood vessels are very large and can be consid-
ered constant. Therefore, should be immune to these
replacements and permutations, and the time-depend-
ence of can be dropped:
The total amount of 5-HT that has been taken up by the
subpopulation of platelets whose age ranges from x to x +
dx is given by (Appendix 1)
If the total volume of the circulating blood is Ω
b
and the
numerical concentration of platelets is C
p
= N
tot
/Ω
b
, the
concentration of platelet 5-HT is
It follows that
dN x
N
tot
edx
x
() ,
/
=
−
τ
τ
(1)
ut
N
tot
ut
i
i
N
tot
() (),≡
=
∑
1
1
(2)
ut()
ut()
uut≡ ().
(3)
dU x
N
tot
e
x
ux dx()
/
().=
−
τ
τ
(4)
C
b
dU x
b
N
tot
euxdxCu
s
x
p
== =
−
∞∞
∫∫
11
00
ΩΩ
() ( ) .
/
τ
τ
τ
(5)
Theoretical Biology and Medical Modelling 2008, 5:10 />Page 4 of 16
(page number not for citation purposes)
In normal humans, C
s
/C
p
has been experimentally esti-
mated to be around 3.58 · 10
-18
mol/platelet [7]. The half-
life of human platelets is approximately 5 days [28,29], so
τ
≈ 1.44t
1/2
= 1.04 · 10
4
min. Plugging these values into
Eq. (6) yields = 3.44 · 10
-22
mol/min, or an "average"
platelet takes up around 3.5 molecules of 5-HT every sec-
ond.
What concentration of free 5-HT in the blood plasma cor-
responds to this uptake rate? Since platelet 5-HT uptake
obeys Michaelis-Menten kinetics [14,18],
where V
max
is the maximal 5-HT uptake rate of one plate-
let, K
m
is the Michaelis-Menten constant, and c
i
is the local
concentration of free 5-HT surrounding platelet i.
If the concentration of free 5-HT were the same in all
blood vessels (c
i
≡ C
f
), we would obtain
and
However, in some blood vessels (such as the ones leaving
the gut) the concentration of free 5-HT may be considera-
bly higher than in others. We can define
and rely on the evidence that c
i
<< K
m
[14,18,30]. Then
and it follows that
In normal humans, V
max
≈ 1.26 · 10
-18
mol/(min · plate-
let) and K
m
≈ 0.60 · 10
-6
mol/L (these values were
obtained by weighting the medians of each of the three
groups of [18] by the number of subjects in the study).
Plugging these values and the obtained into Eq. (12)
yields C
f
≈ = 0.16 · 10
-9
mol/L = 0.16 nM.
Experimental measurement of free 5-HT in the blood
plasma poses serious challenges. It is not uncommon to
report concentration values of free 5-HT that are a few
orders of magnitude higher than those obtained in care-
fully designed studies (for discussion, see [14,30,31]). The
theoretically calculated value (0.16 nM) is on the same
order as an accurate experimental estimate of free 5-HT in
the distal venous plasma (0.77 nM) obtained by Beck et
al. [30]. These authors note that new experimental meth-
odologies may further reduce their estimate [30]. Taken
together, these theoretical and experimental results sug-
gest that virtually all platelets take up 5-HT at very low free
5-HT concentrations, after most of the 5-HT released by
the gut has been cleared from the circulation by the liver
and the lungs.
Gut 5-HT release rate (R)
We denote the gut 5-HT release rate R, where R is
expressed per unit volume of the gut wall and includes all
5-HT released by the gut. Specifically, R includes the 5-HT
that (i) is taken back up into gut cells, (ii) remains in the
extracellular space of the gut wall, and (iii) diffuses into
the blood circulation. If the gut 5-HT release rate fluctu-
ates but homeostatic mechanisms keep it near some con-
stant value R
00
> 0, then we can write
where t is time and
λ
> 0 is the time constant of the process
(the larger is the
λ
, the slower is the return to R
00
). We next
consider a more general scenario, where the gut 5-HT
release rate is controlled by the actual state of the periph-
eral 5-HT system.
First, we consider a local mechanism that monitors the
extracellular 5-HT concentration in the gut wall. The
actual sensitivity of the gut 5-HT release rate to extracellu-
lar 5-HT levels is not well understood. In the brain raphe
nuclei, 5-HT release does not appear to be controlled by
5-HT1A autoreceptors unless extracellular 5-HT levels
become excessive [32]. The gut expresses 5-HT1A, 5-HT3,
and 5-HT4 receptors [11], but these receptors may not be
activated by the normal levels of endogenous extracellular
5-HT in the gut wall [33]. In SERT-deficient mice, 5-HT
synthesis appears to be increased by around 50%, but the
expression and activity of tryptophan hydroxylases 1 and
u
C
s
C
p
=
τ
.
(6)
u
u
V
max
c
i
K
m
c
i
i
=
+
,
(7)
u
V
max
C
f
K
m
C
f
=
+
(8)
C
uK
m
V
max
u
f
=
−
.
(9)
c
N
tot
c
i
i
N
tot
≡
=
∑
1
1
(10)
u
V
max
K
m
c≈
(11)
c
K
m
V
max
u
K
m
C
s
V
max
C
p
≈=
τ
.
(12)
u
c
λ
dR
dt
RR=−
00
,
(13)
Theoretical Biology and Medical Modelling 2008, 5:10 />Page 5 of 16
(page number not for citation purposes)
2 are not altered [34]. In SERT-deficient rats, the expres-
sion and activity of tryptophan hydroxylase 2 are also
unaltered in the brain, even though the extracellular 5-HT
levels in the hippocampus are elevated 9-fold [35]. From
a systems-control perspective, the reported insensitivity of
5-HT synthesis to extracellular 5-HT levels may be due to
the inherent ambiguity of the signal. In fact, high extracel-
lular 5-HT levels may signal both overproduction of 5-HT
by tryptophan hydroxylase and an excessive loss of presy-
naptic 5-HT due to its reduced uptake by SERT. If the
former is the case, the activity of trypotophan hydroxylase
should be decreased; if the latter is the case, it should be
increased.
Alternatively, platelet 5-HT levels can be regulated by glo-
bal peripheral mechanisms. Since platelets take up 5-HT
over their life span, their 5-HT levels will change only if an
alteration of the peripheral 5-HT system is sustained over
a considerable period of time. Since platelets act as sys-
temic integrators, we can assume that, formally, the gut 5-
HT release rate is a function of the platelet 5-HT concen-
tration. In essence, we simply assume that the gut 5-HT
release is controlled by global, systemic changes in the
peripheral serotonin system. In biological reality, this
relationship would be mediated by latent variables,
because platelet 5-HT is inaccessible to the gut.
If the gut release rate is controlled by any of the discussed
mechanisms,
where G is the extracellular 5-HT concentration in the gut
wall, P is the platelet 5-HT concentration (mol/platelet),
and f(., .) is a differentiable function.
Linearization of f(G, P) in the neighborhood of "normal"
values of G and P (denoted G
0
and P
0
, respectively) yields
f(G, P) = f(G
0
, P
0
) +
α
(G
0
- G) +
β
(P
0
- P), (15)
where and
.
By denoting R
0
= R
00
+ f (G
0
, P
0
) we obtain
Note that Eq. (13) is a special case of Eq. (16) when nei-
ther G nor P controls the gut 5-HT release rate (i.e., when
α
=
β
= 0).
Concentration of extracellular 5-HT in the gut wall (G)
The concentration of extracellular 5-HT in the gut wall
increases due to synthesis and release of 5-HT by EC cells
and neurons of the gut. It decreases due to two processes:
(i) local 5-HT uptake by SERT (and perhaps by other, low-
affinity transporters [12,35]) and (ii) 5-HT diffusion into
gut blood capillaries. Suppose that the blood that has
exited the heart through the aorta at time t reaches the gut
at time t + s (s > 0). The decrease rate of extracellular 5-HT
concentration in the gut wall due to the diffusion into
blood capillaries is given, according to Fick's First Law, by
where G(t + s) is the concentration of extracellular 5-HT in
the gut wall at time t + s, D is the 5-HT diffusion coefficient
across the blood capillary wall, S is the total surface area
of the gut blood capillaries, w is the thickness of the cap-
illary wall, Ω
g
is the effective extracellular volume of the
gut wall, Q
tot
is the total cardiac output, z
g
is the propor-
tion of the total cardiac output routed to the gut and/or
the liver, F(t) is the flow of free 5-HT in the aorta at time
t,
σ
is the proportion of blood volume that is not occupied
by cells (approximated well by 1 - Ht, where Ht is the
hematocrit), and d
g
≡ DS/(wΩ
g
). Note that z
g
F (t)/(
σ
z
g
Q
tot
)
is the concentration of free 5-HT in the blood plasma that
arrives in the gut at time t + s (Fig. 1).
If all three discussed processes are taken into considera-
tion,
where k
g
is the 5-HT uptake rate constant in the gut wall.
This constant is likely to be a function of SERT activity (
γ
),
i.e., k
g
≡ k
g
(
γ
). Importantly, k
g
(0) is not necessarily zero,
since 5-HT uptake in the gut may be mediated by low-
affinity 5-HT transporters, at least in the absence of SERT
[12,35].
Flow of free 5-HT in the aorta (F)
We next consider the flow (mol/min) of free 5-HT in the
blood circulation from the time blood exits the heart
through the aorta (at time t) to the time it returns to the
aorta after one circulation cycle (at time t + T; Fig. 1). Since
blood transit times from organ to organ are relatively
short (seconds), we will ignore 5-HT diffusion parallel to
the flow. After the blood leaves the heart, a proportion (z
g
)
of the total cardiac output is routed to the gut and/or the
liver. On arrival in the gut at time t + s (0 <s <T), the blood
is replenished with new 5-HT synthesized in the gut wall.
λ
dR
dt
RRfGP=−+
00
(,),
(14)
α
≡−∂ ∂ ≥fG
GP
/
(,)
00
0
β
≡−∂ ∂ ≥fP
GP
/
(,)
00
0
λαβ
dR
dt
RR GG PP=−+ −+ −
00 0
()().
(16)
DS
w
g
Gt s
z
g
Ft
z
g
Q
tot
d
g
Gt s
Ft
Q
tot
Ω
()
()
()
()
+−
⎡
⎣
⎢
⎢
⎤
⎦
⎥
⎥
=+−
⎡
⎣
⎢
⎤
⎦
⎥
σσ
,,
(17)
dG
dt
Rt k Gt d Gt
Ft s
Q
tot
gg
=− − −
−
⎡
⎣
⎢
⎤
⎦
⎥
() () ()
()
,
σ
(18)
Theoretical Biology and Medical Modelling 2008, 5:10 />Page 6 of 16
(page number not for citation purposes)
According to Fick's First Law, this flow of 5-HT into the
blood is
where all parameters and G(t + s) are defined as in Eq.
(17), F(t) is the flow of free 5-HT in the aorta, and d
b
≡ DS/
w (note that d
b
/d
g
= Ω
g
).
After the 5-HT flow leaves the gut, it passes through the
liver that removes a large proportion (1 -
θ
h
) of free 5-HT
[13,14]. After exiting the liver, the 5-HT flow is joined by
the 5-HT flow that did not enter the gut and/or the liver
and the merged flow passes through the lungs that remove
another large proportion (1 -
θ
p
) of free 5-HT [13,14].
Experimental results suggest that
θ
h
≈ 0.25 and
θ
p
≈ 0.08
[13]. Since the lungs express SERT [36],
θ
p
may be consid-
ered to be a function of SERT activity, i.e.,
θ
p
≡
θ
p
(
γ
). It is
likely that
θ
p
(0)≠ 0, since no obvious toxic 5-HT effects are
seen in mice that lack SERT [12].
Platelet 5-HT uptake is a slow process compared with the
blood circulation through the gut, liver, and lungs. There-
fore, in this circulation, platelet uptake should have a neg-
ligible effect on free 5-HT levels in the blood plasma
[13,14]. However, platelets spend a considerable propor-
tion of the circulation cycle in the vascular beds of other
organs (the "non-gut" system of Fig. 1), where platelet 5-
HT uptake may have an impact on the already low levels
of free 5-HT.
Taking all these considerations together, the 5-HT flow
that leaves the heart after one full circulation cycle is
where 1 -
θ
v
is the proportion of free 5-HT cleared by the
platelets in the "non-gut" system (Fig. 1) and z
ng
= 1 - z
g
.
Platelet 5-HT concentration at the steady state ( )
Denote the steady-state flow of free 5-HT in the aorta.
The system is in its steady state if the following is true: dR/
dt = 0, dG/dt = 0, F(t) = F(t - T) = , and if F(t - s) ≈ F(t - s
- x) = for all x > 0 for which N
tot
exp(-x/
τ
) Ŭ 1, where 0
<s <T (for the last condition, see Eqs. (36) and (47) in
Appendix 2).
At the steady state, the platelet 5-HT concentration is
(Appendix 2)
where k
p
≡ k
p
(
γ
) is the 5-HT uptake rate constant of one
platelet. In mice lacking SERT, the amount of 5-HT stored
in blood platelets in virtually zero [12], suggesting that
k
p
(0) = 0.
Solving Eqs. (16), (18), (20), and (21) at the steady state
yields
where
S
1
= R
0
+
α
G
0
(23)
and
where for brevity we defined
and
K
g
≡ k
g
+
α
.(26)
In the derivation, we used the relationship d
g
= d
b
/Ω
g
.
The values of the parameters can be approximated based
on published experimental results (Table 1). Since little is
known about the regulation of 5-HT release from the gut,
we can initially assume that
α
=
β
= 0 (in this case, platelet
5-HT concentration is independent of G
0
and P
0
). Plug-
ging the parameter values into Eq. (22) yields = 2.40 ·
10
-18
mol/platelet, or 4.23 · 10
-16
g/platelet. Since the
platelet concentration in the blood has been estimated to
be 4.28 · 10
8
platelets/mL [7], the obtained value is equiv-
alent to the whole-blood 5-HT concentration of 1.02
μ
M
or 0.18
μ
g/mL. These values are well within the range of
normal 5-HT concentrations obtained in experimental
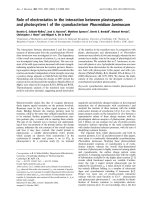
studies (Fig. 2). Platelet 5-HT concentrations when
α
> 0
are plotted in Fig. 2.
DS
w
Gt s
z
g
Ft
z
g
Q
tot
dGts
Ft
Q
tot
b
()
()
()
()
,+−
⎡
⎣
⎢
⎢
⎤
⎦
⎥
⎥
=+−
⎡
⎣
⎢
⎤
⎦
⎥
σσ
(19)
Ft T z Ft d Gt s
Ft
Q
tot
zFt
gb hvng
() () ()
()
()+= + +−
⎡
⎣
⎢
⎤
⎦
⎥
⎛
⎝
⎜
⎜
⎞
⎠
⎟
⎟
+
σ
θθ
⎡⎡
⎣
⎢
⎢
⎤
⎦
⎥
⎥
θ
p
,
(20)
ˆ
P
ˆ
F
ˆ
F
ˆ
F
ˆ
ˆ
,P
k
p
F
Q
tot
=
τ
σ
(21)
ˆ
,P
SP
S
=
+
+
10
2
β
β
(22)
S
k
p
Q
K
g
d
bg
K
tot g2
11
=+
⎛
⎝
⎜
⎜
⎞
⎠
⎟
⎟
+
⎡
⎣
⎢
⎢
⎤
⎦
⎥
⎥
τ
σ
Θ
Ω
,
(24)
Θ≡
−−1 z
ghp
z
ng v p
hp
θθ θθ
θθ
(25)
ˆ
P
Theoretical Biology and Medical Modelling 2008, 5:10 />Page 7 of 16
(page number not for citation purposes)
Table 1: Parameter values
Parameter Value Units Source Note
(plt = platelet)
MW (5-HT) 176.22 g mol
-1
1
D 6.00 · 10
-8
m
2
min
-1
[48] 2
d
b
6.00 m
3
min
-1
d
b
= DS/w 3
d
g
5.82 · 10
3
min
-1
d
g
= d
b
/Ω
g
4
G
0
1.00 · 10
-6
mol m
-3
Table 1 of [32] 5
k
g
4.00 min
-1
Fig. 4A of [35] 6
k
p
2.12 · 10
-15
m
3
min
-1
plt
-1
[18] 7
R
0
1.65 · 10
-5
mol m
-3
min
-1
[14] 8
P
0
3.58 · 10
-18
mol plt
-1
[7] 9
S 1.00 · 10
2
m
2
Table 8.3 of [48] 10
Q
tot
5.60 · 10
-3
m
3
min
-1
[14] 11
t
1/2
7.20 · 10
3
min [28, 29] 12
w 1.00 · 10
-6
m Table 8.2 of [48] 13
z
g
0.27 Fig. 1 of [14] 14
z
ng
0.73 z
ng
= 1 - z
g
15
α
≥ 0min
-1
See note 16
β
≥ 0plt m
-3
min
-1
See note 17
θ
h
0.25 [13] 18
θ
p
0.08 [13] 19
θ
v
0.50 [13] 20
ρ
9.70 · 10
4
m
-1
ρ
= S/Ω
g
21
σ
0.56 See note 22
τ
1.04 · 10
4
min
τ
= 1.44t
1/2
23
Ω
b
5.40 · 10
-3
m
3
Table 8.3 of [48] 24
Ω
g
1.03 · 10
-3
m
3
[49] 25
1. The molecular weight of 5-HT (C
10
H
12
N
2
O).
2. The coefficient of 5-HT diffusion across the gut capillary wall. In liquids, the diffusion coefficient is on the order of 10
-5
cm
2
/s [48].
3. The rate constant of 5-HT influx into the blood due to 5-HT diffusion from the gut.
4. The rate constant of 5-HT loss in the gut due to 5-HT diffusion into the blood.
5. The homeostatic set point of the extracellular 5-HT concentration in the gut mucosa (irrelevant if
α
= 0). The concentration of extracellular 5-HT in the
gut wall is unknown. We used an estimate based on extracellular 5-HT levels in the rat raphe nuclei [32]. Both the raphe nuclei and the gut mucosa
synthesize 5-HT and express some of the same 5-HT receptors, such as the 5-HT1A receptor [32, 39].
6. The 5-HT uptake rate constant of the gut mucosa is unknown. We used an estimate based on measurements of 5-HT uptake in the normal (SERT +/+)
rat brain [35]. The value of V
max
was assumed to be 4 pmol/min per milligram of protein [35], the protein content in the brain was assumed to be 10% (w/w)
[50], and the specific weight of fresh brain tissue was 1 g/mL [51]. This yielded V
max
= 4 · 10
-4
mol/min per cubic meter of fresh tissue. The value of K
m
was
assumed to be 100 nmol/L [35]. Since K
m
is much larger than the extracellular 5-HT concentration [32], k
g
was calculated as V
max
/K
m
. (As this article was
being prepared for publication, Gill et al. [52] published a detailed report on the expression and kinetics of the human gut SERT.)
7. The 5-HT uptake rate constant of one platelet. The V
max
and and K
m
values were obtained by weighting the medians of each of the three groups of [18] by
the number of subjects in the study. Since K
m
is much larger than the concentration of free 5-HT in the blood plasma [14], k
p
was calculated as V
max
/K
m
.
8. The gut 5-HT release rate that is independent of both the extracellular 5-HT concentration in the gut wall and the platelet 5-HT concentration. The gut
5-HT production estimate of 3000 ng/min was used [14]. In order to obtain the 5-HT release rate per unit volume of the gut wall (R
0
), this estimate was
divided by Ω
g
and further assumed to be independent of Ω
g
.
9. The homeostatic set point for the platelet 5-HT concentration (irrelevant if
β
= 0).
10. The total surface area of blood capillaries in the gut was assumed to be on the order of 10
8
mm
2
, since the total surface of the body capillaries has been
estimated to be 2.98 · 10
8
mm
2
[48].
11. The total cardiac output.
12. The half-life of blood platelets.
13. The wall thickness of blood capillaries in the gut.
14. The proportion of the total cardiac output routed to the gut and/or the liver (Fig. 1).
15. The proportion of the total cardiac output not routed to the gut and/or the liver (Fig. 1).
16. The gain of the regulation of the gut 5-HT release rate that is controlled by extracellular 5-HT concentration in the gut wall.
17. The gain of the regulation of the gut 5-HT release rate that is controlled by platelet 5-HT concentration.
18. One minus the proportion of free 5-HT in the blood plasma that is removed by the liver in one cycle of blood circulation. Based on an estimate obtained
in the dog [13].
19. One minus the proportion of free 5-HT in the blood plasma that is removed by the lungs in one cycle of blood circulation. Based on an estimate
obtained in the dog [13].
20. One minus the proportion of free 5-HT in the blood plasma that is removed in the "non-gut" (NG) system (Fig. 1) in one cycle of blood circulation.
Based on estimates obtained in the dog [13].
21. The surface area of blood capillaries per unit volume of the gut mucosa.
22. The proportion of blood volume not occupied by cells. It is approximated well by 1 - Ht, where Ht = 0.44 is the hematocrit.
23. The time constant of platelet removal from the blood circulation.
24. The total volume of the circulating blood.
25. The total volume of the gut wall. Since EC cells are distributed from the stomach through the colon [10], the gut was assumed to be a cylinder with a
length of 8 m and a diameter of 4 cm. The gut mucosa contains both the main source of peripheral 5-HT (the EC cells) and a dense meshwork of blood
capillaries [53]. Therefore, the effective width of the gut wall was considered to be equal to the average length of the villi of the mucosa, or around 1 mm
[49].
Theoretical Biology and Medical Modelling 2008, 5:10 />Page 8 of 16
(page number not for citation purposes)
Sensitivity of platelet 5-HT to parameters
Equation (22) represents the minimal set of relationships
that have to be taken into account in experimental studies.
It provides information about the sensitivity of platelet 5-
HT levels to biological parameters and their interactions,
some of which have not been considered or controlled for
in experimental approaches. Here, we limit sensitivity
analysis to the simplest case when parameters in Eq. (22)
can be considered independent.
First, we calculate the local rate of change in with
respect to each of the parameters, i.e., we evaluate the par-
tial derivatives of with respect to each of the parameters
at the parameter values given in Table 1 (see Appendix 3
for details). We express this rate of change as the percent-
age-wise change in if a parameter increases by 10%
with respect to its normal value (assuming the relation-
ship can be approximated as linear). The results of these
calculations are given in Table 2.
Second, we inverse the problem and calculate the percent-
age-wise change in each of the parameters needed to reach
a 25% or 50% increase in platelet 5-HT concentration.
ˆ
P
ˆ
P
ˆ
P
Platelet 5-HT levelsFigure 2
Platelet 5-HT levels. Normal platelet 5-HT concentrations reported in published reports (a [6], b [19], c [7], d [8], e [9]; the
circles are the means and the bars indicate the range), compared with the theoretical values obtained with
α
= 0 (square) and
α
> 0. The values of the other parameters are given in Table 1 and
β
= 0. The theoretical platelet 5-HT concentrations reach a
limit when
α
is large (inset).
P
P
D
Table 2: Sensitivity of platelet 5-HT concentration to changes in
parameters
Parameter, Δ = +10% Platelet 5-HT, Δ% Platelet 5-HT, Δ%
α
= 0 min
-1
α
= 20 min
-1
β
= 0
β
= 0
d
b
6.7 · 10
-3
3.5 · 10
-2
G
0
05.5
k
g
-0.27 -0.24
k
p
10.0 10.0
R
0
10.0 4.5
P
0
00
Q
tot
-9.7 -8.6
α
04.3
θ
h
9.8 8.6
θ
v
0.29 0.26
θ
p
10.1 8.9
σ
-9.7 -8.6
τ
10.0 10.0
Ω
g
(S constant) 9.7 8.6
Ω
g
(
ρ
constant) 9.7 8.6
The change in the normal platelet 5-HT concentration (%) if a
parameter is increased by 10% with respect to its normal value given
in Table 1. The relationship between the parameter and the platelet
concentration is assumed to be linear for this small change (see
Appendix 3 for details). All the other parameters are held constant
at the values given in Table 1.
Theoretical Biology and Medical Modelling 2008, 5:10 />Page 9 of 16
(page number not for citation purposes)
These increases represent the typical range of elevation in
platelet 5-HT levels in autism [1]. The required changes of
the parameters are calculated using Eq. (22) without line-
arization. The results of these calculations are given in
Table 3.
Tables 2, 3 indicate that platelet 5-HT concentration is
highly sensitive to the platelet 5-HT uptake rate constant
(k
p
), the baseline gut 5-HT release rate (R
0
), the propor-
tion of 5-HT cleared in the liver and lungs (
θ
h
,
θ
p
), and the
volume of the gut wall (Ω
g
). Some experimental evidence
suggests that k
p
is altered in autistic individuals [37,38].
The analysis also suggests that the hyperserotonemia of
autism may be caused by altered extracellular 5-HT-
dependent regulation of the gut release rate (
α
). We have
recently shown that mice lacking the 5-HT1A receptor,
expressed in the gut [39], develop an autistic-like blood
hyperserotonemia [23], which may be caused by altered
regulation of the gut 5-HT release rate. Another poten-
tially important 5-HT receptor is the 5-HT4 receptor that
is expressed throughout the gastrointestinal tract in
humans [40]. The analysis also shows that the 5-HT
uptake rate constant in the gut wall (k
g
) and the rate con-
stant of 5-HT diffusion into the blood (d
b
) should have lit-
tle effect on platelet 5-HT levels. A recent study has found
no link between platelet hyperserotonemia and increased
intestinal permeability in children with pervasive devel-
opmental disorders [41].
In the analysis we assumed that each parameter can be
manipulated independently of the other parameters. In
particular, this assumes that Ω
g
can be changed independ-
ently of d
b
, which is a function of S, the capillary surface
area of the gut. However, increasing Ω
g
is likely to increase
S. To make Ω
g
and d
b
truly independent, it is sufficient to
make an assumption that a unit volume of the gut wall
contains a constant surface area of blood capillaries, i.e.,
S/Ω
g
≡
ρ
= const. Since d
b
= DS/w, this yields
After this correction, the sensitivity of platelet 5-HT con-
centration to the gut volume remains virtually unchanged
(Tables 2, 3).
Care should be exercised in manipulating the parameters
k
p
, k
g
,
θ
p
, and
θ
v
, which may not be independent. All of
them may be determined, at least in part, by SERT activity
(
γ
). Given the lack of experimental data regarding their
actual relationships, two extreme scenarios can be consid-
ered. As assumed in the sensitivity analysis, these parame-
ters can be considered to be virtually independent, since
each of them is likely to be determined (in addition to
SERT) by other factors in the platelet, gut, and lungs. Alter-
natively, all four parameters may be functions of only one
variable, γ. In this case, platelet 5-HT levels may increase
or decrease with different γ values, even if each of the func-
tions were linear. This behavior of as a function of
γ
is
important to consider in SERT polymorphism studies. The
ambiguity could be resolved if an experimentally-
obtained covariance matrix for k
p
, k
g
,
θ
p
, and
θ
v
were avail-
able. Equation (22) also suggests that platelet 5-HT levels
may be highly sensitive to interactions among the platelet
uptake rate, the proportion of 5-HT cleared in the liver
and lungs, the gut 5-HT release rate, and the volume of the
gut wall. The length of the human gut is known to be
remarkably variable [42], which may underlie some vari-
ability in platelet 5-HT levels. This possibility has not
been investigated experimentally or theoretically. It is
worth noting that 5-HT itself plays important roles in gas-
trulation [43] and morphogenesis [44], and that changes
in gut length may have had a major impact on the evolu-
tion of the human brain [45].
It should be noted that Eq. (22) remains valid if some or
all of the parameters are expressed as functions of new,
independent parameters. In this case, the original param-
S
k
p
Q
tot
g
wK
g
D
K
g2
1
1=+
⎛
⎝
⎜
⎜
⎞
⎠
⎟
⎟
+
⎡
⎣
⎢
⎢
⎤
⎦
⎥
⎥
τ
σ
ρ
Ω
Θ .
(27)
ˆ
P
Table 3: Parameter changes causing 25% and 50% increases in
platelet 5-HT concentration
+ 25% + 25% + 50% + 50%
Parameter Value Δ, % Value Δ, %
d
b
DNE DNE DNE DNE
G
0
DNE DNE DNE DNE
k
g
DNE DNE DNE DNE
k
p
2.65 · 10
-15
25 3.18 · 10
-15
50
R
0
2.06 · 10
-5
25 2.48 · 10
-5
50
P
0
DNE DNE DNE DNE
Q
tot
4.45 · 10
-3
-21 3.68 · 10
-3
-34
α
4.80 - 9.92 -
θ
h
0.31 26 0.38 52
θ
v
DNE DNE DNE DNE
θ
p
0.10 25 0.12 49
σ
0.44 -21 0.37 -34
τ
1.30 · 10
4
25 1.56 · 10
4
50
Ω
g
(S constant) 1.30 · 10
-3
26 1.57 · 10
-3
52
Ω
g
(
ρ
constant) 1.30 · 10
-3
26 1.57 · 10
-3
52
All units are the same as in Table 1. Unless
α
is varied,
α
=
β
= 0.
When
α
is varied, its initial value is zero and
β
= 0. For each
parameter, the other parameters are held constant at the values given
Table 1. DNE = the required value does not exist.
ˆ
P
ˆ
P
ˆ
P
ˆ
P
Theoretical Biology and Medical Modelling 2008, 5:10 />Page 10 of 16
(page number not for citation purposes)
eters may no longer be independent and changing one of
the new parameters may alter more than one of the origi-
nal parameters. For instance, serotonin uptake in blood
platelets has been recently shown to be dependent on
interaction between SERT and integrin
α
IIb
β
3 [46].
Denoting the activity of the integrin y, we can write k
p
=
k
p
(
γ
, y). It is possible that some other parameters in Eq.
(22) can also be expressed as functions of integrin
α
IIb
β
3
activity. All of these functions can be plugged into Eq.
(22), which remains to be correct and now allows calcula-
tion of platelet concentration as a function of integrin
α
IIb
β
3 activity, i.e., = (y). Generally, further theoret-
ical progress will largely depend on understanding the
relationships among the current set parameters. Whether
they can be expressed as functions of a smaller set of
parameters is not known.
Assumptions and caveats
Many of the assumptions in the model are "natural" in the
sense that they are commonly used to explain experimen-
tal results (even though they may not be explicitly stated).
In essence, the model simply formalizes the idea that
peripheral 5-HT is produced in the gut, from which it can
diffuse into the systemic blood circulation, where it can be
transported into blood platelets. The strength of the
model is in its "bird's-eye" view of the entire system. In
particular, the model does not allow focusing on one
parameter without explicitly stating what assumptions are
made regarding the other parameters (some of which may
be equally important in determining platelet 5-HT levels).
For example, studies on SERT polymorphisms often focus
on 5-HT uptake in platelets but do not explain how the
same polymorphisms may affect 5-HT release from the
gut (which also expresses SERT). The model also indicates
which parameters and their interactions platelet 5-HT
concentration is likely to be sensitive to, thus limiting
one's freedom in choosing which factors can fall "outside
the scope" of a study. By its very nature, the platelet hyper-
serotonemia of autism is a systems problem.
Some of the model assumptions are not critical, such as
the assumption that the gut 5-HT release rate can be con-
trolled by extracellular 5-HT in the gut wall or by platelet
5-HT levels. In the model, the absence of control is simply
a special case of this more general scenario, since we can
always set
α
=
β
= 0. If control is present, the assumption
of its linearity (Eq. (16)) is necessary to obtain Eq. (22).
While the Taylor series, used in Eq. (15), guarantees near-
linear behavior of the control mechanisms in the neigh-
borhood of G
0
and P
0
, nothing is said about how far one
can move away from G
0
and P
0
before non-linearities can
no longer be ignored.
The assumption of the independence of the parameters in
Eq. (22) is not necessary and is used here only to simplify
the numerical sensitivity analysis. Some or all of the
parameters may be tightly linked, which does not change
Eq. (22) (but it may change the results obtained in the
sensitivity analysis). Interdependent parameters can be
expressed as functions of other, independent parameters
(or "parameterized" in the mathematical sense), and
these functions can be substituted for the parameters in
Eq. (22). In this case, becomes a function of the new
parameters, as already discussed with regard to integrin
α
IIb
β
3.
The model assumes that the gut 5-HT release rate is con-
stant at the steady-state. Strictly speaking, this assumption
is incorrect, since gut activity exhibits circadian and other
rhythmic behavior. Likewise, platelet counts exhibit nor-
mal fluctuations due to a number of factors, such as exer-
cise, digestion, exposure to ultraviolet light, and others
[47]. However, platelets accumulate 5-HT over days;
therefore, R and N
tot
can be thought of as "baseline" val-
ues.
A potentially important assumption is made regarding the
nature of the 5-HT diffusion from the gut into the blood
circulation. Passive diffusion is assumed, and the value of
the diffusion coefficient (D) is considered to be compara-
ble to typical values observed in liquids. Virtually no
experimental data are available on the exact nature of the
5-HT diffusion (which may be facilitated), and its D value
remains to be determined.
A set of critical assumptions limits relationships between
the parameters (given in Table 1), which are assumed to
be constant in an individual, and the four dynamic varia-
bles (R, G, F, and P), which can evolve in time. While any
parameter can be a function of any other parameters, orig-
inal or new, none of the parameters (original or new) can
be a function of any of the dynamic variables. If this con-
dition is not met, the steady-state platelet 5-HT concentra-
tion will have a form different from Eq. (22). Suppose
extracellular 5-HT in the gut wall controls SERT expres-
sion, or free 5-HT in the blood plasma controls the pro-
portion of internalized SERT in blood platelets [24]. In
these cases, the model may fail because the uptake rate
constants will depend on the dynamic variables, i.e., k
g
=
k
g
(G(t)) and k
p
= k
p
(F (t)). Likewise, Eqs. (16), (18), (20),
and (21) are assumed to exhaust all relationships between
the four dynamic variables. If, for instance, Eq. (16) were
changed to
ˆ
P
ˆ
P
ˆ
P
Theoretical Biology and Medical Modelling 2008, 5:10 />Page 11 of 16
(page number not for citation purposes)
where F
0
and
β
' are constants and
β
' ≠ 0, the solution in
Eq. (22) would no longer be correct.
These critical assumptions define the limits within which
the model should perform reasonably well. New experi-
mental data will be needed to further refine it.
Conclusion
We developed an equation that allows calculation of
platelet 5-HT levels as a function of biological parameters.
While the main goal is to understand the origin of the
hyperserotonemia of autism, the equation can also be
used to calculate platelet 5-HT levels in normal individu-
als and in individuals whose peripheral 5-HT system may
be altered due to conditions unrelated to autism. In the
simplest case when each parameter is manipulated inde-
pendently, theoretical analysis predicts that platelet 5-HT
concentration should be sensitive to changes in the plate-
let 5-HT uptake rate constant, the proportion of free 5-HT
cleared in the liver and lungs, the gut 5-HT production
rate and its regulation, and the volume of the gut wall. The
equation also specifies linear and non-linear interactions
among these and other parameters, some of which may
also play a role in the developing autistic brain.
Methods
All symbolic and numerical calculations were done in
Mathematica 6.0.1 (Wolfram Research, Inc.). For conven-
ience, symbols used in the text are listed in Table 4.
Authors' contributions
SJ developed the model and wrote the manuscript.
Appendix
1. Distribution of blood platelets by age
To derive Eqs. (1) and (4), consider the platelets whose
age is between x = kΔx and x + Δx, where Δx > 0 is small
and k = 0, 1, 2 If the platelet production rate is denoted
r, the total number of platelets produced in the interval x
is rΔx. With each time step Δx, this number decreases by a
factor of q, where q = e
-Δx/
τ
(this follows directly from the
fact that the decay of platelet numbers can be described by
a constant half-life). The number of the remaining plate-
lets after k time steps is given by
ΔN(k) = (rΔx)q
k
. (29)
The total number of platelets currently circulating in the
blood then is
It follows from Eqs. (29) and (30) that
ΔN(k) = N
tot
(1 - q)q
k
= N
tot
(1 - e
-Δx/
τ
)e
-kΔx/
τ
.(31)
Since Δx <<
τ
and
we obtain
Then the platelets whose age is between x and x + Δx have
taken up the following amount of 5-HT:
where is the 5-HT uptake rate of an "average" platelet,
defined in Eqs. (2) and (3). If Δx is allowed to tend to
zero, Eqs. (33) and (34) become Eqs. (1) and (4).
2. Platelet 5-HT concentration
Consider the circulation of peripheral 5-HT (Fig. 1). We
start by dividing the peripheral 5-HT system into the "gut"
system (G-system) and the "non-gut" system (NG-sys-
tem). In the G-system, arterial blood exits the heart
through the aorta, perfuses the gut and/or the liver, joins
the venous blood flow to the heart, passes through the
lungs, and returns to the heart with the oxygenated blood.
In the NG-system, arterial blood exits the heart through
the aorta, perfuses various peripheral organs, and joins
the venous blood flow. In further considerations, the
blood flow rate (measured in m
3
/min) is clearly distin-
guished from the 5-HT flow rate (measured in mol/min).
In fact, if a blood vessel carrying 5-HT-enriched blood is
joined by another blood vessel with virtually no 5-HT in
its blood, the blood flow rate of the merged vessel
increases, but its 5-HT flow rate remains the same. We
intentionally avoid the term "flux", which often denotes
flow rate per unit area.
Denote Q
tot
the total cardiac output, z
ng
the proportion of
the cardiac output that does not pass through the gut and/
or the liver, and N
tot
the total number of blood platelets in
the circulation. Then the blood flow rate of the NG-system
is Q
ng
= z
ng
Q
tot
and at any time the NG-system contains N
ng
λαββ
dR
dt
RR GG PP FF=−+ −+ −+
′
−
00 0 0
()()(),
(28)
NNkrxq
rx
q
tot
k
k
k
===
−
=
∞
=
∞
∑∑
ΔΔ
Δ
() .
00
1
(30)
1
2
2
2
3
6
3
−=−+−
−
e
xx x
xΔ
ΔΔ Δ
/
() ()
,
τ
τ
ττ
…
(32)
Δ
Δ
Δ
Nk
N
tot
x
e
kx
() .
/
≈
−
τ
τ
(33)
ΔΔ Δ
Δ
Δ
Δ
Uk Nk uk x
N
tot
x
eukx
kx
() ()( ) ( ),
/
=≈
−
τ
τ
(34)
u
Theoretical Biology and Medical Modelling 2008, 5:10 />Page 12 of 16
(page number not for citation purposes)
=
η
N
tot
uniformly distributed platelets (0 ≤ z
ng
,
η
≤ 1). If
every platelet passing through the NG-system travels an
approximate linear distance L, we can subdivide L into K
(not necessarily equal) segments, each of which contains
the same number of platelets ΔN
ng
=
η
N
tot
/K (Fig. 1).
Assuming these groups of platelets advance in discrete
time steps, each of them will spend the same constant
time, Δt, in each of the linear segments:
where C
p
is the concentration of platelets in the blood (the
number of platelets per unit volume of blood). Denote
F(t) the flow of free 5-HT that exits the heart through the
aorta at time t. Next, consider ΔN
ng
platelets that exit the
heart through the aorta at time t and enter the NG-system
at time t + s (s > 0). The flow of free 5-HT that enters the
Δ
Δ
t
N
ng
Q
ng
C
p
= ,
(35)
Table 4: Symbols used in the text
Symbol Definition
C
p
Numerical concentration of platelets in the blood
C
s
Amount of 5-HT per platelet (platelet 5-HT concentration)
D Diffusion coefficient of 5-HT diffusion from the gut wall into gut blood capillaries
d
b
Rate constant of 5-HT influx into the blood due to 5-HT diffusion from the gut
d
g
Rate constant of 5-HT loss in the gut due to 5-HT diffusion into the blood
F = F(t) Flow of free 5-HT in the aorta as a function of time
Steady-state flow of free 5-HT in the aorta
G
0
Theoretical concentration of extracellular 5-HT in the gut wall around which the control of gut 5-HT release is near-linear
G = G(t) Extracellular 5-HT concentration in the gut wall as a function of time
Steady-state extracellular 5-HT concentration in the gut wall
k
g
5-HT uptake rate constant in the gut wall
k
p
5-HT uptake rate constant in blood platelets
N
tot
Total number of platelets
R
0
Theoretical, steady-state gut 5-HT release rate achieved when
α
=
β
= 0
R = R(t) Gut 5-HT release rate as a function of time
Steady-state gut 5-HT release rate
P
0
Theoretical 5-HT concentration in blood platelets around which the control of gut 5-HT release is near-linear
Steady-state platelet 5-HT concentration
S Total surface of the blood capillaries in the gut wall
Q
tot
Total cardiac output
t Time
t
1/2
Half-life of blood platelets
5-HT uptake rate of an "average" blood platelet
T Period of blood circulation
w Wall thickness of gut capillaries
z
g
Proportion of cardiac output routed to the gut and/or liver
z
ng
Proportion of cardiac output not routed to the gut and/or liver
α
Gain of the gut 5-HT release control that monitors the extracellular 5-HT concentration in the gut wall
β
Gain of the gut 5-HT release control that monitors the 5-HT concentration in platelets
γ
SERT activity
θ
h
1- proportion of free 5-HT cleared by the liver in one blood circulation cycle (Fig. 1)
θ
p
1- proportion of free 5-HT cleared by the lungs in one blood circulation cycle (Fig. 1)
θ
v
1- proportion of free 5-HT cleared by the vascular beds of the "non-gut" system (Fig. 1)
ρ
Surface area of blood capillaries per unit volume of the gut wall
σ
Proportion of blood volume not occupied by cells
τ
Time constant of the decay of platelet numbers due to their aging
Ω
b
Total volume of circulating blood
Ω
g
Total volume of the gut wall
Only symbols used throughout the text are listed. Their precise definitions are given in the text.
ˆ
F
ˆ
G
ˆ
R
ˆ
P
u
Theoretical Biology and Medical Modelling 2008, 5:10 />Page 13 of 16
(page number not for citation purposes)
NG-system with these platelets at time t + s is z
ng
F (t). The
concentration of free 5-HT around these platelets at time
t + s then is
where
σ
is the proportion of blood volume not occupied
by cells.
If the 5-HT uptake rate constant of one platelet is k
p
, the
total 5-HT amount taken up by the NG-system platelets
from time t
1
to t
1
+ Δt is
Next, consider a time period from t
1
to t
2
= t
1
+ MΔt (M =
2, 3 ). During this time, the total amount of 5-HT taken
up by the NG-system platelets is
If M ≥ K,
where
and
Since blood platelets accumulate 5-HT over a period of
time that is a few orders of magnitude longer than one
blood circulation cycle, we are interested in the situation
when M Ŭ K. Then, if F(t) satisfies mild constraints (e.g.,
does not fluctuate rapidly),
δ
1
and
δ
2
can be dropped and
Eq. (39) becomes
If we allow Δt to tend to zero,
Thus far, we have ignored the fact that blood platelets are
destroyed and replaced by new platelets. However, the
half-life of platelets is only approximately 5 days [28,29].
Consider a past time t
0
(t
0
<t, where t is present time).
Among the presently circulating platelets, the proportion
of the platelets that are older than t - t
0
, according to Eq.
(1), is
Only these platelets were taking up 5-HT when the con-
centration of free 5-HT in the blood entering the NG-sys-
tem at time t
0
was c
ng
(t
0
). Therefore, the total 5-HT
amount accumulated by the NG-system platelets at time t
can be found by weighting the past concentrations of free
5-HT by the proportion of the presently circulating plate-
lets that were taking up 5-HT at these past times:
where U
ng
(t) ≡ U
ng
(-∞, t).
After changing the dummy variable under the integral
sign, we obtain
At a steady state,
for all x for which N
tot
exp(-x/
τ
) Ŭ 1 (i.e., more than one
currently circulating platelet was produced before time t -
x). Then the steady-state amount of 5-HT accumulated by
the platelets of the NG-system is
By analogy, the 5-HT accumulated by the platelets of the
G-system at the steady state is expected to be
cts
z
ng
Ft
Q
ng
Ft
Q
tot
ng
()
()
()
,+= =
σσ
(36)
Utt t
N
tot
K
ct ktkt
ng ng p
k
K
(, ) ( ) .
11 1
0
1
+= −
=
−
∑
ΔΔΔ
η
(37)
Utt
N
tot
K
ct mktkt
ng ng p
k
K
m
M
(, ) ( ( ) ) .
12 1
0
1
0
1
=+−
=
−
=
−
∑∑
η
ΔΔ
(38)
Utt K
N
tot
K
ct mtkt
ng ng p
m
M
(, ) ( ) ( ),
12 1 1 2
0
1
=++−
=
−
∑
η
δδ
ΔΔ
(39)
δ
η
11
1
1
=+−
=
−
∑
k
N
tot
K
ct kKtkt
ng p
k
K
(( ))ΔΔ
(40)
δ
η
21
1
1
=−+ +
=−+
−
∑
() ().kMK
N
tot
K
ct ktkt
ng p
kMK
M
ΔΔ
(41)
Utt kN ct mtt
ng p tot ng
m
M
(, ) ( ) .
12 1
0
1
≈+
=
−
∑
η
ΔΔ
(42)
Utt kN cxdx
ng p tot ng
t
t
(, ) () .
12
1
2
≈
∫
η
(43)
1
0
0
N
tot
N
tot
edxe
tt
x
tt
τ
τ
τ
−
∞
−
−−
∫
=
/
()/
.
(44)
Ut kN cxe dx
ng p tot ng
tx
t
() ( ) ,
()/
≈
−−
−∞
∫
η
τ
(45)
Ut kN ctxe dx
ng p tot ng
x
() ( ) .
/
≈−
−
∞
∫
η
τ
0
(46)
ctx c
ng ng
()−≈
(47)
UkNc
ng p tot ng
≈
ητ
.
(48)
UkNc
giptotgi
i
≈−
∑
μη τ
() ,
,
1
(49)
Theoretical Biology and Medical Modelling 2008, 5:10 />Page 14 of 16
(page number not for citation purposes)
where is the steady-state concentration of free plasma
5-HT in the ith compartment of the G-system,
μ
i
> 0, and
Σ
i
μ
i
= 1. Then
where is the mean of the steady-state concentrations of
free 5-HT in the compartments of the G-system:
We have already shown that virtually all platelets take up
5-HT at very low free 5-HT concentrations. This is not sur-
prising, since the blood that has left the gut reaches the
liver within seconds [13,14], and the liver removes more
than 70% of free 5-HT [13]. Assuming , we
obtain the total amount of 5-HT accumulated by all blood
platelets of the peripheral 5-HT system at the steady state:
The concentration of platelet 5-HT at the steady state then
is
Since, according to Eq. (36),
where is the steady-state flow of free 5-HT in the aorta,
we obtain
For the convenience of notation, we will further consider
Eq. (55) to be exact.
3. Sensitivity of platelet 5-HT levels to changes in
parameters
We investigate the sensitivity of to changes in the
parameters, which for the purpose of this analysis are con-
sidered to be independent. For the convenience of nota-
tion, we denote the set of parameters in Eq. (22) X = (X
1
,
X
2
, X
3
, X
4
, ) ≡ (
α
,
β
, k
g
, k
p
, ), (X) ≡ . Two
approaches are used.
In the first approach, for each parameter X
i
we calculate
the normalized differential
where are the values of the parameters
given in Table 1 and . The obtained values
represent the percentage-wise increase in if a parameter
increases by 10%, assuming the relationship can be
approximated as linear for this small change. The results
are given in Table 2. In the second approach, we assign all,
or all but one of the parameters the values from Table 1:
X = X*, (57)
or
respectively, and then numerically solve the equations
for each X
i
, where q = 1.25 or q = 1.5. The results are given
in Table 3.
Acknowledgements
This study was supported, in part, by the Santa Barbara Cottage Hospital –
UCSB Special Research Award. I thank the anonymous reviewers for their
constructive comments and Vaiva for her support.
References
1. Anderson GM: Genetics of childhood disorders: XLV. Autism,
part 4: Serotonin in autism. J Am Acad Child Adolesc Psychiatry
2002, 41:1513-1516.
2. Schain RJ, Freedman DX: Studies on 5-hydroxyindole metabo-
lism in autistic and other mentally retarded children. J Pediatr
1961, 58:315-320.
3. Hanley HG, Stahl SM, Freedman DX: Hyperserotonemia and
amine metabolites in autistic and retarded children. Arch Gen
Psychiatry 1977, 34:521-531.
4. Anderson GM, Horne WC, Chatterjee D, Cohen DJ: The hyperse-
rotonemia of autism. Ann N Y Acad Sci 1990, 600:331-340.
5. Cook EH: Brief report: Pathophysiology of autism: Neuro-
chemistry. J Autism Dev Disord 1996, 26:221-225.
6. McBride PA, Anderson GM, Hertzig ME, Snow ME, Thompson SM,
Khait VD, Shapiro T, Cohen DJ: Effects of diagnosis, race, and
puberty on platelet serotonin levels in autism and mental
retardation. J Am Acad Child Adolesc Psychiatry 1998, 37:767-776.
7. Mulder EJ, Anderson GM, Kema IP, deBildt A, van Lang ND, den Boer
JA, Minderaa RB: Platelet serotonin levels in pervasive develop-
mental disorders and mental retardation: Diagnostic group
c
gi,
UkNc
gptotg
≈−() ,1
ητ
(50)
c
g
cc
gigi
i
≡
∑
μ
,
.
(51)
cc
gng
≈
ˆ
.UU U kN c
ng g p tot ng
=+≈
τ
(52)
ˆ
ˆ
.P
U
N
tot
k
p
c
ng
=≈
τ
(53)
c
F
Q
tot
ng
=
ˆ
,
σ
(54)
ˆ
F
ˆ
ˆ
.P
k
p
F
Q
tot
≈
τ
σ
(55)
ˆ
P
ˆ
P
ˆ
P
dP X
i
P
X
i
P
P
X
i
ˆ
(, )
ˆ
()
%
ˆ
()
ˆ
%,
X
XX
X
∗
∗
×=
∗
∂
∂
⎛
⎝
⎜
⎜
⎞
⎠
⎟
⎟
×
∗
ΔΔ
100 100
(56)
X
∗∗∗
= ( , , )XX
12
ΔXX
i
=
∗
01
1
.
ˆ
P
XX=≡
∗∗
+
∗
iii
XXX( , , , , ),
11
(58)
qP P
i
ˆ
()
ˆ
()XX
∗∗
=
(59)
Theoretical Biology and Medical Modelling 2008, 5:10 />Page 15 of 16
(page number not for citation purposes)
differences, within-group distribution, and behavioral corre-
lates. J Am Acad Child Adolesc Psychiatry 2004, 43:491-499.
8. Hranilovic D, Bujas-Petkovic Z, Vragovic R, Vuk T, Hock K, Jernej B:
Hyperserotonemia in adults with autistic disorder. J Autism
Dev Disord 2007, 37:1934-1940.
9. Melke J, Goubran Botros H, Chaste P, Betancur C, Nygren G, Anck-
arsater H, Rastam M, Stahlberg O, Gillberg IC, Delorme R, Chabane
N, Mouren-Simeoni MC, Fauchereau F, Durand CM, Chevalier F,
Drouot X, Collet C, Launay JM, Leboyer M, Gillberg C, Bourgeron T:
Abnormal melatonin synthesis in autism spectrum disor-
ders. Mol Psychiatry 2008, 13:90-98.
10. Gershon MD: Review article: Serotonin receptors and trans-
porters – roles in normal and abnormal gastrointestinal
motility. Aliment Pharmacol Ther 2004, 20(Suppl 7):3-14.
11. Gershon MD, Tack J: The serotonin signaling system: From
basic understanding to drug development for functional GI
disorders. Gastroenterology 2007, 132:397-414.
12. Chen JJ, Li Z, Pan H, Murphy DL, Tamir H, Koepsell H, Gershon MD:
Maintenance of serotonin in the intestinal mucosa and gan-
glia of mice that lack the high-affinity serotonin transporter:
Abnormal intestinal motility and the expression of cation
transporters. J Neurosci 2001, 21:6348-6361.
13. Thomas DP, Vane JR: 5-hydroxytryptamine in the circulation of
the dog. Nature 1967, 216:335-338.
14. Anderson GM, Stevenson JM, Cohen DJ: Steady-state model for
plasma free and platelet serotonin in man. Life Sci 1987,
41:1777-1785.
15. Autism-Genome-Project-Consortium: Mapping autism risk loci
using genetic linkage and chromosomal rearrangements.
Nat Genet 2007, 39:319-328.
16. Sebat J, Lakshmi B, Malhotra D, Troge J, Lese-Martin C, Walsh T,
Yamrom B, Yoon S, Krasnitz A, Kendall J, Leotta A, Pai D, Zhang R,
Lee YH, Hicks J, Spence SJ, Lee AT, Puura K, Lehtimaki T, Ledbetter
D, Gregersen PK, Bregman J, Sutcliffe JS, Jobanputra V, Chung W,
Warburton D, King MC, Skuse D, Geschwind DH, Gilliam TC, Ye K,
Wigler M: Strong association of de novo copy number muta-
tions with autism. Science 2007,
316:445-449.
17. Lesch KP, Wolozin BL, Murphy DL, Reiderer P: Primary structure
of the human platelet serotonin uptake site: Identity with
the brain serotonin transporter. J Neurochem 1993,
60:2319-2322.
18. Anderson GM, Gutknecht L, Cohen DJ, Brailly-Tabard S, Cohen JH,
Ferrari P, Roubertoux PL, Tordjman S: Serotonin transporter
promoter variants in autism: Functional effects and relation-
ship to platelet hyperserotonemia. Mol Psychiatry 2002,
7:831-836.
19. Coutinho AM, Oliveira G, Morgadinho T, Fesel C, Macedo TR, Bento
C, Marques C, Ataide A, Miguel T, Borges L, Vicente AM: Variants
of the serotonin transporter gene (SLC6A4) significantly
contribute to hyperserotonemia of autism. Mol Psychiatry 2004,
9:264-271.
20. Persico AM, Pascucci T, Puglisi-Allegra S, Militerni R, Bravaccio C,
Schneider C, Melmed R, Trillo S, Montecchi F, Palermo M, Rabinowitz
D, Reichelt KL, Conciatori M, Marino R, Keller F: Serotonin pro-
moter gene variants do not explain the hyperserotonemia in
autistic children. Mol Psychiatry 2002, 7:795-800.
21. Croonenberghs J, Verkerk R, Scharpe S, Deboutte D, Maes M: Sero-
tonergic disturbances in autistic disorder: L-5-hydroxytryp-
tophan administration to autistic youngsters increases the
blood concentrations of serotonin in patients but not con-
trols. Life Sci 2005, 76:2171-2183.
22. Janušonis S: Statistical distribution of blood serotonin as a pre-
dictor of early autistic brain abnormalities. Theor Biol Med
Model 2005, 2:27.
23. Janušonis S, Anderson GM, Shifrovich I, Rakic P: Ontogeny of brain
and blood serotonin levels in 5-HT1A receptor knockout
mice: Potential relevance to the neurobiology of autism. J
Neurochem 2006, 99:1019-1031.
24. Carneiro AMD, Blakely RD: Serotonin-, protein kinase C-, and
His-5-associated distribution of the platelet serotonin trans-
porter. J Biol Chem 2006, 281:24769-24780.
25. Coutinho AM, Sousa I, Martins M, Correia C, Morgadinho T, Bento
C, Marques C, Ataide A, Miguel TS, Moore JH, Oliveira G, Vicente
AM: Evidence for epistasis between SLC6A4 and ITGB3 in
autism etiology and in the determination of platelet serot-
onin levels. Hum Genet 2007, 121:243-256.
26. Hranilovic D, Novak R, Babic M, Novokmet M, Bujas-Petkovic Z,
Jernej B: Hyperserotonemia in autism: The potential role of 5-
HT-related gene variants. Coll Antropol 2008, 32(Suppl 1):75-80.
27. Mezzano D, Aranda E, Rodriguez S, Foradori A, Lira P: Increase in
density and accumulation of serotonin by human aging plate-
lets. Am J Hematol 1984, 17:11-21.
28. Heyssel RM: Determination of human platelet survival utiliz-
ing C-14-labeled serotonin. J Clin Invest 1961, 40:2134-2142.
29. Stuart MJ, Murphy S, Oski FA: A simple nonradioisotope technic
for the determination of platelet life-span. N Engl J Med 1975,
292(25):1310-1313.
30. Beck O, Wallen NH, Broijersen A, Larsson PT, Hjemdahl P: On the
accurate determination of serotonin in human plasma. Bio-
chem Biophys Res Commun 1993, 196:260-266.
31. Anderson GM: Measurement of plasma serotonin in autism.
Pediatr Neurol 2007, 36:138.
32. Adell A, Celada P, Abellan MT, Artigas F: Origin and functional
role of the extracellular serotonin in the midbrain raphe
nuclei. Brain Res Brain Res Rev 2002, 39:154-180.
33. Schworer H, Ramadori G: Autoreceptors can modulate 5-
hydroxytryptamine release from porcine and human small
intestine in vitro. Naunyn Schmiedebergs Arch Pharmacol 1998,
357:548-552.
34. Kim DK, Tolliver TJ, Huang SJ, Martin BJ, Andrews AM, Wichems C,
Holmes A, Lesch KP, Murphy DL: Altered serotonin synthesis,
turnover and dynamic regulation in multiple brain regions of
mice lacking the serotonin transporter. Neuropharmacology
2005, 49(6):798-810.
35. Homberg JR, Olivier JD, Smits BM, Mul JD, Mudde J, Verheul M, Nieu-
wenhuizen OF, Cools AR, Ronken E, Cremers T, Schoffelmeer AN,
Ellenbroek BA, Cuppen E:
Characterization of the serotonin
transporter knockout rat: A selective change in the function-
ing of the serotonergic system. Neuroscience. 2007,
146(4):1662-1676.
36. Chang AS, Chang SM, Starnes DM, Schroeter S, Bauman AL, Blakely
RD: Cloning and expression of the mouse serotonin trans-
porter. Brain Res Mol Brain Res 1996, 43:185-192.
37. Katsui T, Okuda M, Usuda S, Koizumi T: Kinetics of 3H-serotonin
uptake by platelets in infantile autism and developmental
language disorder (including five pairs of twins). J Autism Dev
Disord 1986, 16:69-76.
38. Marazziti D, Muratori F, Cesari A, Masala I, Baroni S, Giannaccini G,
Dell'Osso L, Cosenza A, Pfanner P, Cassano GB: Increased density
of the platelet serotonin transporter in autism. Pharmacopsy-
chiatry 2000, 33:165-168.
39. Kirchgessner AL, Liu MT, Raymond JR, Gershon MD: Identification
of cells that express 5-hydroxytryptamine1A receptors in
the nervous system of the bowel and pancreas. J Comp Neurol
1996, 364:439-455.
40. Mader R, Kocher T, Haier J, Wieczorek G, Pfannkuche HJ, Ito M:
Investigation of serotonin type 4 receptor expression in
human and non-human primate gastrointestinal samples.
Eur J Gastroenterol Hepatol 2006, 18:945-950.
41. Kemperman RFJ, Muskiet FD, Boutier AI, Kema IP, Muskiet FAJ: Brief
Report: Normal intestinal permeability at elevated platelet
serotonin levels in a subgroup of children with pervasive
developmental disorders in Curacao (The Netherlands Anti-
lles). J Autism Dev Disord 2008, 38:401-406.
42. Gray H: Gray's Anatomy 15th edition. New York, NY: Barnes & Noble,
Inc; 1995.
43. Buznikov GA, Peterson RE, Nikitina LA, Bezuglov VV, Lauder JM: The
pre-nervous serotonergic system of developing sea urchin
embryos and larvae: Pharmacologic and immnocytochemi-
cal evidence. Neurochem Res 2005, 30:825-837.
44. Buznikov GA, Lambert HW, Lauder JM: Serotonin and serotonin-
like substances as regulators of early embryogenesis and
morphogenesis.
Cell Tissue Res 2001, 305:177-186.
45. Gibbons A: Paleoanthropology: Food for thought. Science 2007,
316:1558-1560.
46. Carneiro AMD, Cook EH, Murphy DL, Blakely RD: Interactions
between integrin
α
IIb
β
3 and the serotonin transporter regu-
late serotonin transport and platelet aggregation in mice
and humans. J Clin Invest 2008, 118:1544-1552.
47. Ruch TC, Fulton JF: Medical Physiology and Biophysics 18th edition. Phil-
adelphia, PA: W. B. Saunders Company; 1960.
Publish with BioMed Central and every
scientist can read your work free of charge
"BioMed Central will be the most significant development for
disseminating the results of biomedical research in our lifetime."
Sir Paul Nurse, Cancer Research UK
Your research papers will be:
available free of charge to the entire biomedical community
peer reviewed and published immediately upon acceptance
cited in PubMed and archived on PubMed Central
yours — you keep the copyright
Submit your manuscript here:
/>BioMedcentral
Theoretical Biology and Medical Modelling 2008, 5:10 />Page 16 of 16
(page number not for citation purposes)
48. Herman IP: Physics of the Human Body New York, NY: Springer-Verlag;
2007.
49. Ross MH, Romrell LJ, Kaye GI: Histology: A Text and Atlas 3rd edition.
Baltimore, MD: Williams & Wilkins; 1995.
50. Banay-Schwartz M, Kenessey A, DeGuzman T, Lajtha A, Palkovits M:
Protein content in various regions of rat brain and adult and
aging human brains. Age 1992, 15:51-54.
51. Blinkov SM, Glezer II: The Human Brain in Figures and Tables New
York, NY: Plenum Press; 1968.
52. Gill RK, Pant N, Saksena S, Singla A, Nazir TM, Vohwinkel L, Turner
JR, Goldstein J, Alrefai WA, Dudeja PK: Function, expression, and
characterization of the human serotonin transporter in the
native human intestine. Am J Physiol Gastrointest Liver Physiol 2008,
294:G254-G262.
53. Bosan S, Kareco T, Ruehlmann D, Chen KY, Walley KR: Three-
dimensional capillary geometry in gut tissue. Microsc Res Tech
2003, 61:428-437.