Báo cáo y học: " Does codon bias have an evolutionary origin?" pps
Bạn đang xem bản rút gọn của tài liệu. Xem và tải ngay bản đầy đủ của tài liệu tại đây (4.25 MB, 15 trang )
BioMed Central
Page 1 of 15
(page number not for citation purposes)
Theoretical Biology and Medical
Modelling
Open Access
Research
Does codon bias have an evolutionary origin?
JanCBiro
Address: Homulus Foundation, 612 S Flower St., #1220, Los Angeles, 90017 CA, USA
Email: Jan C Biro -
Abstract
Background: There is a 3-fold redundancy in the Genetic Code; most amino acids are encoded
by more than one codon. These synonymous codons are not used equally; there is a Codon Usage
Bias (CUB). This article will provide novel information about the origin and evolution of this bias.
Results: Codon Usage Bias (CUB, defined here as deviation from equal usage of synonymous
codons) was studied in 113 species. The average CUB was 29.3 ± 1.1% (S.E.M, n = 113) of the
theoretical maximum and declined progressively with evolution and increasing genome complexity.
A Pan-Genomic Codon Usage Frequency (CUF) Table was constructed to describe genome-wide
relationships among codons. Significant correlations were found between the number of
synonymous codons and (i) the frequency of the respective amino acids (ii) the size of CUB.
Numerous, statistically highly significant, internal correlations were found among codons and the
nucleic acids they comprise. These strong correlations made it possible to predict missing
synonymous codons (wobble bases) reliably from the remaining codons or codon residues.
Conclusion: The results put the concept of "codon bias" into a novel perspective. The internal
connectivity of codons indicates that all synonymous codons might be integrated parts of the
Genetic Code with equal importance in maintaining its functional integrity.
Background
The genetic code is redundant: 20 amino acids plus start
and stop signals are coded by 64 codons. This redundancy
increases the resistance of genes to mutation: the third
codon letters (wobble bases) can often be interchanged
without affecting the primary sequence of the protein
product. Nevertheless, wobble base usage is highly con-
served in mRNA sequences (there is no or very little indi-
vidual or intra-species variation) and, interestingly, some
wobble mutations (though they are called silent muta-
tions) are known to cause genetic disease with no change
in the amino acid sequences [1].
However, the wobble bases are not randomly selected, as
they might be if interchangeability were unrestricted.
There is codon bias, i.e. codon usage is not equally distrib-
uted between the possible synonyms; some redundant
codons are preferentially used. This bias is described in
Codon Usage Frequency (CUF) Tables [2].
Many studies confirm the existence of codon bias and sig-
nificant correlations have been found between codon bias
and various biological parameters such as gene expression
level [3-6] gene length [7-9], gene translation initiation
signal [10], protein amino acid composition [11], protein
structure [12,13], tRNA abundance [14-17], mutation fre-
quency and pattern, [18,19] and GC composition [20-23].
These observations may not be universally valid because
some statistically significant observations in one species
Published: 30 July 2008
Theoretical Biology and Medical Modelling 2008, 5:16 doi:10.1186/1742-4682-5-16
Received: 7 July 2008
Accepted: 30 July 2008
This article is available from: />© 2008 Biro; licensee BioMed Central Ltd.
This is an Open Access article distributed under the terms of the Creative Commons Attribution License ( />),
which permits unrestricted use, distribution, and reproduction in any medium, provided the original work is properly cited.
Theoretical Biology and Medical Modelling 2008, 5:16 />Page 2 of 15
(page number not for citation purposes)
are not reproduced in another. However, there is a strong
expectation that codon bias, which is obviously well con-
served in different species, reflects a general biological
function because of the universal nature of the Genetic
Code and the structure and function of nucleic acids and
proteins.
The aim of this study is to investigate the possible origin
of so-called "codon bias", measure it quantitatively and
compare it among many species.
Materials and methods
Codon Usage Frequency (CUF) Tables were obtained for
113 different organisms from the Codon Usage Database
(NCBI-GenBank, update: November 16, 2006 [24]). The
organisms were selected from KEGG (Kyoto Encyclopedia
of Genes and Genomes, [25]) and represented a wide vari-
ety of species from different evolutionary lines [Addi-
tional file 1].
To calculate Codon Usage Bias (CUB) numerically, I
assumed that statistically equal usage of all available syn-
onymous codons is the neutral "starting point" for the
development of species-specific codon usages, and the
CUB is the sum of the deviations from such random,
equal usage.
The codons (i, 64) were divided into 21 subgroups (j, cor-
responding to the 20 amino acids and 1 stop signal). The
number of occurrences of a codon was normalized and
the frequencies of the codons (CUF
ij
) in each fraction
were calculated. The sum of CUF
if
in a fraction was always
treated as 100% so the sum of all fractions was 2100%. n
i
is the number of synonymous codons in the j
th
fraction
and n
j
= 64
CUF
ij
is the frequency (%) of the i
th
codon in the j
th
frac-
tion encoded by n
i
synonymous codons.
These fractional frequencies were compared to the ran-
dom fractional frequencies (rCUF
ij
), defined as the frac-
tional frequency that a codon would have if all alternative
codons were used randomly and equally.
rCUF
(1j)
= rCUF
(2j)
= rCUF
(n)j
= rCUF
(ij)
= 100/n
i
(%)
The sum of rCUF in a fraction is also 100% and in each
fraction altogether is 2100%.
CUB is defined as the absolute difference between CUF
and rCUF:-
More simply, CUB is the absolute number of fractional
frequencies minus the number expected if usage of synon-
ymous codons was uniform.
CUB may be used in some cases with its +/- orientation
indicated. In these cases, positive values indicate over-uti-
lization of a codon (e.g. dominant codons) while negative
values indicate under-utilization (suppression).
CUBmin = 0 if CUF
ij
= rCUF
ij
and the Calculated Maximal
Possible CUBmax is 2416.7%. This is the value when only
one of all the possible synonymous codons is used (100%
frequency) for every amino acid and for the stop signal.
Further explanation of the CUB calculation is given in
[Additional file 2], together with an example. CUF
ij
(%) is
not to be confused with a "regular" codon frequency
(CUF
i
), which indicates the frequency of a codon in the
entire genome (all 21 fractions) and is usually given in the
CUF Tables in #/1000 units.
The definition of CUB in this article is not directly compa-
rable to other widely used definitions such as CUI.
Results
Quantitative evaluation of codon bias
CUB = 0% when all available synonymous codons are
equally used. The maximal calculated bias, CUB
max
=
100%, indicates that only one codon is used for each
amino acid (and for the stop signal), while the remaining
43 codons are not used at all. I calculated CUB in 113 spe-
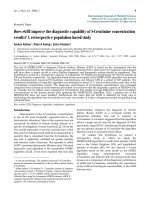
cies and found that the average value is 29.3 +/- 1.1%
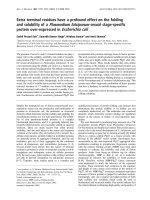
(S.E.M, n = 113). There seems to be a modest but signifi-
cant decrease in the bias during evolution: bacteria and
archeoata have the highest bias while vertebrates have the
lowest. Eukaryotes have significantly lower CUB than
prokaryotes. Humans have the lowest value (18.9%) (Fig-
ure 1).
There is a slight negative correlation between the size of
the codon- and gene-pool of an organism and its CUB (p
< 0.01, n = 113, not shown). The size and complexity of
both genome and proteome increase with evolution,
while the CUB decreases. A larger codon pool seems to
utilize more codon variation, which leads to lower differ-
ences between the usage frequencies of synonymous
codons.
CUF CUF
ij
i
n
ij
j
n
i
j
==
==
∑∑
100 2100
11
(%) (%)
CUBij CUF rCUF and
CUB CUF rCUF
ij ij
ij ij
i
=−
=−
=
∑
||
||(%)
1
64
Theoretical Biology and Medical Modelling 2008, 5:16 />Page 3 of 15
(page number not for citation purposes)
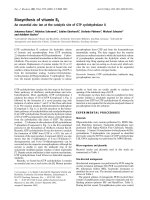
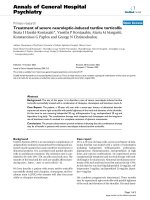
Qualitative evaluation of CUB
Detailed analysis of different species reveals wide varia-
tions in CUB (Figure 2). There is a seemingly random var-
iation in CUB between amino acids and different groups of
organisms. However, a comparison of closely-related spe-
cies with large codon pools shows very similar patterns.
For example, all mammals have very similar CUB patterns.
Pan-genomic codon usage
I accumulated the CUF data from the 113 species into a
single CUF Table (Table 1). This Table is intended to give
a virtual representation of all organisms (Pan-Genome)
and a numerical representation of the "universal" transla-
tion machinery. As many as 288 × E10 codons are repre-
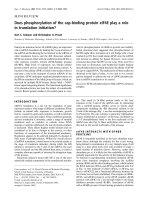
sented in this collection. The distribution of CUB values
in the Pan-Genomic CUF Table is illustrated in Figure 3.
The transition from maximum-positive to maximum-neg-
ative values is smooth and there is no obvious or unam-
biguous border between the so-called dominant and
prohibited codons. All possible codons are used.
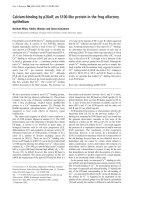
There is a significant positive correlation between the
number of synonymous codons (n
i
, #/amino acid) and
the propensity of amino acids in the proteome (#/1000
amino acid residues). A similar correlation exists between
synonymous codon frequency and CUB (Figure 4). These
important correlations were discovered by analyzing the
Pan-Genomic CUF Table (64 values) and were confirmed
using individual data from all species (113 × 21 values).
Another possible way to evaluate the possible phyloge-
netic relationships among CUBs in different species is to
use the Pan-Genomic CUB Table as a common reference.
I performed correlation analyses and compared the lists of
species-specific CUB values to the list of mean CUB values
in the Pan-Genomic CUB Table (64 × 113 comparisons),
then used the significance of correlations as an indicator
of CUB distances [Additional file 3].
I found that the CUB of vertebrates is most similar (least
distant) to the average CUB, while bacteria and viruses are
most distant from it. This correlation analysis involves all
codons and gives no information about the development
of individual CUBs. I therefore compared the codon-spe-
cific CUB values in the 113 species to obtain a rough esti-
mate of the stability of (commitment to) a CUB through
evolution. The mean/SD of the 113 amino acid-specific
CUB values gives a good estimate how this stability
(Figure 5).
Codon Usage Bias (CUB) in Some OrganismsFigure 1
Codon Usage Bias (CUB) in Some Organisms. Mean +/- S.E.M, n: number of species in the group.
Theoretical Biology and Medical Modelling 2008, 5:16 />Page 4 of 15
(page number not for citation purposes)
CUB ComparisonsFigure 2
CUB Comparisons. Codon Usage Biases (CUB) were calculated in 113 species and sorted into subgroups. The mean CUBs
of the 64 codons in the indicated subgroups are shown. (CUB
max
= 100% for the 64 codons altogether). A: superdomains, B:
kingdoms, C: some mammals.
Theoretical Biology and Medical Modelling 2008, 5:16 />Page 5 of 15
(page number not for citation purposes)
Internal dynamics of codons
Correlations between individual CUB frequencies
When one of the synonymous codons is used more fre-
quently than expected (positive CUB), another will be less
frequently used (negative CUB). More generally, this
means that codon usage changes in a subgroup of the 64
codons will be accompanied by changes in the opposite
direction in the remaining codons.
I sorted the CUB values (64 × 113 = 7,232 listed in total)
in the Pan-Genomic CUB Table according to their sizes
and +/- directions [Additional file 4]. This sorting divided
the 64 codons (c) into two subgroups (Ac and Bc) and the
113 species (s) into two additional groups (As and Bs).
The Ac-As and Bc-Bs subgroups contained predominantly
over-represented (positive CUB) codons and are located
in the opposite diagonal corners of the Table. The Ac-Bs
and Bc-As fields contained predominantly under-repre-
sented (negative CUB) codons and are located in the other
opposite diagonal corners of the Table.
There is an internal inverse relationship between codons,
which is valid and the same for all species. This inverse
relationship is shown in a compressed and simplified
form in Figure 6a, b.
Table 1: Pan-Genomic CUF & CUB Table
Am.Acid Codon Number CUFi
(#/1 k)
CUFij (%
of
fraction)
rCUF
(% of
fraction
CUBij
(%)
|CUBij
(%)|
Am.Acid Codon Number CUFi
(#/1 k)
CUFij (%
of
fraction)
rCUF
(% of
fraction
CUBij
(%)
|CUBij
(%)|
GLY GGG 3598776.0 12.5 19.0 25.0 -6.0 6.0 Trp TGG 3675912.0 12.7 100.0 100.0 0.0 0.0
GLY GGA 5477754.0 19.0 28.9 25.0 3.9 3.9 End TGA 308407.0 1.1 39.9 33.0 6.9 6.9
GLY GGT 4451391.0 15.4 23.5 25.0 -1.5 1.5 Cys TGT 2509240.0 8.7 47.2 50.0 -2.8 2.8
GLY GGC 5445255.0 18.9 28.7 25.0 3.7 3.7 Cys TGC 2810369.0 9.7 52.8 50.0 2.8 2.8
Glu GAG 9756293.0 33.8 51.4 50.0 1.4 1.4 End TAG 183171.0 0.6 23.7 33.0 -9.3 9.3
Glu GAA 9209632.0 31.9 48.6 50.0 -1.4 1.4 End TAA 281718.0 1.0 36.4 33.0 3.4 3.4
Asp GAT 8195141.0 28.4 54.9 50.0 4.9 4.9 Tyr TAT 4107194.0 14.2 48.6 50.0 -1.4 1.4
Asp GAC 6731842.0 23.3 45.1 50.0 -4.9 4.9 Tyr TAC 4337253.0 15.0 51.4 50.0 1.4 1.4
Val GTG 6428801.0 22.3 35.3 25.0 10.3 10.3 Leu TTG 4737403.0 16.4 17.5 16.7 0.8 0.8
Val GTA 2695055.0 9.3 14.8 25.0 -10.2 10.2 Leu TTA 3136971.0 10.9 11.6 16.7 -5.1 5.1
Val GTT 4781792.0 16.6 26.3 25.0 1.3 1.3 Phe TTT 5426287.0 18.8 48.0 50.0 -2.0 2.0
Val GTC 4280999.0 14.8 23.5 25.0 -1.5 1.5 Phe TAC 5873939.0 20.4 52.0 50.0 2.0 2.0
Ala GCG 3487704.0 12.1 16.8 25.0 -8.2 8.2 Ser TCG 2485280.0 8.6 10.8 16.7 -5.9 5.9
Ala GCA 5031084.0 17.4 24.3 25.0 -0.7 0.7 Ser TCA 3962926.0 13.7 17.2 16.7 0.6 0.6
Ala GCT 5779334.0 20.0 27.9 25.0 2.9 2.9 Ser TCT 4499262.0 15.6 19.6 16.7 2.9 2.9
Ala GCC 6432441.0 22.3 31.0 25.0 6.0 6.0 Ser TCC 4191190.0 14.5 18.2 16.7 1.6 1.6
Arg AGG 3071603.0 10.6 18.9 16.7 2.3 2.3 Arg CGG 2379693.0 8.2 14.7 16.7 -2.0 2.0
Arg AGA 3953550.0 13.7 24.4 16.7 7.7 7.7 Arg CGA 1898114.0 6.6 11.7 16.7 -5.0 5.0
Ser AGT 3473736.0 12.0 15.1 16.7 -1.6 1.6 Arg CGT 2071451.0 7.2 12.8 16.7 -3.9 3.9
Ser AGC 4391636.0 15.2 19.1 16.7 2.4 2.4 Arg CGC 2842349.0 9.8 17.5 16.7 0.9 0.9
Lys AAG 8869890.0 30.7 52.7 50.0 2.7 2.7 Gin CAG 6974185.0 24.2 58.6 50.0 8.6 8.6
Lys AAA 7946577.0 27.5 47.3 50.0 -2.7 2.7 Gin CAA 4922495.0 17.1 41.4 50.0 -8.6 8.6
Asn AAT 6514892.0 22.6 51.9 50.0 1.9 1.9 His CAT 3408853.0 11.8 49.7 50.0 -0.3 0.3
Asn AAC 6036774.0 20.9 48.1 50.0 -1.9 1.9 His CAC 3453004.0 12.0 50.3 50.0 0.3 0.3
Met ATG 6909100.0 23.9 100.0 100.0 0.0 0.0 Leu CTG 7327412.0 25.4 27.1 16.7 10.4 10.4
Ile ATA
3373624.0 11.7 22.2 33.0 -10.8 10.8 Leu CTA 2418342.0 8.4 8.9 16.7 -7.7 7.7
Ile ATT 5925942.0 20.5 39.0 33.0 6.0 6.0 Leu CTT 4540618.0 15.7 16.8 16.7 0.1 0.1
Ile ATC 5905801.0 20.5 38.8 33.0 5.8 5.8 Leu CTC 4907197.0 17.0 18.1 16.7 1.5 1.5
Thr ACG 2486009.0 8.6 15.9 25.0 -9.1 9.1 Pro CCG 2861706.0 9.9 18.9 25.0 -6.1 6.1
Thr ACA 4473401.0 15.5 28.6 25.0 3.6 3.6 Pro CCA 4491106.0 15.6 29.7 25.0 4.7 4.7
Thr ACT 4084032.0 14.2 26.1 25.0 1.1 1.1 Pro CCT 4142534.0 14.4 27.4 25.0 2.4 2.4
Thr ACC 4619047.0 16.0 29.5 25.0 4.5 4.5 Pro CCC 3615638.0 12.5 23.9 25.0 -1.1 1.1
Summs 288600157.0 1000.0 2100.0 2097.9 2.1 245.4
10.14% of CUBmax
Distribution of Pan-Genomic CUBFigure 3
Distribution of Pan-Genomic CUB. CUB was taken
from Pan-Genomic Codon Usage Table and sorted in
ascending order.
Theoretical Biology and Medical Modelling 2008, 5:16 />Page 6 of 15
(page number not for citation purposes)
Correlations between Synonymous Codon Usage Frequency, Amino Acid Usage Frequency and Codon Usage Bias (CUB)Figure 4
Correlations between Synonymous Codon Usage Frequency, Amino Acid Usage Frequency and Codon Usage
Bias (CUB). The columns represent mean ± S.E.M., n is indicated within the columns. The significance of correlations is also
included. Black circles indicate the positions of mean values and the numbers in the black circles indicate the number of synon-
ymous codons/amino acid.
Theoretical Biology and Medical Modelling 2008, 5:16 />Page 7 of 15
(page number not for citation purposes)
Negative correlations were expected between some sub-
groups of CUBs and others in the same species. Surpris-
ingly, however, all codons and all species belong to only
2 clusters with highly correlated, opposite dynamics.
The above figures indicate that there is a close internal and
inverse correlation between the CUBs of different codons.
The magnitude and orientation of a CUB shows wide var-
iation between species. Our collection of 113 species is
too limited for any conclusion about the phylogenetic
rules of development of CUB to be drawn, but the first
impression is an absence of phylogenetic rules:
- about half the species under-utilize about half the
codons, while the other half show the opposite behavior
in respect of the remaining codons.
- It is difficult to find a correlation between CUB and
taxon boundaries. All mammals (in the table) show a
homogenous CUB pattern, while other taxa are much
more diverse.
- Most codons show a wide pangenomic variation in CUB,
but some vary much less than others (Figure 5). Some
codons (TAG, GGG, CGA, CTA) are under-utilized by
more than 80% of the 113 species listed, i.e. these synon-
ymous codons have become committed to a given CUB
orientation while others have not. There is a significant
negative correlation between the proportion of codons
committed to a given CUB orientation and the extent to
which CUB varies (also apparent in Figure 5).
Internal relationship among codon bases in codon usage tables
Codons are defined by 3 nucleotides. Therefore, CUF
Tables can be further analyzed as Nucleotide Usage Fre-
quency (NUF) Tables.
The 113 CUF Tables in our material are based on 288 mil-
lion codons and 690 K CDS. The number of codons in this
collection is enough to provide reliable information
about the general rules, if any, that determine nucleotide
ratios and correlations in genomes.
There are some highly significant correlations among
codon bases. The fractional frequency of each nucleotide
base in every codon position correlates positively with its
complementary codon (Table 2).
The sum of both complementary codon pairs (A+T and
G+C) in every codon position is positively correlated to
the sum of the same codon pair in the other two codon
positions (Table 3). These correlations are valid for every
species.
This strong positional correlation between codon bases
suggests that it is possible to predict the frequency of
usage of a nucleotide in the codon usage table from the
frequencies of other nucleotides. Predictions regarding
the third nucleotides in codons are especially interesting,
because these are wobble bases for most amino acid
codons.
Estimation of Codon CommitmentFigure 5
Estimation of Codon Commitment. The mean ± SD values of CUB were calculated for the 64 codons (n = 113). The
mean/SD*100 values were regarded as the measure of a codon's commitment to a given CUB through evolution. Very low (-)
values indicate strong negative CUB (under-utilization of that codon) while the meaning of high (+) values is the opposite. The
codon commitment value reflects the propensity towards over-utilized codons (positive CUB). A: individual values, B: correla-
tion analyses.
Theoretical Biology and Medical Modelling 2008, 5:16 />Page 8 of 15
(page number not for citation purposes)
I used the correlation between the sum of complementary
codon pairs in the 1
st
and 2
nd
codon positions to predict
the wobble bases using the frequencies for 113 different
species (Table 4, Figure 7). This is of course a prediction of
the frequencies of the four wobble bases in all 64 possible
codons and has no predictive value for individual wobble
bases belonging to individual amino acids. All these cor-
relation were of course carefully compared to correspond-
ing random controls. Care was taken to ensure that the
randomized control samples had the same size and distri-
bution as the test samples. The sum of randomized frac-
tions was kept equal to 1, as in the test samples. There
were no correlations between the corresponding nucle-
otides in the control samples.
This simple but highly significant and species-independ-
ent positional relationship between NUFs provides fur-
ther strong support for the view that the genetic code is the
result of development and not at all a "frozen accident".
Correlation between individual codons
The detection of a strong internal pangenomic relation-
ship among codons in the CUF Tables and the positional
correlation among the base residues of these codons led to
an even deeper correlation analysis. The correlations
between every single codon frequency and every other
codon frequency (64 × 64/2 = 2,048) were calculated
using linear regression analysis [Additional file 5].
Further detailed analysis of the internal positional correla-
tions between codons and codon bases revealed signifi-
cant correlations between different codons, which are
generally valid for every species in our collection.
I noticed that there is a pattern of positive/negative corre-
lations in these tables corresponding to the codon letters
and their positions in the codon. The general rules of this
pattern are summarized in Figure 8.
There is a simple rule regarding codon correlations in the
pangenome: there are positive correlations between com-
plementary nucleotides and negative correlations
between non-complementary nucleotides. This pattern of
correlations is statistically significant in most combina-
tions of nucleotide positions in codons. The correlations
are statistically most significant between nucleotides in
the 3
rd
codon positions.
Prediction of individual wobble bases
I used these correlations to predict individual wobble
bases (all 64) from the 1
st
and 2
nd
letters of the codons (all
64). The possible correlations between a codon and the
16 possible permutations of the 4 1
st
and 2
nd
codon letters
(64 × 4 × 4 = 1024) are listed in [Additional file 6].
Accuracy of codon predictions
I used the strongest correlations [Supplementary File 6] to
predict codon frequencies, and the mean of several predic-
tions was used as the averaged predicted value (p). Four
different approaches were used to evaluate the predictions
quantitatively.
The correlation between real (r) and predicted (p) values
belonging to the same codons was significant (p < 0.05)
in 54 cases but not the other 10 (Figure 9a).
The correlation between real (r) and predicted (p) values
belonging to the same species was significant (p < 0.05) in
all 113 cases and The p value was below 10E-07 in all but
2 species (Figure 9b).
The average accuracy of individual CUF predictions in 113
species and 87 individual proteins was estimated by com-
Species Dependent Internal Correlation between CUBsFigure 6
Species Dependent Internal Correlation between
CUBs. Codon usage biases (CUBs) from 113 species were
sorted as described in the text and divided into 11 consecu-
tive subgroups. Each symbol represents the mean of CUB
values from 10 different species. The values were sorted for
species subgroups (A) and for codons (B). Only some repre-
sentative samples are included (4 codons of total 64 and 3
groups of different species of total 11).
Theoretical Biology and Medical Modelling 2008, 5:16 />Page 9 of 15
(page number not for citation purposes)
paring the average real and predicted frequencies. The sig-
nificance of the correlation between real and predicted
CUF was 1.3E-64 when data from 113 species were aver-
aged and compared (n = 64) and 1.9E-28 when data
derived from 87 individual proteins (n = 64) were used
(Figure 10).
Discussion
There are basically two approaches to measuring CUB.
First, relative synonymous codon usage (RSCU) values
can be calculated [5]. RSCU is the observed number of
codon occurrences divided by the number expected if syn-
onymous codons were used uniformly. Second, the rela-
tive merits of different codons can be assessed from the
viewpoint of translational efficiency. This second
approach led to the development of the Codon Adapta-
tion Index (CAI, [6]). The CAI model assigns a parameter,
termed 'relative adaptiveness', to each of the 61 codons
(stop codons excluded). The relative adaptiveness of a
codon is defined as its frequency relative to the most
often-used synonymous codons and is computed from a
set of highly expressed genes. The CAI is widely used even
though the subjectivity involved in selecting the reference
codons is well recognized [26,27].
My way of calculating CUB is very close to the original suggestion
[5] and regards uniform codon usage as the "null hypothesis";
any deviation from this is the bias. This approach made it possi-
ble to avoid subjectivity and species limitations in choosing the
reference set of codons, and I can build the concept of CUB on the
massive foundation of statistical laws and the large collection of
sequence data collected in Codon Usage Frequency Tables.
The origin and biological significance of CUB is not well
understood, therefore I tried to find the rules (if any) of its
evolutionary development and gain new insights about its
possible function. I sort my findings into two main cate-
gories: I found
a.) some (few) signs of the evolutionary origin and devel-
opment of CUB;
b.) unexpectedly large number of highly significant intern
correlations between different codon residues (bases) at
different codon positions (first, central, wobble) as well as
between individual codons.
Inter-species variation in CUB is about 10%, but it is obvi-
ous that prokaryotes have significantly larger CUBs than
eukaryotes. Bacteria may show the greatest bias because
these primitive organisms are rich in highly-expressed
genes and often use only one dominant codon. CUB
decreases progressively with evolution and humans have
the lowest bias (only about 20%). Evolutionary increase
in codon number and genome complexity seems to
reduce the CUB. It is noticeable that the average CUB
(29.3 ± 1.1% (S.E.M.) n = 113) means that synonymous
codon usage frequencies are 29.3% distant from the "all
codons are equally good" hypothesis, and 70.7% distant
from the "one codon is the best 'codon" alternative.
A more detailed qualitative analyzes of CUB is possible
using a pan-genomic CUF Table. The original purpose of
this virtual table was to create a reference for comparison
of CUBs, but it turned out to reveal other codon-related
connections too. The pan-genomic CUF Table is based on
only 113 species, so it might be the first but not the last of
its kind. It makes it possible to detect major, universal
trends in codon usage behind small individual (or even
species-wide) variations.
CUB is often correlated to the intensity of translation and
has even been used to predict highly-expressed genes [6].
It is also known to be related to tRNA copy number, and
co-evolution of tRNA gene composition and codon usage
bias in genomes has been suggested [28]. I found a very
strong correlation between the number of synonymous
Table 2: Positional nucleotide usage frequencies in 113 Species
log(-C) C1/# C2/# G3/# C3/# G1/# G2/# T2/# T1/# T3/# A3/# A2/# A1/#
A1/# -45.1 -31.7 -29.2 -26.5 -24.3 -20.6 5.5 16.6 21.1 32.9 35.1 100.0
A2/# -23.1 -21.4 -19.5 -15.4 -20.9 -27.0 1.1 13.9 14.5 18.5 100.0 35.1
A3/# -33.8 -19.7 -53.6 -55.9 -17.8 -15.1- 6.1 20.9 33.1 100.0
18.5 32.9
T3/# -25.0 -12.2 -50.9 -56.0 -16.7 -18.7 6.4 24.9 100.0
33.1 14.5 21.1
T1/# -21.0 -9.9 -25.2 -22.8 -30.6 -17.1 4.6 100.0
24.9 20.9 13.9 16.6
T2/# -10.3 -13.0 -6.6 -6.3 -1.3 -7.2 100.0
4.6 6.4 6.1 1.1 5.5
G2/# 24.9 11.3 23.0 14.0 11.9 100.0 -7.2 -17.1 -18.7 -15.1 -27.0 -20.6
G1/# 12.4 12.4 18.6 17.5 100.0
11.9 -1.3 -30.6 -16.7 -17.8 -20.9 -24.3
C3/# 29.0 17.0 44.3 100.0
17.5 14.0 -6.3 -22.8 -56.0 -55.9 -15.4 -26.5
G3/# 32.9 15.3 100.0
44.3 18.6 23.0 -6.6 -25.2 -50.9 -53.6 -19.5 -29.2
C2/# 25.5 100.0
15.3 17.0 12.4 11.3 -13.0 -9.9 -12.2 -19.7 -21.4 -31.7
C1/# 100.0
25.5 32.9 29.0 12.4 24.9 -10.3 -21.0 -25.0 -33.8 -23.1 -45.1
C: Significance of correlation. – sign was added to negative correlations. log (-0) was regarded to be 100.
Theoretical Biology and Medical Modelling 2008, 5:16 />Page 10 of 15
(page number not for citation purposes)
Table 3: Positional nucleotide usage frequencies in 113 Species
log
(-C)
C1+
G1
C3+
G3
C2+
G2
C2+
T2
C1+
T1
G2+
T2
C3+
T3
G1+
T1
G3+
T3
A3+
C3
A1+
C1
A3+
G3
A2+
C2
A1+
G1
A2+
G2
A2+
T2
A3+
T3
A1+
T1
A1+
T1
-
100.
0
-38.6 -
38.3
-8.9 -7.4 -4.5 -3.6 -1.9 -0.5 0.5 1.9 3.6 4.5 7.4 8.9 38.3 38.6 100.
0
A3+
T3
-38.6 -
100.
0
-24.9 -4.6 -6.9 -2.7 -4.0 -0.4 -2.0 2.0 0.4 4.0 2.7 6.9 4.6 24.9 100.
0
38.6
A2+
T2
38.3 -24.9 -
100.
0
-7.1 -12.8 -2.9 -2.3 -1.1 -0.2 0.2 1.1 2.3 2.9 12.8 7.1 100.
0
24.9 38.3
A2+
G2
-8.9 -4.6 -7.1 -
100.
0
-3.0 -7.1 -5.4 -11.2 -0.5 0.5 11.2 5.4 7.1 3.0 100.
0
7.1 4.6 8.9
A1+
G1
-7.4 -6.9 -12.8 -3.0 -
100.
0
-0.2 -3.7 -0.2 -0.7 0.7 0.2 3.7 0.2 100.
0
3.012.86.9 7.4
A2+
C2
-4.5 -2.7 -2.6 -7.1 -0.2 -
100.
0
-0.8 -2.4 -0.2 0.2 2.4 0.8 100.
0
0.2 7.1 2.9 2.7 4.5
A3+
G3
-3.6 -4.0 -2.3 -5.4 -3.7 -0.8 -
100.
0
-1.3 -1.0 1.0 1.3 100.
0
0.8 3.7 5.4 2.3 4.0 3.6
A1+
C1
-1.9 -0.4 -1.1 -11.2 -0.2 -2.4 -1.3 -
100.
0
-0.6 0.6 100.
0
1.3 2.4 0.2 11 2 1.1 0.4 1.9
A3+
C3
-0.5 -2.0 -0.2 -0.5 -0.7 -0.2 -1.0 -0.6 -
100.
0
100.
0
0.6 1.0 0.2 0.7 0.5 0.2 2.0 0.5
G3+
T3
0.5 2.0 0.2 0.5 0.7 0.2 1.0 0.6 100.
0
-
100.
0
-0.6 -1.0 -0.2 -0.7 -0.5 -0.2- -2.0- -0.5
G1+
T1
1.9 0.4 1.1 11.2 0.2 2.4 1.3 100.
0
0.6 -0.6 -
100.
0
-1.3 -2.4 -0.2 -11.2 -1.1 -0.4 -1.9
C3+
T3
3.6 4.0 2.3 5.4 3.7 0.8 100.
0
1.3 1.0 -1.0 -1.3 -
100.
0
-0.8 -3.7 -5.4 2.3 4.0 -3.6
G2+
T2
4.5 2.7 2.9 7.1 0.2 100.
0
0.8 2.4 0.2 -0.2 -2.4 -0.8 -
100.
0
-0.2 -7.1 -2.9 -2.7 -4.5
C1+
T1
7.4 6.9 12.8 3.0 100.
0
0.2 3.7 0.2 0.7 -0.7 -0.2 -3.7 -0.2 -
100.
0
-3.0 -12.8 -6.9 -7.4
C2+
T2
8.9 4.6 7.1 100.
0
3.0 7.1 5.4 11.2 0.5 -0.5 -11.2 -5.4 -7.1 -3.0 -
100.
0
-7.1 -4.6 -8.9
C2+
G2
38.3 24.9 100.
0
7.1 12.8 2.9 2.3 1.1 0.2 -0.2 -1.1 -2.3 -2.9 -12.8 -7.1 -
100.
0
-24.9 -
38.3
C3+
G3
38.6 100.
0
24.9 4.6 6.9 2.7 4.0 0.4 2.0 -2.0 -0.4 -4.0 -2.7 -6.9 -4.6 -24.9 -
100.
0
-38.6
C1+
G1
100.
0
38.6 38.3 8.9 7.4 4.5 3.6 1.9 0.5 -0.5 -1.9 -3.6 -4.5 -7.4 -8.9 -
38.3
-38.6 -
100.
0
C: Significance of correlation. – sign was added to negative correlations. log (-0) was regarded to be 100
Theoretical Biology and Medical Modelling 2008, 5:16 />Page 11 of 15
(page number not for citation purposes)
codons and the frequency of the amino acids they
encoded, as well as the CUB. More synonymous codons
encode more amino acids of the same kind and cause
greater bias. This (rather logical) connection is not
described in the literature, probably because the defini-
tion of CUB is very different from mine.
I tried to define a kind of "phylogenetic tree" of CUBs
using the pan-genomic CUF table as reference. The signif-
icance of correlations between species-specific CUF and
pan-genomic CUF gave a qualitative, theoretical measure
of distances between codon usages. However this correla-
tion-based approach did not successfully detect any recog-
nizable, species-related evolutionary pattern.
Estimation of codon commitments through evolution
showed that some codons are clearly over-utilized while
other are avoided in most species. This finding is compat-
ible with the concept of dominant and suppressed codons,
but without stating that this difference is the result of evo-
lution [29].
Table 4: Wobble base prediction
A3/# = A1+T1/# × 1.1004 + -0.2898 p = 9.3E-38
A3/# = A2+T2/# ×1.39228+-0.6003p = 8.6E-25
C3/# = C1+G1/# ×1.14274+-0.3466p = 8.7E-34
C3/# = C2+G2/# ×1.42309+-0.3182p = 8.1E-22
G3/# = C1+G1/# ×0.95213+-0.2566p = 4.1E-38
G3/# = C2+G2/# × 1.23154 + -0.251 p = 8.5E-27
T3/# = C1+G1/# ×0.99447+-0.2019p = 7.2E-30
T3/# = C2+G2/# ×1.26235+-0.4851p = 5.5E-21
Correlation between Codon Bases in Codons of 113 SpeciesFigure 7
Correlation between Codon Bases in Codons of 113 Species. The frequency of the four possible nucleotide bases (A,
T, G, G) in the 3 possible codons positions (1
st
. 2
nd
, 3
rd
) were counted in 113 codon usage tables and plotted against each
other. A1+T1 > A3 means the correlation between the sum of the 1
st
A plus 1
st
T frequencies and the 3
rd
A frequency (n =
113).
Theoretical Biology and Medical Modelling 2008, 5:16 />Page 12 of 15
(page number not for citation purposes)
The non-randomness of synonymous codon usage is
widely accepted today, and it has been suggested that
independent forces (such as tRNA pool size [30]) have a
role in the reading frame and there are contextual con-
straints on synonymous codon choice [31-33].
Other lines of evidence suggest that the Genetic Code
itself (the 64 codons in toto as a system) has an inherited,
internal structure [34,35]. Statistical studies on the nucle-
otide compositions of codons and of different codon
positions support this concept [36-41].
I searched for the origin end development of codon bias
and I found an extensive network of internal correlations
between codons of a species and the nucleotides that
define them. The correlations described in this article are:
- Correlation between the frequency of any single codon
residue (base) at any codon position (first, central, wob-
ble) and the frequency of any other single codon residue
(base) at any other codon position (also first, central,
wobble);
- Correlation between the sum of frequencies of any two
codon residues (bases) at any two codon positions ((first,
central, wobble) and the sum of any two other codon res-
idues (bases) at any two other codon positions (also first,
central, wobble);
- Correlation between A+T, G+C frequencies at the 1
st
, 2
nd
codon positions and A+T, G+C frequencies at the 3
rd
codon position;
- Correlations between any two codons.
There seems to be a simple rule behind all these statisti-
cally significant correlations: the correlation between any two
nucleotides at any two codon positions is positive if the two
nucleotides are complementary to each other and negative if
they are not (illustrated in Figure 8).
The large number of statistically highly significant correla-
tions made it possible to predict the frequencies of synon-
ymous codons (in 113 species and 87 individual proteins)
from the general overall frequencies of codons. The relia-
bility of predictions was tested.
Conclusion
The cumulative Codon Usage Frequency of any codon is
strongly dependent on the cumulative Codon Usage Fre-
quency of other codons belonging to the same species.
The rules of this codon dependency are the same for all
species and reflect WC base pair complementarity. This
internal connectivity of codons indicates that all synony-
mous codons are integrated parts of the Genetic Code
Accuracy of Codon Predictions – Amino Acid and Species Related PredictionsFigure 9
Accuracy of Codon Predictions – Amino Acid and
Species Related Predictions. Codon frequencies (64)
were predicted (p) in 113 species and compared to the real
(r) values. The correlations between r and p were sorted for
codons (A) and species (lB). The correlations were
expressed as f values (-log correlation coefficient). An f > 1.5
can be regarded as statistically significant correlation.
CUF – Pan-Genomic Codon CorrelationsFigure 8
CUF – Pan-Genomic Codon Correlations. Codon fre-
quencies were collected from 113 Codon Usage Frequency
Tables and the correlation coefficients (C, 64 × 64) were cal-
culated. f = -log C. A – sign was added to indicate negative
correlations. The figure shows the f values between 4 × 4
codon letter combinations in 3 × 3 codon positions. Each
symbol represent the mean of f values (n = 113). f < -2 and f
> 2 correspond to statistically significant correlations.
Theoretical Biology and Medical Modelling 2008, 5:16 />Page 13 of 15
(page number not for citation purposes)
with equal importance in maintaining its functional
integrity. The so-called codon bias is a bias caused by the
protein-centric view of the genome.
Competing interests
The author declares that they have no competing interests.
Authors' contributions
JB is the only author.
Additional material
Additional file 1
CUB Tables – Summary of 113 Species
Click here for file
[ />4682-5-16-S1.xls]
Additional file 2
Calculation of Codon Usage Bias (CUB) – Explanation and Example.
The 64 codons were sorted in to 21 subgroups (fractions) corresponding
to the 20 coded amino acids and the stop signal. The sum of synonymous
codon frequencies were always regarded as 100% i.e. the sum of all codon
frequencies is 2100% (color coded columns). The fractional frequency
(CUF
ij
%) of a synonymous codon is the contribution of that codon to this
100%. The theoretical, natural frequencies of the synonymous codons is
regarded as equal to each other (for example the natural fractional fre-
quency of each synonymous codon of Arg is 100%/6 = 16.7%). The dif-
ference between this theoretical (calculated) frequency and the real
(counted) fractional frequency of a codon is the CUB
ij
%. However it is
necessary to use the |CUB
ij
%| value instead to be able to calculate and
compare the total CUB values of entire proteins (i.e. the sum of 64 CUB
values). A theoretical extreme case of codon usage is when only one of all
synonymous codons is used (CUB% 1 max column). The maximal possi-
ble CUB of all codons will in this case be 2416.7%, which is regarded as
the CUFmax. In the real case of Homo sapiens the sum of fractional fre-
quencies is 456, which is 18.9% of the theoretical CUBmax.
Click here for file
[ />4682-5-16-S2.xls]
Accuracy of Codon Predictions in species and proteinsFigure 10
Accuracy of Codon Predictions in species and proteins. Codon frequencies were predicted in 113 species (A, B) and in
87 individual proteins(C, D). The average real (r) and predicted (p) codon frequencies were plotted (A, C) and correlations
were analyzed (B, D).
Theoretical Biology and Medical Modelling 2008, 5:16 />Page 14 of 15
(page number not for citation purposes)
Acknowledgements
The continuous support and editorial help of Dr P S Agutter is very much
acknowledged.
References
1. Sauna ZE, Kimchi-Sarfaty C, Ambudkar SV, Gottesman MM: The
sounds of silence: synonymous mutations affect function.
Pharmacogenomics 2007, 8:527-532.
2. Codon Usage Database – NCBI-GenBank Flat File Release
156.0 [ />]. [October 15 2006].
3. Gouy M, Gautier C: Codon usage in bacteria: correlation with
gene expressivity. Nucleic Acids Res 1982, 10:7055-7074.
4. Sharp PM, Li WH: An evolutionary perspective on synonymous
codon usage in unicellular organisms. J Mol Evol 1986, 24:28-38.
5. Sharp PM, Tuohy TM, Mosurski KR: Codon usage in yeast: cluster
analysis clearly differentiates highly and lowly expressed
genes. Nucleic Acids Res 1986, 14:5125-5143.
6. Sharp PM, Li WH: The codon Adaptation Index – a measure of
directional synonymous codon usage bias, and its potential
applications. Nucleic Acids Res 1987, 15:1281-1295.
7. Bains W: Codon distribution in vertebrate genes may be used
to predict gene length. J Mol Biol 1987, 197:379-388.
8. Eyre-Walker A: Synonymous codon bias is related to gene
length in Escherichia coli: selection for translational accuracy?
Mol Biol Evol 1996, 13:864-872.
9. Wan X, Xu D, Zhou J: A new informatics method for measur-
ing synonymous codon usage bias. In Intelligent engineering sys-
tems through artificial neural networks Volume 13. Edited by: Dagli C,
Buczak A, Ghosh J, Embrechts M, Ersoy E. ASME Press, New York,
NY; 2003:1101-1018.
10. Ma J, Campbell A, Karlin S: Correlations betweenShine-Dal-
garno sequences and gene features such as predicted expres-
sion levels and operon structures. J Bacteriol 2002,
184:5733-5745.
11. Lobry JR, Gautier C: Hydrophobicity, expressivity and aroma-
ticity are the major trends of amino-acid usage in 999
Escherichia coli chromosome-encoded genes. Nucleic Acids Res
1994, 22:3174-3180.
12. Xie T, Ding D, Tao X, Dafu D: The relationship between synon-
ymous codon usage and protein structure. FEBS Lett 1998,
434:93-96.
13. D'Onofrio G, Ghosh TC, Bernardi G: The base composition of
the genes is correlated with the secondary structures of the
encodedproteins. Gene 2002, 300:179-187.
14. Ikemura T: Correlation between the abundance of Escherichia
coli transfer RNAs and the occurrence of the respective
codons in its protein genes: a proposal for a synonymous
codon choice that is optimal for the E. coli translational sys-
tem. J Mol Biol 1981, 151:389-409.
15. Ikemura T: Correlation between the abundance of yeast
transfer RNAs and the occurrence of the respective codons
in protein genes. Differences in synonymous codon choice
patterns of yeast and Escherichia coli with reference to the
abundance of isoaccepting transfer RNAs. J Mol Biol 1982,
158:573-597.
16. Bulmer M: Coevolution of codon usage and transfer
RNAabundance. Nature 1987, 325:728-730.
17. Kanaya S, Yamada Y, Kudo Y, Ikemura T: Studies of codon usage
and tRNA genes of 18 unicellular organisms and quantifica-
tion of Bacillus subtilis tRNAs: gene expression level and spe-
cies- specific diversity of codon usage based on multivariate
analysis. Gene 1999, 238:143-155.
18. Sueoka N: Directional mutation pressure, selective con-
straints, and genetic equilibria. J Mol Evol 1999, 34(2):95-114.
19. Sueoka N: Two aspects of DNA base composition: G+C con-
tent and translation-coupled deviation from intra-strand
rule of A = T and G = C. J Mol Evol 1999, 49:49-62.
20. Bernardi G: Compositional constraints and genome evolution.
J Mol Evol 1986, 24:1-11.
21. Karlin S, Mrazek J: What drives codon choices in human genes?
J Mol Biol 1996, 262:459-472.
22. Antezana MA, Kreitman M: The nonrandom location of synony-
mous codons suggests that reading frame-independent
forces have patterned codon preferences. J Mol Evol 1999,
49:36-43.
23. Sueoka N, Kawanishi Y: DNA G+C content of the third codon
position and codon usage biases of human genes. Gene 2000,
261:53-62.
24. Sequence Manipulation Suite: Codon Usage. [http://bioinformat
ics.org/sms2/codon_usage.html].
25. KEGG: Kyoto Encyclopedia of Genes and Genomes., KEGG
Release 40.0. 2006 [ />].
26. Jansen R, Bussemaker HJ, Gerstein M: Revisiting the codon adap-
tation index from a whole-genome perspective: analyzing
the relationship between gene expression and codon occur-
Additional file 3
Correlation Analyses of Codon Usage Bias (CUB) in 113 Species.
CUBs of 113 species (each containing 64 values) were compared to the
virtual CUB values in the Pan-Genomic Codon Usage Table by linear
regression analyses. The – log C values were used as a measure of similar-
ity and are indicated by horizontal bars at the right edge of the table. C:
significance of correlation. The subgroups, corresponding to larger phylo-
genetic categories, are color coded and mean values for the groups are also
indicated. The numbers of species in the subgroups are given in the
"Mean" rows.
Click here for file
[ />4682-5-16-S3.xls]
Additional file 4
CUB commitment and variation. The 64 codons in 113 species were
sorted according to the size and +/- orientation of their CUB. Some man-
ual adjustments were made to segregate the data into four approximately
symmetrical subgroups (corresponding to the color codes).
Click here for file
[ />4682-5-16-S4.xls]
Additional file 5
CUF- Pan-Genomic Codon Correlations. Codon frequencies were col-
lected from 113 Codon Usage Frequency Tables and the significances of
correlations (C, 64 × 64) were calculated. (n = 113). The table displays
the -log C values. A – sign was added to the -log C value to indicate neg-
ative correlations. Significant positive correlations (values > 2) are indi-
cated by bold numbers and gray background, while significant negative
correlations (values < -2) are indicated by italic numbers and pink back-
ground. The collected data are sorted into 4 × 4 × 3 × 3 = 144 different
subgroups corresponding to the 4 × 4 codon letter combinations and the 3
× 3 codon positions (red letters).
Click here for file
[ />4682-5-16-S5.xls]
Additional file 6
Prediction of Wobble Bases. List of correlations between the frequency of
a codon and the frequency of other codons, which contain the 4 × 4 per-
mutations of codons at the 1
st
and 2
nd
codon positions. 64 times 16 equa-
tions were calculated from these correlations. Only the strongest
correlations, those used in codon predictions, are listed and color coded.
Positive correlations are indicated by bold letter in blue background and
negative correlations are given by italic letters in pink background. F is as
defined in fig. 9.
Click here for file
[ />4682-5-16-S6.xls]
Publish with BioMed Central and every
scientist can read your work free of charge
"BioMed Central will be the most significant development for
disseminating the results of biomedical research in our lifetime."
Sir Paul Nurse, Cancer Research UK
Your research papers will be:
available free of charge to the entire biomedical community
peer reviewed and published immediately upon acceptance
cited in PubMed and archived on PubMed Central
yours — you keep the copyright
Submit your manuscript here:
/>BioMedcentral
Theoretical Biology and Medical Modelling 2008, 5:16 />Page 15 of 15
(page number not for citation purposes)
rence in yeast using a variety of models. Nucleic Acids Research
2003, 31:2242-2251.
27. Karlin S, Campbell AM, Mrazek J: Comparative DNA analysis
across diverse genomes. Annu Rev Genet 1998, 32:185-225.
28. Rocha EPC: Codon usage bias from tRNA's point of view:
redundancy, specialization, and efficient decoding for trans-
lation optimization. Genome Res 2004, 14:2279-2286.
29. Britten RJ: Forbidden synonymous substitutions in coding
regions. Mol Biol Evol 1993, 10:205-220.
30. Antezana MA, Kreitman M: The nonrandom location of synony-
mous codons suggests that reading frame-independent
forces have patterned codon preferences. J Mol Evol 1999,
49:36-43.
31. Lipman DJ, Wilbur WJ: Contextual constraints on synonymous
codon choice. J Mol Biol 1983, 163(3):363-376.
32. Ticher A, Graur D: Nucleic acid composition, codon usage, and
the rate of synonymous substitution in protein-coding genes.
J Mol Evol 1989, 28:286-298.
33. Fedorov A, Saxonov S, Gilbert W: Regularities of context-
dependent codon bias in eukaryotic genes. Nucleic Acids Res
2002, 30:1192-1197.
34. Biro JC, Benyo B, Sansom C, Szlavecz A, Fordos G, Micsik T, Benyo
Z: A common periodic table of codons and amino acids. Bio-
chem Biophys Res Commun 2003, 306:408-15.
35. Biro JC: Protein folding information in nucleic acids which is
not present in the genetic code. Ann N Y Acad Sci 2006,
1091:399-411.
36. Frank GK, Makeev VJ: G and T nucleotide contents show spe-
cie-invariant negative correlation for all three codon posi-
tions. J Biomol Struct Dyn 1997, 14:629-639.
37. Wang J: The base contents of A, C, G or U for the three codon
positions and the total coding sequences show positive cor-
relation. J Biomol Struct Dyn 1998,
16:51-57.
38. Majumdar S, Gupta SK, Sundararajan VS, Ghosh TC: Compositional
correlation studies among the three different codon posi-
tions in 12 bacterial genomes. Biochem Biophys Res Commun 1999,
266:66-71.
39. D'Onofrio G, Bernardi G: A universal compositional correlation
among codon positions. Gene 1992, 110:81-88.
40. Wada A: Compliance of genetic code with base-composition
deflecting pressure. Adv Biophys 1992, 28:135-158.
41. Gutiérrez G, Oliver JL, Marín A: Dinucleotides and G+C content
in human genes: opposite behavior of GpG, GpC, and TpC at
II-III codon positions and in introns. J Mol Evol 1993, 37:131-136.