Báo cáo y học: " Assessing drug distribution in tissues expressing P-glycoprotein through physiologically based pharmacokinetic modeling: model structure and parameters determination" pps
Bạn đang xem bản rút gọn của tài liệu. Xem và tải ngay bản đầy đủ của tài liệu tại đây (703.44 KB, 13 trang )
Theoretical Biology and Medical
Modelling
Research
Assessing drug distribution in tissues expressing P-glycoprotein
through physiologically based pharmacokinetic modeling: model
structure and parameters determination
Frédérique Fenneteau
1
, Jacques Turgeon
1
, Lucie Couture
1,2
,
Véronique Michaud
1
,JunLi
3,4
and Fahima Nekka*
1,3
Address:
1
Faculté de Pharmacie, Université de Montréal, Montréal, Québec, Canada,
2
Charles River Laboratories Preclinical Services Montr éal
Inc., Montréal, Québec, Canada,
3
Cen tre de Recherche Mathématiques, Université de Montréal, Montréal, Québec, Canada and
4
Pharsight,
Montréal, Qu ébec, Canada
E-mail: Frédérique Fenneteau - ; Jacques Turgeon - a;
Luc ie Couture - ; Véronique Michaud - ; Jun Li - ;
Fahima Nekka* - ;
*Corresponding author
Published: 15 January 2009 Received: 17 September 2008
Theoretical Biology and Medical Modelling 2009, 6:2 doi: 10.1186/1742-4682-6-2Accepted: 15 January 2009
This article is available from: />© 2009 Fenneteau et al; licen see BioMed Central Ltd.
This is an Open Access article distributed under the terms of the Creative Commons Attribution License (
/>which permits unrestricted use, distribution, and reproduction in any medium, provided the original work is properly cited.
Abstract
Background: The expression and activity of P-glycoproteins due to genetic or environmental
factors may have a significant impact on drug disposition, drug effectiveness or drug toxicity. Hence,
characterization of drug disposition over a wide range of conditi ons of these membrane
transporters activities is required to better characterize drug pharmacokinetics and pharmaco-
dynamics. This work aims to improve our understanding of the impact o f P-gp acti vity modu lation
on tissue d istribution of P-gp substrate.
Methods: A PBPK model was developed in order to examine activity and expression of P-gp
transporters in mouse brain and heart. Drug distribution in these tissues was first represented by a well-
stirred (WS) model and then refined by a mechanistic transport-based (MTB) model that includes P-gp
mediated transport of the drug. To estimate transport-related parameters, we developed an original
three-step procedure that allowed extrapolation of in vitro measurements of drug permeability to the in
vivo situation. The model simulations were compared to a limited set of data in order to assess the model
ability to reproduce the important information of drug distributions in the considered tissues.
Results: This PBPK model brings insights into the mechanism of drug distribution in non
eliminating tissues expressing P-gp. The MTB model accoun ts for the main transport mechanisms
involved in drug distribution in heart and brain. It p oints out to the pr otective role of P-gp at the
blood-brain barrier and represents th us a noticeable improvement over the WS model.
Conclusion: Being built prior to in vivo data, this approach brings an interesting alternative to
fitting procedures, and could be adapted to different drugs and transporters.
The physiological based model is novel and unique and brought effective information on drug
transporters.
Page 1 of 13
(page number not f or cit ation purposes)
BioMed Central
Open Access
Background
The most studied ATP binding cassette (ABC) membrane
transporters is the P-glycoprotein (P-gp), which is a
multidrug resistance (MDR) protein encoded by the
ATP-binding cassette B1 (ABCB1) gene. The i mportan t
role of P-gp in drug ab sorption and excretion in
intestine, kidney and liver, has been revealed through
reduction of absorption of orally administered drugs and
promotion of urinary and biliar y excretion [1, 2].
Furthermore, P-gp transporters have a regulator function
by limiting penetration of drugs in brain, heart, placenta,
ovaries, and testes tissues. This has been shown in vivo on
wild type (WT), mdr1a(-) and mdr1a/1b(-/-) knockout
(KO) mice, which are mice lacking genes encoding for
drug-transporting P-gp [3]. Indeed, higher levels of
radioactivity were measured in various tissues of simple
or double mutated mice compared to WT mice, after IV
or oral administration of different P-gp s ubstrates [3-8].
It has been demonstrated that modulation of the
expression and/or activity of these transporters due to
genetic or environmental factors may have a significant
impact on drug disposition, drug effectiveness or drug
toxicity [9-11]. Hence, characterization of drug disposi-
tion over a wide range of conditions of ABC membrane
transporters activities is required to better characterize
drug pharmacokinetics and pharmacodynamics.
Among pharmac okinetic model ing approaches, the phy-
siologically based pharmacokinetic (PBPK) approach is
now progressively used at various stages of drug discovery
and development. PBPK models are developed to predict
xenobiotic disposition t hroughout a mammalian body.
By characterizing the kinetic processes of the drug, it is
possible to predict its distribution inside tissues, organs
and fluids of the body. The whole-body PBPK model
involving tissues and organs connected via the vascular
system mimics the anatomical structure of the mammal
being studied. Generally, tissue distribution of d rugs can
be represented either by the perfusion rate limited (also
called well-stirred) model, or the permeability rate
limited model. The former assumes an instantaneous
and homogenous drug distribution in tissues, whereas
the latter represents the tissue as two or three well-stirred
compartments which are separated by a capillary and/or
cellular membrane where a permeability rate limited
transfer occurs [12]. However, the membrane perme-
ability may not be the only factor contributing towards
limitation of drug distribution within a tissue. The influx
or efflux activity of ABC transporters can be another
important factor involved in drug distribution and
should be considered as such in PBPK modeling.
In drug research and development, predicting drug disposi-
tion prior to in vivo studies is a major challenge [13]. Within
this context, the hypothesis-driven strategy adopted here is
to build a data-independent model that minimizes recourse
to data fitting and exploits in vitro data information. Indeed,
the spirit of PBPK modeling is deeply rooted in the
independence of the model building on the output data
representing the process to be described. It is based on the
integration within a whole entity of drug specific character-
istics with a structural mode which can be more or less
detailed in terms of tissues and organs to be included. As
relevant knowledge of the physiological, morphological,
and physicochemical data becomes available, the possibility
exists for efficient use of limited data in order to reasonably
describe the pharmacokinetics of specific compounds under
a variety of conditions [14]. With this in mind, the whole-
body PBPK model developed herein aims to shed light,
prior to in vivo experiments, on drug distribution in tissues
expressing P-gp transporters. For this purpose, we adopt a
step by step procedure which led us to the final PBPK model
applied to mice, which accounts for the P-gp-mediated
efflux transport in heart, and brain tissues. We first use the
WS model to represent the drug distribution in each tissue.
Then, to account for both passive and active transports, a
mechanistic transport-based (MTB) model is developed for
heart and brain. In order to estimate transport-related
parameters all the while minimizing data fitting, we
developed a method to extrapolate in vitro measurements
of drug permeability of P-gp substrates through endothelial
cells monolayers to the in vivo situation. This allowed the
estimation of those parameters related to apparent passive
and active transport of the drug through blood-tissue
membrane of brain and heart.
To appreciate the reliability of the knowledge that the
model provides in terms of elucidating the impact of the
modulation of P-gp activity on drug distribution, we had
access to WT and KO tissue concentrations of domper-
idone, an antiemetic drug associated with cardiac toxicity
[15-17]. The choice of this drug model was motivated by
previous in vitro results [18], which suggested that
domperidone could be highly transported by P-gp.
While this data set cannot be considered rich enough
to validate the developed PBPK model, it can at least
show that, the model simulations lie within realistic
values by capturing points in the main strategic regions
of the tissue concentration profiles, namely at the
maximum concentration and the elimination phase.
Methods
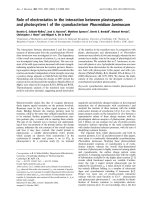
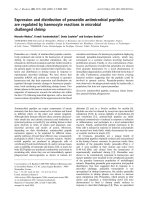
Structure o f the PBPK model
The present investigation focuses on P-gp substrate dis-
tribution in heart and brain tissue where this transporter has
a protective function. Our whole body PBPK model
included these tissues as well as core tissues, organs and
Theoretical Biology and Medical Modelling 2009, 6:2 />Page 2 of 13
(page number not f or cit ation purposes)
fluids, namely liver, arterial and venous blood, along with
the adipose tissue because of its involvement in the
disposition of lipophilic drugs. To make the model readily
usable for subsequent updates and future experimental
data, we also included bone, gut, lung, kidneys, muscle skin
and spleen in the PBPK structure (Figure 1).
The PBPK model is mathematically formulated as a set of
ordinary differential equations of mass balance that
represents the time dependent variation of the drug
concentration in each tissue. We systematically performed
an overall mass balance of the whole-body PBPK model
to assur e t hat mass conservation laws are respected.
Tissue-distribution models
The parameters used in the equations presented in this
section refer to concentration (C), volume (V), blood
flow to tissue (Q), tissue:plasma partition coefficient
(P
tp
), blood:plasma ratio (BP), unbound fraction of drug
(fu), clearance (CL), and permeability-surface area
product (PSA). The subscripts refer to cardiac output
(co), tissue (t), kidneys (k), spleen (sp), gut (g), plasma
(p), liver (li), lung (lg), heart (ht), arterial blood (ab),
venous blood (vb), blood in equilibrium with tissue
(bl), venous blood living tissue (v, t), unbound fraction
(u), bound fraction (b), intracellular water (iw), extra-
cellular water (ew), neutral lipid (nl), neutral phospho-
lipid (np), and microsomal binding (mic). Some
subscripts refer to active transport processes, such as P-
gp mediated transport (P-gp), as well as other
transporters (OT) such as influx transporters (in, OT)
and additional efflux transporters (out, OT).
Well-stirred model (WS)
At this first step of model development, the whole-body
PBPK model is based on perfusion limited model of
disposition. The uptake rate of the drug into tissues is
limited by the flow rate to tissue rather than the
diffusion rate across cell membranes [19]. In this case,
the unbound concentration of drug in tissue is in
equilibrium with the unbound drug in the outcoming
blood. The application of a WS model requires the
tissue-to-plasma partition coefficient (P
tp
) of each tissue
included in the PBPK model as input parameters. By
definition, these partition coefficients were calculated as:
P
C
T
C
p
C
ut
C
up
fu
p
fu
t
fu Kp
tp,t p u
== =⋅
(1)
where Kp
u
is the unbound tissue-to plasma partition
coefficient [20] calculated from the tissue-composition-
based approach developed by Rodgers et al. [20].
The hepatic elimination is determined from i ntrinsic
clearance (CL
int
), such as
CL
V
max P450
K
m(P450)
N
int CYP450
=
()
×
(2)
where V
max(P450)
and K
m(P450)
are the Michaelis Menten
parameters of drug biotransformation measured in mice
hepatic pooled microsomes, and N
CYP 450
(nmol) is the
amount of mice hepatic cytochrome P450.
The conventional description of hepatic extraction ratio
(E
h
) corresponds to (CL
int
*fu
p
/fu
mic
)/(CL
int
*fu
p
/fu
mic
+Q
h
) for a well-stirred liver model [21], where fu
mic
is
the fraction of drug unbound to hepatic microsomes
which can be estimated as follows for a basic drug [22]:
Fu
mic
=(C
mic
·10
0.56·LogP-1.41
+1)
-1
(3)
where C
mic
is the microsomal protein concentration (20
mg microsomal protein/mL herein), and LogP is the
octanol:water partition coefficient of the drug.
The mass balance equations of the WS model applied to
the tissues included in the PBPK model are [23]:
• no n-el imin at ing tissues:
V
dC
t
dt
QCC
t t ab v,t
×=×−
()
(4)
Mouse related parameters
Drug related parameters
Physiologic Parameter s
Metabolic
Parameters
Distr ibution
Parameters
Physico-chemical
Pr oper ties
Well-stirred models Mechanistic Tr anspor t-Based
Tissue model
Experimental data
VENOUS BLOOD
Lung
Heart
Liver
S
p
leen
Adi
p
ose
Bone
Brain
Skin
Muscle
CL
h
ARTERIAL
BLOOD
Kidne
y
s
Gut
IV injection
5mg/kg
Model
Refinement
For illustration only
Figure 1
Schematic representation of the procedures used to
develop the whole body PBPK model applied to the
mouse (30 g BW) following a 5 mg/kg IV injection of
domperidone.
Theoretical Biology and Medical Modelling 2009, 6:2 />Page 3 of 13
(page number not f or cit ation purposes)
• eliminating tissues (liver)
V
dC
li
dt
QQ Q C Q C QC
fu
p
fu
mic
CL
li li sp g ab spl v,spl g v,g
×=−−
()
×+ × +×
−
iint v,li li v,li
CQC⋅−×
(5)
where CL
int
and fu
mic
are estimated from equation 2 and
3 respectively.
• arterial blood
V
dC
ab
dt
QCC
ab co v,lg ab
×=×−
()
(6)
• venous blood
V
dC
vb
dt
QC Q C
vb t v,t
t
co vb
×= ×
()
−×
∑
(7)
• lung
V
dC
lg
dt
QCC
lg co vb v,lg
×=×−
()
(8)
with
C
x
BP
P
tp,x
where x stands for t, sp, li and lgC
v,x
=
×
.
(9)
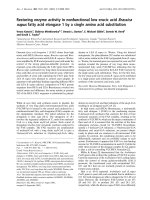
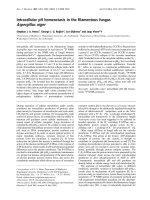
Mechanistic Transport-Based (MTB) models
We propose a transport-based tissue model to mechan-
istically investigate drug distribution in non-eliminating
tissues expressing active transporters. This tissue model
accounts for apparent passive diffusion and active
transports of the drug at the blood-tissue membrane.
Since only limited transport-related information is
available within extra-and intra-cellular space of a tissue,
it has been resumed by the transport occurring at the
capillary membrane. This choice has the advantage to
minimize the recours e to fitting procedures of transport-
related parameters that would have been required in a
three s ub-compartmental ti ssue model. Thus, we
assigned the term 'apparent' to the transport-related
parameters and divided the tissue in two well-stirred
compartments representing the vascular and extravascu-
lar tissues, s eparated by a capillary membrane where
apparent diffusi on an d apparent active transports of the
unbound drug occur. The fraction of drug unbound to
tissue was calculated from the total tissue concentration
C
T
estimated from the method developed by Rodgers
andRowland[20].Indeed,C
T
canbeexpressedinterms
of the unbound concentration in intracellular and
extracellular water, and of the drug concentration
bound to neutral lipid and phospholipids, such as [20]:
C
T
=C
u, iw
·f
iw
+C
u, ew
·f
ew
+C
b, nl
·f
nl
+C
b, np
·f
np
(10)
The unbound drug fraction in tissues (fu
t
) was calculated
by rearranging Equation 10, such as
fu
Cu
t
C
T
f
iw
Cu
iw
f
ew
Cu
ew
C
T
t
==
⋅+⋅
(11)
Remembering that Cu
ew
equals to the unbound con-
centration in plasma (Cu
p
), and Cu
iw
for a monoprotic
base is given by [20]:
Cu Cu
X
Y
iw p
=⋅
(12)
with
X=1+10
(pKa-pHiw)
(13)
Y=1+10
(pKa-pH)
(14)
Then, using equations 1, 11 and 12 , fu
t
can be e xpressed
as:
fu
f
iw
X
Y
f
ew
Kp
u
t
=
⋅
⎛
⎝
⎜
⎞
⎠
⎟
+
(15)
where f
iw
isthefractionaltissuevolumeofintracellular
water and f
ew
fractional tissue volu me of extracellular
water. We used published tissue specific data [20], and
assumed that the tissue composition in protein is the
same among rodent (Table 1).
The active tra nsports include, but are not limited to,
apparent P-gp mediated efflux of the unbound drug
from tissue to blood. This general mechanistic transport-
based model can also account for additional efflux
(CL
out, OT
)and/orinflux(CL
in, OT
) transporters. We first
only consider the contribution of apparent passive
diffusion and P -gp mediated transport in both tissues,
setting thus to 0 the terms CL
in, OT
and CL
out, OT
.The
transport-based tissue model can also be used to
investigate the involvement of additional transporters
by setting to non-zero values the parameters CL
in, OT
and
CL
out, OT
. Compared to P-gp, there is limited knowledge
for other transporte rs in terms of their activity and
expression in mammalian tissues [24]. Hence, influx
and/or efflux clearances of non P-gp transporters can be
extracted from the best fit of tissue-concentration data.
The general mass balance equations defining the
Theoretical Biology and Medical Modelling 2009, 6:2 />Page 4 of 13
(page number not f or cit ation purposes)
mechanistic transport-based model applied to he art and
brain tissues (Figure 2) are described below:
• Extravascular compartment (tissue)
V
t
PSA
t
fu
p
C
p,t
fu
t
C
t
fu
t
C
t
CL
Pgp,t
CL
out,OT
dC
t
dt
×=××−×−×× +
()
()
++× × fu
p
C
p,t
CL
in,OT
(16)
• Vascular compartment (blood)
V
bl,t
Q
t
C
ab
C
v,t
PSA
t
fu
t
C
t
fu
p
C
p,t
fu
t
dC
v, t
dt
×=×−+××−×
+
()
()
××× + − × ×
()
C
t
CL
Pgp,t
CL
out,OT
fu
p
C
p,t
CL
in,OT
(17)
Mouse-related parameters
Mouse tissue composition, tissue volume, and blood-
flow rate into tissue were ex tracted from the literature
[25-27]; they are listed in Table 1.
The total amount of hepatic cytochrome P450 in mouse,
N
CYP450
, was estimated by developing a log-log regres-
sion analysis that relates the total amount of N
CYP450
of
different mammalian species to their liver weight [28].
Distribution-related parameters required for the
MTB model
The volume of blood in equilibrium with brain and
heart tissues (V
bl, t
) and the exchange surface area of the
mouse blood-brain barrier were directly extracted from
theliterature[29-35].Surfacearea(S
t
)pergramof
cardiac tissue, only available for humans or quantifiable
from human data [36, 37], were applied to mice. As the
estimation of permeability-surface area product (PSA
t
)
and P-gp efflux (CL
P-gp, t
) clearance of a P-gp substrate
through blood-tissue membrane is a crucial information,
we have developed the following three-step procedure to
estimate these parameters for mouse brain and heart
tissue.
Step I: Estimation of in vitro diffusion and P-gp efflux rates o f a
P-gp substrate through Caco-2 monolayer
Assuming the drug is mainly transpo rted by P-gp and
used at a dose below the transporters saturation limit,
then apical to basolateral apparent permeability (P
app,
ab
) of drugs through Caco-2 monolayers results from the
difference between apparent drug diffusion velocity
Table 1: Input physiological paramet ers used in PBPK model for IV injection of domperidone to a 30 g body weight mouse.
Tissue Composition (% of wet tissue
weight) [20]
Physiological Data
Tissues Intra
Cellular
Water
Extra
Cellular
Water
Neutra l
Lipids
Phospholipids Blood Flow
Rate (% of Q
c
)
a
Volume
(% of BW)
Unbound
Fraction to
Tissue
b
Partition
Coefficient
c
(Ptp)
Adipose
d
0.017 0.1350 0.853 0.002 0.07 0.0700 0.0079 1.7258
Bone + ROB* 0.346 0.1000 0.220 0.0005 0.218 0.0799 0.0327 2.0582
Brain 0.620 0.1620 0.031 0.05 0.031 0.0165 0.0463 2.5722
Gut 0.475 0.2820 0.032 0.015 0.141 0.0253 0.0166 6.2541
Heart 0.456 0.3200 0.017 0.014 0.066 0.0038 0.0212 4.8909
Kidney 0.483 0.2730 0.0148 0.0341 0.110 0.0135 0.0104 10.019
Liver 0.573 0.1610 0.0138 0.0303 0.161 0.042 0.0120 9.2366
Lung 0.446 0.3360 0.0218 0.0162 0.005 0.0073 0.0125 8.2560
Muscle 0.630 0.0790 0.0167 0.0273 0.159 0.384 0.0290 3.9387
Skin 0.291 0.3820 0.0239
d
0.0180
d
0.058 0.1653 0.0156 5.1585
Spleen 0.579 0.2070 0.012 0.0107 0.002
c
0.0035 0.0184 6.3008
Plasma ——0.096 0.0032 ————
Arteri al blo od ———— — 0.0272
d
——
Venous blood ———— — 0.0544
d
——
a
The mouse cardiac output value was estimated from the following allometric equation: Qc = 0.235 × BW
0.75
;
b
Calculated from equation 7.
c
Calculated from equation 1 using the method of Rodgers and Rowland [20]
d
Rat value [23]; * ROB: rest of body
Figure 2
Diagrams of the mechanistic transport-based tissue
model that considers the passive transport of the
drug, the P-gp mediated efflux transpor t, additi onal
efflux transport and/or influx transport.
Theoretical Biology and Medical Modelling 2009, 6:2 />Page 5 of 13
(page number not f or cit ation purposes)
(P
diff, in-vitro
) and apparent P-gp efflux rate (P
P-gp, in-vitro
).
Basolateral to apical apparent permeability (P
app, ba
)is
the result of the addit ive action of the drug diffusion
velocity along with P-gp efflux transport. Assuming that
P-gp efflux rate is independent of the direction of
diffusion, the in vitro estimation of the parameters of
apparent drug diffusion and apparent P-gp efflux rates
(P
diff, in-vitro
and P
P-gp, in-vitro
) are calculated as follows:
P
diff, in-vitro
P
app, ba
P
app, ab
1
2
=+
()
(18)
P
Pgp, in-vitro
P
app, ba
P
app, ab
1
2
=−
()
(19)
where P
app, ba
and P
app, a b
values can be either directly
measured through Caco-2 cells monolayers, or extracted
from the literature.
Step II: In vitro-in vivo extrapolation of drug diffusion velocity and
P-gp efflux rate parameters
We extrapolated in vitro P-gp efflux rate and diffusion
velocity of P-gp substrates to the in vivo situation (Table 2),
applying linear regressions procedures to data published by
Collett et al. [38]. Some data presented in Table 2 are also
extracted literature [39-45].
The authors measured P
app, ba
and P
app, ab
of some drugs
through Caco-2 cells monolayer as well as P
app, ab
in the
presence of a P-gp inhibitor (GF 120918). They
determined the Michaelis-Menten kinetic parameters of
active efflux transport, V
max(efflux)
and K
m(efflux)
,ofthese
drugs. Moreover, t hey compared oral plasma area under
the curve (AUC) of these compounds in WT and KO
mice. In order to consider only the eff ect of P-gp on
intestinal absor ption of drugs, we corrected the r ati o of
drug AUC
oral
between species by removing the eff ect of
P-gp involved i n renal and biliary cl earance on AUC
oral
.
We first estimated the effect (E
IV-P-gp
) of the abs enc e of
P-gp on AUC
IV
measured after IV injection, such as:
E
IV
-
P-gp
=(AUC
iv(KO)
-AUC
iv(WT)
)/AUC
iv(KO)
.(20)
Then, the corrected ratio of oral AUC between both mice
strainsiscalculatedasfollows:
RAUC
oral, corr
=AUC
oral, KO, corr
/AUC
oral, WT
,=E
IV-Pgp
×
AUC
oral, KO,
/AUC
oral, WT
(21)
This ratio reflects the effect of P-gp mediated efflux in gut
absorption:
R
AUCcorr
AUC
oral, KO, corr
AUC
oral,WT
Fabs
KO
Fabs
WT
P
diff,
=≈≈
iin-vivo
P
diff, in-vivo
P
Pgp, in-vivo
−
(22)
where F
abs
is the fraction of absorbed drug through the
gastro-intestinal tract.
Then, we estimated in vivo diffusion velocity of these
P-gp substrates through gut membrane from R
AUC, corr
value that we mechanistically approximated as follows:
P
diff, in-vivo
Pgp, in-vivo
R
AUCcorr
R
AUCcorr
1
P
R
AUCcorr
R
A
≈≅
−
×
UUCcorr
1
V
max P-gp
K
m P-gp
−
×
()
()
(23)
where P
P-gp, vivo
is approx imated by the ratio V
max
(P-gp)/
K
m
(P-gp).
Table 2: Related parameters of the P- gp substrates u sed to establish linear regressions allowing the in vitro-in vivo extrapolation o f
diffusi on and P-gp mediated effl ux rates . Data were extracted from Collett an d co workers [38].
Drug
Name
MW LogP Papp
ab
a, c
cm/s
Papp
ba
a, c
cm/s
V
max(P-gp)
/
K
m(P-gp)
a, c
cm/s
Pdiff
vitro
cm/s
Pdiff
vivo
b
cm/s
P
P-gp, vitro
cm/s
RAUC
corr
b
Ref
Paclitaxel 854 3 2.1 × 10
-6
8.61 × 10
-6
2.1 × 10
-5
5.36 × 10
-6
3.04 × 10
-5
3.26 × 10
-6
3.26 [38, 39]
Digoxin 789 2.2 1.1 × 10
-6
7.15 × 10
-6
1.3 × 10
-5
4.13 × 10
-6
3.08 × 10
-5
3.03 × 10
-6
1.03 [38, 40]
Saquinavir 670 3.8 2.2 × 10
-6
1.21 × 10
-5
2.3 × 10
-5
7.15 × 10
-6
2.77 × 10
-5
4.95 × 10
-6
6.5 [38, 41]
Topotecan 421 0.8 1 × 10
-6
3.5 × 10
-6
1.2 × 10
-5
2.25 × 10
-6
2.35 × 10
-5
1.25 × 10
-6
2* [38, 42]
Verapamil 454 4.7 1.5 × 10
-5
1.5 × 10
-5
0* 1.5 × 10
-5
NA 0* NA [38, 43]
Talinolol 363.5 2.9 1.5 × 10
-6
1.5 × 10
-5
1.5 × 10
-5
6.0 × 10
-6
NA 4.50 × 10
-6
NA [38, 42, 43, 45]
Rifampicin 822 2.7 2.0 × 10
-6
8.4 × 10
-6
2.2 × 10
-5
5.2 × 10
-6
NA 3.20 × 10
-6
NA [38, 42, 43]
UK
224,671
544 1.8 3.0 × 10
-7
8.4 × 10
-6
9.1 × 10
-6
3.2 × 10
-6
9.43 × 10
-6
2.88 × 10
-6
32** [38, 42, 45]
a
In Caco-2 experiments, the used drug concentration reported in Collett and coworkers [38] are 7.5 μM for saquinavir, 20 μM for verapamil and
rifampicin, 30 μM for paclitaxel and digoxin, 40 μM for topotecan, talinolol and UK 224,671
b
In in vivo experiments, the dose administered to mice reported in Collett and coworkers [38] are 10 mg/kg of paclitaxel, 0.2 mg/kg of digoxin,
5 mg/kg of saquinavir and rifampicin, 2 mg/kg of UK 224,671, and 1 mg/kg of topotecan. Doses of verapamil and talinolol were not available.
c
pH 7.5 used in Caco-2 experiments [38]
* No secretion; ** assuming that RAUC reflects plasma ratio [38]
Theoretical Biology and Medical Modelling 2009, 6:2 />Page 6 of 13
(page number not f or cit ation purposes)
We used the reported in vitro values of P
app, a -b
and
P
app, b-a
, obtained in the presence and absence of P-gp
inhibitor, to estimate P
diff, in-vitro
and P
P-gp, in-vitro
for each
compound. Then, using S-Plus
®
, we assessed the correla-
tions betwee n in vi vo V
max(P-gp)
/K
m(P-gp)
and P
P-gp, in-vitro
,
and between P
diff, in-vivo
and P
diff, in-vitro
values of the
drugs. These correlations are used to estimate apparent in
vivo efflux rate of domperidone f rom P
P-gp, in-vitro
calculated in Step I.
As the tight junctions of the epithelium of the BBB
contribute to the reduction of drug diffusion through
this membrane, the diffusion velocity of the P-gp
substrate under study through BBB was not estimated
frommeasurementofapparentpermeabilitythrough
Caco-2 cells, but from in vitro measurementofits
permeability through bovine brain capillary endothelial
cells monolayer. This permeability value has been
assigned a weight factor of 150, as suggested by
Pardridge and coworkers [46] for in vitro permeability
compared to in vivo permeability values measured
in rats.
Step III: Calculation of the permeability-surface area product (PSAt)
and P-gp-mediated efflux clearance (CL
P-gp, t
) of the P-gp substrate
into mice brain and heart
The P-gp mediated efflux clearance has been found to be
tissue-dependent [47]. Thus, P-gp expression levels in
various tissues of WT mice [6] were used in our work to
account for this tissue specificity. Since the Caco-2 cells
line derives from human colon carcinoma and its
characteristics are similar to intestinal epithelial cells,
the intestinal tissue was chosen as the reference tissue for
P-gpexpressionlevel.Ineachoftheothermicetissues,
the P-gp expression level has been estimated as a fraction
of mice intestine P-gp expression (F
P-gp, t
,) and presented
in Table 3 [6 ]. We estim ated CL
P-gp, t
,andPSA
t
both
expressed in L/min:
CL
Pgp, t
S
t
F
Pgp, t
V
max P-gp
K
m P-gp
=××
()
()
(24)
PSA
t
=P
diff, in-vivo
×S
t
(25)
Assessing drug distribution in tissues express ing P-g p
To investigate the ability of the developed PBPK model
to assess the i mpact of P-gp a ctivity modulation, we used
tissue concentration of
3
H-domperidone measured in
adult male FVB WT and mdr1a/1b (-/-) KO mice after an
IV injection at the target dose of 5 mg/kg. Blood, plasma,
cerebral and cardiac tis sue concentrations were available
at 4 and 120 min post dose, while WT liver concentra-
tions were available at 4, 7, 15, 30, 60 and 120 min post-
dose. While the accessible data set in heart and brain
tissues was limited in terms of the number of time
points, it had the potential of asserting the quality of the
model in those most str ategic and informa tive regions of
the lineshape, ie, near the peak concentration and at the
elimination phase. We have also exploited a full data set
available for WT liver to encompass the important aspect
of hepatic disposition. The domperidone physicochem-
ical characteristics required as input parameters to the
model are ex tracted from literature [48-50]and presented
in Table 4.
Results
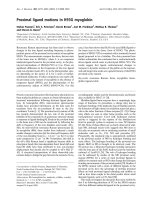
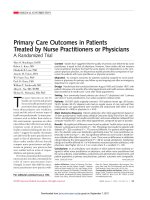
Estimation of metabolic parameters
Since the drug was administered intravenously, t he liver
was considered as the only site of clearance by
metabolism. We extrapolated N
CYP 450
to a value of 14
nmol for a 30 g BW mouse from the log-log regression
calculated from published data [28] and presented in
Figure 3. The kinetic parameters of domperidone
biotransformation, K
m(P450)
and V
max(P450)
,wereesti-
matedto130μM and 4.6 nmol/nmolP450/min,
respectively.
Table 3: Additional physiological parameters required for the MTB tissue models applied to brain and heart.
Tissue V
bl
a
(mL/100 g tissue) S
t
b
(dm
2
/g tissue) F
P-gp, t
c
(-) Cl
P-gp, t
d
(L/min) PSA
t
e
(L/min) Cl
out, OT
f
(L/min)
Brain 2
g
2
h
0.42 3.71 × 10
-4
3.56 × 10
-5
2.8 × 10
-4
Heart 20
i
11.8
j
0.26 2.61 × 10
-4
1.2 × 10
-3
—
a
Volume of blood in equilibrium with tissue
b
Exchange surface area
c
Relative fraction of mdr1a/1b m RNA expression in mice tissues compared to that in intestin e, calculated from published data[6]. We calculated the
ratio of multidrug resistance PCR product to that of b-actin in each organ and we related these ratios to that obtained in mice intestine tissue.
d
P-gp efflux clearance
e
Permeability-Surface area product
f
Parameter fitted to in vivo tissue concentrations
g
Intermediate value of published values: 1.6 uL/g brain [29]; 0.94 ug/g [30]; 3 ug/g [31]
h
Intermediate value of those published (1.50–2.40 dm
2
/g tissue) [32, 33]
i
Rat value [34]. Same ratio was found in guinea pigs [35]
j
Human data applied to mice: Surface area of cardiac capill aries [36]
Theoretical Biology and Medical Modelling 2009, 6:2 />Page 7 of 13
(page number not f or cit ation purposes)
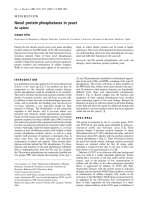
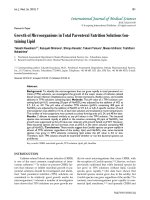
Estimation of distribution parameters for WS and
MTB models
The tissue-to-plasma partition coefficients of domper-
idone determined by the tissue-composition-based-
approach [20] are listed in Table 1. Results of the
three-step procedure developed above to estimate PSA
t
and CL
P-gp, t
rates of domperidone t hrough blood-tissue
membrane are presented in Figure 4. Positive linear
correlations (V
max(P-gp)
/K
m(P-gp)
=4.75×P
P-gp, in-vitro
,
R
2
= 0.92, no intercept, S-Plus
®
) were found between
V
max(P-gp)
/K
m(P-gp)
and P
P-gp, in-vitro
as well as between
P
diff, in-vivo
and P
diff, in-vitro
.(P
diff, in-vivo
=5.1×P
diff, in-vitro
,
R
2
= 0.89, no intercept, S-Plus
®
). These correlations were
used to estimate P
diff, in-vivo
and V
max(P-gp)
/K
m(P-gp)
of
domperidone from P
P-gp, in-vitro
and P
diff, in-vitro
calculated
in Step I. Finally, the third step gave rise to values of
PSA
t
,andCL
P-gp, t
that we reported in Table 2 along with
values of S
t
and F
P-gp, t
.
WS Model
The concentration-time profiles of domperidone simu-
lated in tissues using the WS model are presented in
Figure 5. Only tissues for whic h expe rimental data were
available are shown. The WS model successfully simu-
lated the time-concentration profile of domperidone in
hepatic tissue, indicating that the drug disposition in the
main eliminating organ was adequately characterized.
However, the WS model tends to overestimate domper-
idone concentr ations in heart and brain ti ssues, which is
likely to be related t o a poor estimation of tissue-to-
plasma partit ion coefficients for these tissues. The most
important over-prediction of drug concentration is
Table 4: Physico-chemica l parameters of domperidone
Physico-chemical parameters Values References
Molecular weight 426 [48]
pKa 7.89 [48]
Octanol-Water partition coefficient (LogP) 3.35 EPIsuite [49]
Olive oil:water partition coefficient (LogP') 1.77
a
[27]
Fraction unbound to plasma protein (fu
p
) 0.08 [50]
Blood:plasma ratio (BP) 0.92 [50]
a
Calculated from LogP' = (1.115 × LogP-1.35) [27]
Ln(N
CYP450
) = 0.7670 Ln(BW) + 5.3030
R
2
= 0.9519
p<0.0001
0
2
4
6
8
10
12
-2 -1 0 1 2 3 4 5 6
Ln(BW)
Ln(N
CYP450
)
Cattle
Sheep
Goat
Pig
RabbitRat
Figure 3
Log-Log relationship bet ween the amount of hepatic
CYP450 and the body weight of various mammalian
species. Data from Craigmill et al., 2002 [28].
STEP III
Calculation of permeability-surface area product
and P-gp efflux rate (L/min) for various tissues:
Cl
P-gp,t
= V
max(P -gp)
/K
m(P-gp)
F
P-gp,t
PSA
t
= P
diff, in vivo
S
t
S
t
IN VIVO
IN VITRO
STEP II
Estimation of the in vitro-in vivo correlation for
the estimation of diffusion velocity of drugs
(dm/min) through intestine membrane of mice.
Data collected from Collett et al. [33]
P
diff, in vivo
= a
2
. P
diff,in vitro
,
with a
2
=5.1 ± 0.91
STEP II
Estimation of the in vitro-in vivo correlation for
the estimation of P-gp efflux rate of drugs
(dm/min) through intestine membrane of mice.
Data collected from Collett et al. [33]
V
max(P-gp)
/K
m(P-gp)
= a
1
P
P-gp,in vitro
,
with a
1
= 4.75 ± 0.52
STEP I
Estimation of in vitro diffusion velocity and P-gp
efflux rate of domperidone through Caco-2 cells
a)
from measurements of P
app,a-b
and P
app, b-a
[18]
P
diff, in vitro
= (P
app, b-a
+P
app, a-b
)/2 =1.65 10
-4
dm/min
P
P-gp,in vitro
= (P
app, b-a
- P
app a-b
)/2 =1.57 10
-4
dm/min
a)
p
H
g
radient from 6.5 to 7.4
In vivo diffusion velocity of
domperidone through
mouse intestine membrane
P
diff, in vivo
=
8.
4
10
-4
dm/min
Expression level of P-gp
into various tissues
relatively to gut tissue:
F
P-gp,t
(%)
(
See Table 3
)
Exchange surface area of
blood-tissue membranes
expressing P-gp:
S
t
(dm
2
)
(See Table 3)
In vivo P-gp efflux rate of
domperidone through mouse
intestine membrane
V
max(P-gp)
/K
m(P-gp)
=
7.5
10
-4
dm /min
Figure 4
Illustration of the three-ste p procedure developed to
estimate in vivo apparent diffusion and P-gp ef flux
rates of domperidone thr ough capillary membrane of
the mouse brain and heart.
Figure 5
Prediction of tissue concentration of domperidone
using the WS model (black line) in any tissue/organ
included in the PBPK model. Tissue concentration
measured in WT mice (black l ozenge) and KO mice (black
circle) after IV ad ministration of 5 mg/kg of domperidone.
BLQ = Below Limit of Quantification.
Theoretical Biology and Medical Modelling 2009, 6:2 />Page 8 of 13
(page number not f or cit ation purposes)
obtained in brain tissue. The predicted peak concentra-
tion in this tissue, regardless of the mice strain, was 8.5
mg/L, compared to a maximum measured concentration
less than 0.03 mg/L and 0.22 mg/L, for WT mouse and
KO mouse, respectively. As, by definition, this model is
not suited to account for both active and passive
transport mechanisms effect on drug distribution, a
MTB model is applied to heart and brain tissues.
MTB Models: Accounting only for P-gp Efflux Activity in
Heart and Brain
P-gp has a protective function by limiting drug accumu-
lation into heart and brain tissues [1, 2]. Therefore, we
applied the MTB model to these tissues, and th e WS
model to all other tissues. The PBPK simulation results
are illustrated in Figure 6. While the simulated effect of
P-gp tends to be slightly lower than the observed one,
the MTB model captures the peak concentration of
domperidone for both mice strains in heart tissue. These
results suggest that the apparent di ffusion, rather t han
active transport, is the main transport mechanism of
drug distribution in heart tissue. The MTB model
significantly improves the WS model results in brain
tissue, but it still tends to overestimate domperidone
terminal concentration. I n light of the above results, we
were tempted to consider involvement of additional
efflux membrane transporters in domperidone distribu-
tion in brain tissue (Figure 7). We derived its efflux
clearance CL
out, O
by keeping diffusion and P-gp-
mediated efflux parameters identical to those used for
the brain MTB model while varying Cl
out, OT
parameter
in order to fit simulated profiles to the available brain
concentrations. In this case, the simulated concentration-
time curves capture those terminal time points measured
in brain tissue of both mice strains, but fail to reproduce
the time-point concentration at 2 min post-dose. The
trend of drug concentration profile in brain tissue
simulated in the absence of P-gp activity but in the
presence of additional efflux transporter is now in
accordance with in vivo data (Figure 7, dashed line).
When compared to the WS model simulations, these
results suggest that the apparent passive and active
transport mechanisms are limiting processes of drug
distribution in brain tissue.
The PBPK model that has been retained at the end of the
modeling process comprises the MTB model for heart
and brain tissues, and the WS model for all other tissues.
Whenappliedtohearttissue,theMTBmodelinvolves
apparent passive diffusion and P-gp-mediated trans-
ports. For brain, the MTB model involves apparent
passive diffusion, P-gp mediated transports and a
potential additional efflux transport. However, this
assumption should be further studied through a sensi-
tivity analysis and additional in vitro and in vivo
experiments.
Discussion
The whole-body PBPK model developed herein aimed to
shed light, prior to in vivo experiments, on drug
distribution in tissues exp ressing ABC transporter s, by
Figure 6
Prediction of t issue concentration of domperidone in
WT (black line) and KO (black dashed line) mice
using the mechanistic transport based tissue model
withpassiveandP-gpmediatedeffluxtransportsfor
heart and brain. T issue c oncentration measured in WT
mice (black lozenge) and KO mice (black circle) after IV
administration of 5 mg/kg of domperidone. BLQ = Below
Limit of Q uantification.
Theoretical Biology and Medical Modelling 2009, 6:2 />Page 9 of 13
(page number not f or cit ation purposes)
including apparent active and passive transport pro-
cesses. The model integrates the latest knowledge on the
most studied ABC membrane transporters expressed in
various tissues and organs. T his is done b y extrapolating
in vitro drug permeability measurements across cells
monolayers to in vivo conditions. This was performed
with a three-step procedure proposed and developed
herein, which allowed the estimation of the drug
transport-related parameters without having recourse to
data fitting. The proposed approach has to be used and
interpreted wit h some caution in terms of the considered
hypothesis and extrapolations. First, additional to P-gp,
Caco-2 system can also express other transporters such as
MRPandOATPs[51,52].Hence,thein vitro estimated
active transport rate may include the contribution of
these additional transporters. However, it may be
possible to isolate the effect of P-gp by adding a specific
P-gp inhibitor, when performing Caco-2 experiments.
Moreover, we have performed the in vitro-in vivo
regression analysis of apparent diffusion and efflux
transportbyusingarestricteddataset[38].Once
additional information r egarding Caco-2 essays and
in vivo experiments using KO and WT mice becomes
available for addit ional compounds, the qu ality and
robustness of this analysis can be improved, reducing
thus the uncertainty pertaining to the extrapolation
procedure outside the range of permeability and drug
efflux used for the correlation.
This study focused on the mechanisms of drug distribu-
tion in non-eliminating tissues expressing P-gp trans-
porters, namely brain and heart. It was also prompted by
the need to improve the ability of the PBPK approach to
predict the impact of P-gp activity modulation on tissue
distribution of P-gp substrates. Indeed, while the c linical
importance of cardio-active agents in terms of efficacy
and toxicity is well acknowledged, kinetics of drug
transport into the myocardium has drawn little attention
so far. Since many cardiovascular active compounds are
subject to drug transpor t by ABC transporters, their
expression in heart may strongly influence therapeutic or
cardiotoxic effect s [24]. However, the protective function
of P-gp in heart tissue was not obvious from the present
results.
Moreover, the multiplicity of drug transporters along
with their complex nature at the BBB prevent a better
understanding of the penetration mechanism of lipo-
philic comp ounds through this barrier [53]. Few
physiologically b ased models have been developed to
characterize drug distribution in brain tissues, mainly
because of the complex anatomy of the central nervous
system and the unavailability of physiological para-
meters [54, 55]. Whereas the mechanisms involved in
drug disposition into brain are not fully understood,
some authors [56] have raised the potential benefit of
using physiologically based compartment models to
determine the rate of entry of drugs into and their
distribution over the br ain compartment. The proposed
PBPK model pointed out to the protective function of P-
gp against drug accumulation, which effect adds to the
existing passive transport at the BBB.
So far, standard PBPK mo dels have been generally
composed of compartments that assume perfusion-rate
limited (WS), permeabili ty-rate l imit ed, or someti mes,
dispersion-rate limited models, the latter h ave not been
discussed here. The WS principle was applied in this
work as a first approximation model of drug distribution
in each tissue included in our PBPK model. The main
drawback of the WS model is its inability to capture the
effect of transporters activity on P-gp substrate disposi-
tion. In such a case, its application can underpredict or
overpredict drug concentration in target tissues [23]. This
has been confirmed in the present study where the main
deviation between the model predictions and the
measured concentration of domperidone was observed
in the brain tissue. This deviation can be attributed to the
bias in the estimated brain-to-plasma partition coef fi-
cient value [26] since this coefficient does not account
for active transport processes. Indeed, a significant
Figure 7
Prediction o f brain concentration of domperidone in
WT (black line) and KO (black dashed line) mice
using the MTB tissue model with passive transport,
P-gp mediated efflux transport and additional efflux
transport model for brain. Tissue concentration
measured in WT mice (black lozenge) and KO m ice (black
circle) after IV administration of 5 mg/kg of domperidone.
BLQ = Below Limit of Quantification.
Theoretical Biology and Medical Modelling 2009, 6:2 />Page 10 of 13
(page number not f or cit ation purposes)
overestimation of this parameter has already been
noticedforanotherP-gpsubstrate,diazepam[23],and
this bias translated into an overestimation of the brain
concentration-time profile by at least a factor of three.
However, this has neither been observed for ethoxyben-
zamide, a non-P-gp substrate, nor for propranolol [23], a
P-gp substrate [5 7]. In the case of propranolol, P-gp w as
probably saturated [58, 59] at the concentrations used
[23], such that the diffusion process prevails on P-gp
efflux transport. All this suggests that the WS model does
not adequately describe disposition of P-gp substrate
drugs in tissues where P-gp, when not saturated, have a
significant protective function. Hence, it is natural to
consider transport-based mechanisms as the next step in
modeling domperidone distribution within the brain.
These transport mechanisms can occur at the capillary or
at the cellular membrane [12]. The cellular l evel of tissue
subdivision can be used to investigate the impact of
transporters activity modulation in drug distribution by
including an influx/efflux clearance term at the cellular
membrane [60]. However, this cellular subdivision asks
for an increased amoun t of informat ion which is rarely
accessible w ithout recurring to fitting procedures [12,
60]. In the proposed MTB model, we divided non-
eliminating tissues in two s ub-compartments separated
by the capillary membrane, where apparent passive
diffusion and active transports occur, minimizing thus
physiological information needed for passive and P-gp
mediated active transports. This approach brings addi-
tional informative elements around the mechanisms
involved in drug distribution within n on eliminating
tissues expressing P-gp.
Conclusion
This paper was devoted to set up the fundam ental
mechanisms underlying distribution of drugs when
active transporters are involved. The latest knowledge
on P-gp trans porters in heart an d brain has b een
integrated. The proposed PBPK model has been defined
for a mouse with average physiologic parameters,
extrapolated within species and using in vitro-in vivo
correlations. The next logical step in this process of
model development will be to explore the behaviour of
this PBPK model in terms of uncertainty and variability
of its parameters. With the prog ress in acquiring
quantitative knowledge on transporters, the procedure
proposed in this work could be adapted for different
drugs and transporters by taking into account their
intrinsic characteristics.
Abbreviations
The abbreviations of the parameters used herein refer to:
(ABC transporters): ATP Binding Cassette Transporters;
(BBB): blood-brain barrier; (BP): blood-plasma ratio;
(BW in g): Body weight; (C in mg/L): drug concentration;
(CL in L/min): clearance; (CYP450): cytochrome P450;
(Eh): hepatic extraction coefficient; (F): fraction of
expression level of a transporter in a tissue; (fu):
unbound fraction o f drug; (Km in μM): affinity constan t;
(KO): knockout-mice; (MTB): mechanistic transport-
based model; (N
CYP450
in nmol): amount of cytochrome
P450; (P
app, ab
in dm/min): apical to basolateral
apparent permeability through the Caco-2 monolayer;
(P
app, ba
in dm/min): basolateral to apical apparent
permeability through the Caco-2 monolayer; (PBPK):
physiologically based pharmacokinetic; (P
diff, invitro
in
dm/min): in vitro diffusion velocity of the drug through
the Caco-2 monolayer; (P-gp): P-glycoprotein; (P
P-gp,
invitro
in dm/min): in vitro P-gp efflux rate; (P
tp
): tissue-
plasma partition coefficient; (PSA in L/min): perme-
ability-surface area product; (Q in L/min): blood flow;
(R
AUC, corr
): ratio of corrected plasma AUC measure-
ments between WT and KO mice; (S
t
in dm
2
): exchange
surface area separating vascular space from extravascular
space; (V in L): volume; (V
max(P450)
in nmol/nmolP450/
min): maximum velocity of CYP450 biotransformation;
(V
max(P-gp)
in nmol/hr/cm
2
): maximum velocit y of P-gp
mediated efflux; (WS) : well-stirred model; (WT): wild-
type mice; The subscripts used refer to: (ab): arterial
blood; (g): gut; (li): liver; (lg): lung; (ht): heart; (k):
kidneys; (sp): spleen; venous (vb): blood; (p): plasma;
(t): tissue; (bl, t ): blood in equilibrium with tissue; (in,
OT): other influx transporters; (out, OT): other efflux
transporters; (int): intrinsic clearance; (mic):
microsome s.
Competing interests
The authors declare that they have no competing
interests.
Authors' contributions
FF has conducted the whole study including the results,
outline, writing, and editing of the manuscript. The
conception of this work has been conducted under
themainsupervisionofFNwhohasbeeninvolvedin
the writing and revising this paper for its intellectual
content. JT assured the co-supervision and access to
experimental data collected on WT and KO mice, mainly
provided by LC. VM contributed to measurement of
Michaelis-Menten parameters of domperidone biotrans-
formation in mice liver microsomes. JL contributed to
the crit ic of the results an d contents.
Acknowledgements
This wor k has bee n supported by FRSQ and FQRNT grants held by
Frederique Fennete au. The Mathematical Centre of Excellence (MITACS)
is also acknowledged for their support. Financial support of the NSERC i s
held by Dr. Fahima Nekka.
Theoretical Biology and Medical Modelling 2009, 6:2 />Page 11 of 13
(page number not f or cit ation purposes)
References
1. Ayrton A and Morgan P: Role of transport proteins in drug
absorption, distribution and excretion. Xeno biot ica 2001,
31:469–497.
2. Fromm MF: Importance of P-glyco protein for drug disposition
in humans. Eur J Clin Invest 2003, 33:6–9.
3. Schinkel A H, Mayer U, Wagenaar E, Mol CAAM, van Deemter L,
Smit JJM, Valk van der MA, Voordouw AC, Spits H, van Tellingen O,
Zilmans JMJM, Fibbe WE and Borst P: Normal viability and
altered pharmacokine tics in mice lacking mdr1-type (drug
tra nsporting) P-glycopro teins. Proc Natl Acad Sci 1997, 94:4028–
4033.
4. Schinkel AH, Smit JJ, van Tellingen O, Beijnen J, Wagenaar E, van
Deemter L, Mol CA, Valk van der MA, Robanus-Maandag EC and te
Riele HP, et al: Disruption of the mouse mdr1a P-glycoprotein
gen e to a deficiency in the bloo d-brain barrier and to
increased sensitivity to drugs. Cell 1994, 77:491–502.
5. van Asperen J, van Tellingen O, Tijssen F, Schinkel AH and Beijnen J:
Increased accum ulation of doxorubicin and doxorubicinol in
cardiac tissue of mice lacking mdr1a P-glycoprotein. Br J
Cancer 1999, 79:108–113.
6. MuramatsuT,JohnsonDR,FinchRA,JohnsonLK,LeffertJJ,LinZP,
Pizzorno G and Sartorelli AC: Age-related differences i n
vincristine toxicity and biodistribution in wild-type and
tra nsporter-deficient mice. Oncol Res 2004, 14:331–343.
7. Schinkel A H, Mol CA, Wagenaar E, van Deemter L, Smit JJ and
Borst P: Multidrug resistance a nd the role of P-glycoprotein
knockout mice. Eur J Cancer 1995, 31A:1295–8.
8. Schinkel AH, Wagenaar E, van Deemter L, Mol CA and Borst P:
Absence of the mdr1a P-Glycoprotein in mice affects tissue
distribution and pharmacokinetics of d examethasone,
digoxin, and cyclosporin A. JClinInvest1995, 96:1698–705.
9. Greenblatt DJ and von Moltke LL: Interact ion of warfarin with
drugs, natural substances, and foods. J Clin Pharmacol 2005,
45:127–132.
10. McCabe BJ: Prevention of food-drug interactions with special
emphasis on older adults. Curr Opin Clin Nutr Metab Care 2004,
7:21
–26.
11. Harris RZ, Jang GR and Tsunoda S: Dietary effects on drug
metabolism and t ransport. Clin Pharmacokinet 2003, 42:1071–
1088.
12. Ne s t o rov I: Whole Body Pharmacokinetic Models. Clin
Pharmacokinet 2003, 42:883–908.
13. Luttringer O, Theil F, Poulin P, Schmitt-Hoffmann A, Guentert T and
Lave T: Physiologically Based Pharmacokinetic (PBPK)
Modeling of Dispposition of E piroprim in Humans. J Pharm
Sci 2003, 92:1990–2007.
14. Rowland M, Balant L and Peck C: Physiologically based
pharmacokinetics in drug development and regulatory
science: a workshop report (Georgetown Unive rsity,
Was hington, DC, May 29–30, 2002 ). AAPS PharmSci 2004, 6:E6.
15. Cameron HA, Reyntjens AJ and Lake-Bakaar G: Cardiac arrest
aft er treatment with intravenous domperidone. Br Med J
1985, 290:160.
16. Quinn N, Parkes D, Jackson G and Upward J: Cardiotoxicity of
domperidone. lancet 1985.
17. Osborne RJ, Slevin ML, Hunter RW and Hamer J: Cardiotoxicity of
intravenous domperidone. Lancet 1985, 385.
18. Faassen F, Vogel G, Spanings H and Vromans H: Caco -2
permeability, P-glycoprotein transport ratios and brain
penetration of heterocyclic drugs. Int J Pharm 2003, 263:113–
122.
19. Pang KS and Rowland M: Hepatic clearance of drugs. I.
Theoretical considerations of a "wel l-stirre d" model and a
"parallel tube" model. Influen ce of hepatic blood flow,
plasma and blood cell binding, and the hepatocellular
enz ymatic activit y on hepatic drug clearance. J Pharmacokinet
Biopharm 1977, 5:625–53.
20. Rodgers T, Leahy D and Rowland M: Physiologically based
pharmacokinetic modeling 1: predicting the tissue distribu-
tion of moderate-to-strong bases. J Pharm Sci 2005, 94:1259–76.
21. Obach RS: Prediction of human clea rance of twenty-nine
drugs from hepatic microsomal intrinsic clear ance data: an
examination of in vitro half-life approach and non specific
binding to microsomes. Drug Met Disp 1999, 27:1350–1359.
22. Austin RP, Barton P, Cockroft SL, Wenlock MC and Riley RJ: Th e
influen ce of nonspecific micro somal binding on apparent
intrinsic clearance, and its prediction from physicochemical
properties. Drug Metab Dispos 2002, 30:1497–503.
23. Poul in P and Theil F: Prediction of Pharmacokinetics prior to
in Vivo Studies. II. Generic Physiolog ically Based Pharma-
cokinetic Models of Drug Disposition . J Pharm Sci 2002,
91:1358–1370.
24. Couture L, Nash JA and Turgeon J: The ATP-binding cassette
tra nsporters and their implication in drug disposition: a
special look at the heart. Pharmacol Rev 2006 , 58:244– 258.
25. Brown RP, Delp MD, Lindstedt SL, Rhomberg LR and Beliles RP:
Physiologically parameter values for physiologically based
pharmacokinetic models. Toxicol Ind Health 1997, 13:407–483.
26. Poulin P and Theil F: A priori Prediction of Tissue:Plasma
Partition Coefficients of Drugs to Facil itate the Use of
Physiologically-Based Pharmacokinetic Models in Drug
Discovery. J Pharm Sci 2000, 89:16–35.
27. Poulin P, Schoenlein K and Theil F: Prediction of Adipose Tissue:
Plasma Partition Coefficients for Structurally Unrelated
Drugs. J Pharm Sci 2001, 90:436–447.
28. Craigmill AL and Cortright KA: Interspecies considerations in
the evaluation of human food safet y for veterinary drugs .
AAPS Pharm Sci 2002, 4:E34.
29. Cisterni no S, Mer cier C, Bourasset F, Roux F and Scherrmann JM:
Expression, up-regulation, and transport activity of the
mul tidrug-resistance protein Abcg2 at the mouse blood-
brain barrier. C ancer Res 2004, 64:3296–3301.
30. Park S and Sinko PJ: P-g lycoprotein and mutlidrug resistance-
associated proteins limit the brain uptake of saquinavir in
mice. J Pharmacol Exp Ther 2005, 312:1249–56.
31. Kaliss N and Pressman D: Pla sma and blood volumes of mouse
organs, as determined with radioactive iodop roteins. Proc So c
Exp Biol Med 1950, 75:16–20.
32. Pan W and Kastin AJ: Upregulat ion of the transport system for
TNFalpha at the blood-brain barrier. Arch Physiol Biochem 2001,
109:350
–3.
33. Garberg P, Ball M, Borg N, Cecchelli R, Fenart L, Hurst RD,
Lindmark T, Mabondzo A, Nilsson JE, Raub TJ, Stanimirovic D,
Terasaki T, Oberg JO and Osterberg T: In vitro models for t he
blood-brain barrier. Toxicol In Vitro 2005, 19:299–334.
34. Khor S, Bozigian H and Mayersohn M: Potential error in the
measurement of tissue to blood distribution coefficients in
physiological pharmacokinetic modeling. Residual tissue
blood. II. Distribution of phencyclidine in the rat . Drug
Metab Dispos 1991, 19:486–90.
35. Bosse JA and Wassermann O: On the blood content of guinea-
pig tissues. Ph armacology 1970, 4:273–7.
36. Berne RM an d Sperelakis N: Handbook of physiology: the Cardiovascular
System 1979.
37. Riviere JE: Comparative Pharmacokinetics: Principles, Techniques, and
Application s Blackwell Publishing Limite d; 11999.
38. Collett A, Tanianis-Hughes J, Hallifax D and Warhurst G: Predict-
ing P-glycoprotein effects on oral absorption: correlation of
tra nsport in Caco-2 with drug pharmacokinetics in wild-type
and mdr1a(-/-) mice in vivo. Pharm Res 2004, 21:819–826.
39. Sparrebo om A, van Asperen J, Mayer U, Schinkel AH, Smit JW,
Meijer DK, Borst P, Nooijen WJ, Beijnen J and van Tellingen O:
Limited oral biovailability abd active epit helial excretion of
paclitaxel (Taxol) caused by P- glycoprotein in the intestine.
Pro c Natl Acad Sci 1997, 94:2031–2035.
40. Mayer U, Wagenaar E, Beijnen J, Smit JW, Meijer DK, van Asperen J,
Borst P and Schinkel AH: Su bstantial excretion of digoxin via
the intestinal mucosa and prevention of long term digoxin
accumulation in the brain by mdr1a P-glycoprotein. Br J
Pharmacol 1996, 119:1038–44.
41. KimRB,FrommMF,WandelC,LeakeB,WoodAJ,RodenDMand
Wilkinson GR: The drug transporter P-gl ycoprotein limits
oral absorption and brain entry of HIV-1 protease inhibitors.
J Clin Invest 1998, 101:289–94.
42. Jonk er JW, Smit JW, Brinkhuis RF, Maliepaard M, Beijnen JH,
Sch ellens JH and Schinkel AH: Role of breast cancer resistance
protein in the bioavailability and fetal penetration of
topotecan. J Natl Cancer Inst 2000, 92:1651–6.
43. Wishart D, Knox C, Guo A, Shrivastava S, Hassanali M, Stothard P,
Chang Z and Woolsey J: DrugBank: a comprehen sive resource
for in silico drug d iscovery and exploration.
Nucleic Acids Res
2006, 34:D668–72.
44. PubChem.
/>45. Beaumont K, Harper A, Smith DA and Bennett J: The role of P-
glycoprotein in determining the oral absorption and
clearance of the NK2 antagonist, UK-224,671. Eur J Pharm
Sci 2000, 12:41–50.
Theoretical Biology and Medical Modelling 2009, 6:2 />Page 12 of 13
(page number not f or cit ation purposes)
46. Pardridge WM, Triguero D, Yang J and Cancilla PA: Comparison of
in vitro and in vivo models of drug transcytosis trhough the
blood brain barrier. J Pharmacol Exp Ther 1990, 253:884–891.
47. Makhey VD, Guo A, Norris DA, Hu P, Yan J and Sinko PJ:
Characterization of the regional intestinal kinetics of drug
efflux in rat and human intestine and in Caco-2 cells. Pharm
Res 1998, 15:1160–1167.
48. Barone JA: Domperidone: A peripherally Acting Dopamine2-
receptor antagonist. Ann Pharmacol 1999, 33:429–440.
49. U.S Environmental Protection Agency: Exposure Assessment
Too ls an d Models. 2005
/>pubs/episuite.htm.
50. Heykants J, Knaeps A, Meuldermans W and Michiels M: On the
pharmacokinetics of domperidone in animals and man. I.
Plasma levels of domperidone in rats and dogs. Age related
adsorption and passage through the blood brain barrier in
rats. Eur J Drug Met Pharmacokinet 1981, 6:27–36.
51. Hayeshi R, Hilgendorf C, Artursson P, Aug ustijns P, Brodin B,
Deh ertogh P, Fisher K, Fossati L, Hovenkamp E, Korjamo T,
MasungiC,MaubonN,MolsR,MullertzA,MonkkonenJ,
O'Driscoll C, Oppers-Tiemissen HM, Ragnarsson EG,
Rooseboom M and Ungell AL: Comparison of drug transporter
gen e expression and functionality in Caco-2 cells from 10
different labor atories. Eur J Pharm Sci 2008.
52. Seithel A, Karlsson J, Hilgendorf C, Bjorquist A and Un gell AL:
Variability in mRNA expression of ABC - and SLC-trans por-
ters in human intestinal cells: comparison between human
segments and Caco-2 cells. Eur J Pharm Sci 2006, 28:291– 9.
53. Golden PL and Pollack GM: Blood-brain barrier efflux trans-
port. J Pharm Sci 2003, 92:1739–1753.
54. de Lange EC: Potential r ole of ABC transporters as a
detoxification system at the blood-CSF barrier. Adv Drug
Deliv Rev 2004, 56:1793–809.
55. Kim CS, Sandberg JA, Slikker W, Binienda Z, Schlosser PM and
Patterson T A: Quantitative exposure assess ment: application
of physiologically-based pharmacokinetic (PBPK) modeling
of low-dose, long-term exposures of organic acid toxicant in
the brain. Environ Toxicol Pharmacol 2001, 9:153– 160.
56. de Lange EC and Danhof M: Considerations in the use of
cerebrospinal fluid pharmacokinetics to predict brain target
concentrations in the clinical setting: implications of the
barriers between blood and brain. Clin Pharmaco kinet 2002,
41:691–703.
57. Yang JJ, Kim KJ and Lee VH: Role of P-glycoprotein in restricting
propranolol transport in cultured rabbi t conjunctival epithe-
lial cell layers. Pharm Res 2000, 17:533–538.
58. Polli JW, Wring SA, Humphreys JE, Huang L, Morgan JB,
Webster LO and Serabjit-Singh CS: Rational use of in vitro P-
glycoprotein assays in drug dis covery. J Pharmacol Exp Ther
2001, 299:620–628.
59. Stephens RH, O'Neill CA, Bennett J, Humphrey M, Henry B,
Rowland M and Warhurst G: Reso lution of P-glycoprotein and
non P-glycoprotein effects on drug permeability using
intestinal tissus from mdr1a(-/-) mice. Br J Pharmacol 2002,
135:2038
–2046.
60. Kawahara M, Sakata A, Miyashita T, Tamai I and Ts uji A:
Physiologically based pharmacokinetics of digoxin in
mdr1a knockout mice. J Pharm Sci 1999, 88:1281–7.
Publish with BioMed Central and every
scientist can read your work free of charge
"BioMed Central will be the most significant development for
disseminating the results of biomedical research in our lifetime."
Sir Paul Nurse, Cancer Research UK
Your research papers will be:
available free of charge to the entire biomedical community
peer reviewed and published immediately upon acceptance
cited in PubMed and archived on PubMed Central
yours — you keep the copyright
Submit your manuscript here:
/>BioMedcentral
Theoretical Biology and Medical Modelling 2009, 6:2 />Page 13 of 13
(page number not f or cit ation purposes)