Introduction to Optimum Design phần 5 pptx
Bạn đang xem bản rút gọn của tài liệu. Xem và tải ngay bản đầy đủ của tài liệu tại đây (527.66 KB, 76 trang )
8.1.3 Convergence of Algorithms
The central idea behind numerical methods of optimization is to search for the optimum point
in an iterative manner, generating a sequence of designs. It is important to note that the
success of a method depends on the guarantee of convergence of the sequence to the optimum
point. The property of convergence to a local optimum point irrespective of the starting point
is called global convergence of the numerical method. It is desirable to employ such con-
vergent numerical methods in practice since they are more reliable. For unconstrained prob-
lems, a convergent algorithm must reduce the cost function at each iteration until a minimum
point is reached. It is important to note that the algorithms converge to a local minimum point
only, as opposed to a global minimum, since they only use the local information about the
cost function and its derivatives in the search process. Methods to search for global minima
are described in Chapter 18.
8.1.4 Rate of Convergence
In practice, a numerical method may take a large number of iterations to reach the optimum
point. Therefore, it is important to employ methods having a faster rate of convergence. Rate
of convergence of an algorithm is usually measured by the numbers of iterations and func-
tion evaluations needed to obtain an acceptable solution. Rate of convergence is a measure
of how fast the difference between the solution point and its estimates goes to zero. Faster
algorithms usually use second-order information about the problem functions when calcu-
lating the search direction. They are known as Newton methods. Many algorithms also
approximate second-order information using only the first-order information. They are known
as quasi-Newton methods, described in Chapter 9.
8.2 Basic Ideas and Algorithms for Step Size Determination
Unconstrained numerical optimization methods are based on the iterative formula given in
Eq. (8.1). As discussed earlier, the problem of obtaining the design change Dx is usually
decomposed into two subproblems: (1) direction finding and (2) step size determination, as
expressed in Eq. (8.3). We need to discuss numerical methods for solving both subproblems.
In the following paragraphs, we first discuss the problem of step size determination. This is
often called the one-dimensional search (or, line search) problem. Such problems are simpler
to solve. This is one reason for discussing them first. Following one-dimensional minimiza-
tion methods, two methods are described in Sections 8.3 and 8.4 for finding a “desirable”
search direction d in the design space.
8.2.1 Definition of One-Dimensional Minimization Subproblem
For an optimization problem with several variables, the direction finding problem must be
solved first. Then, a step size must be determined by searching for the minimum of the cost
function along the search direction. This is always a one-dimensional minimization problem.
To see how the line search will be used in multidimensional problems, let us assume for the
moment that a search direction d
(k)
has been found. Then, in Eqs. (8.1) and (8.3), scalar a
k
is the
only unknown. Since the best step size a
k
is yet unknown, we replace it by a in Eq. (8.3). Then,
using Eqs. (8.1) and (8.3), the cost function f(x) is given as f(x
(k+1)
) = f(x
(k)
+ ad
(k)
). Now, since
d
(k)
is known, the right side becomes a function of the scalar parameter a only. This process is
summarized in the following equations:
Design update:
(8.9a)
xxd
kkk+
( ) () ()
=+
1
a
282 INTRODUCTION TO OPTIMUM DESIGN
Numerical Methods for Unconstrained Optimum Design 283
Cost function evaluation:
(8.9b)
where (a) is the new function with a as the only independent variable (in the sequel, we
shall drop the overbar for functions of single variable). Note that at a = 0, f(0) = f(x
(k)
) from
Eq. (8.9b), which is the current value of the cost function. It is important to understand this
reduction of a function of n variables to a function of only one variable since this funda-
mental step is used in almost all optimization methods. It is also important to understand
the geometric significance of Eq. (8.9b). We shall elaborate on these ideas later.
If x
(k)
is not a minimum point, then it is possible to find a descent direction d
(k)
at the point
and reduce the cost function further. Recall that a small move along d
(k)
reduces the cost func-
tion. Therefore, using Eqs. (8.5) and (8.9b), the descent condition for the cost function can
be expressed as the inequality:
(8.10)
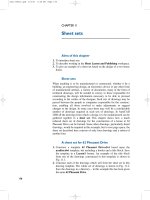
Since f(a) is a function of single variable, we can plot f(a) versus a. To satisfy Inequal-
ity (8.10), the curve f(a) versus a must have a negative slope at the point a = 0. Such a curve
is shown by the solid line in Fig. 8-3. It must be understood that if the search direction is
that of descent, the graph of f(a) versus a cannot be the one shown by the dashed curve
because any positive a would cause the function f(a) to increase, violating Inequality (8.10).
This would also be a contradiction as d
(k)
is a direction of descent for the cost function. There-
fore, the graph of f(a) versus a must be the solid curve in Fig. 8-3 for all problems. In fact,
the slope of the curve f(a) at a = 0 is calculated as f ¢(0) = c
(k)
·d
(k)
, which is negative as seen
in Eq. (8.8). This discussion shows that if d
(k)
is a descent direction, then a must always be
a positive scalar in Eq. (8.8). Thus, the one-dimensional minimization problem is to find a
k
= a such that f(a) is minimized.
8.2.2 Analytical Method to Compute Step Size
If f(a) is a simple function, then we can use the analytical procedure to determine a
k
(necessary and sufficient conditions of Section 4.3). The necessary condition is df(a
k
)/da =
0, and the sufficient condition is d
2
f(a
k
)/da
2
> 0. We shall illustrate the analytical line search
ffa
()
<
()
0
f
ff f
kkk
xxd
+
( ) () ()
()
=+
()
=
()
1
aa
f (a)
f
(0)
tan
–1
| c · d |
a = a
k
a
FIGURE 8-3 Graph of f(a) versus a.
284 INTRODUCTION TO OPTIMUM DESIGN
procedure with Example 8.2. Note that differentiation of f(x
(k+1)
) in Eq. (8.9b) with respect
to a, using the chain rule of differentiation and setting it to zero, gives
(8.11)
Since the dot product of two vectors is zero in Eq. (8.11), the gradient of the cost func-
tion at the new point is orthogonal to the search direction at the kth iteration, i.e., c
(k+1)
is
normal to d
(k)
. The condition in Eq. (8.11) is important for two reasons: (1) it can be used
directly to obtain an equation in terms of step size a whose smallest root gives the exact step
size, and (2) it can be used to check the accuracy of the step size in a numerical procedure
to calculate a and thus it is called the line search termination criterion. Many times numer-
ical line search methods will give an approximate or inexact value of the step size along the
search direction. The line search termination criterion is useful for determining the accuracy
of the step size; i.e., for checking c
(k+1)
·d
(k)
= 0.
df
d
fd
d
f
kTkk
kkkk
xx
x
x
xdcd
+
()
+
()
+
()
+
() ()
+
() ()
()
=
∂
()
∂
()
=—
()
◊= ◊=
111
11
0
aa
EXAMPLE 8.2 Analytical Step Size Determination
Let a direction of change for the function
(a)
at the point (1, 2) be given as (-1, -1). Compute the step size a
k
to minimize f(x)in
the given direction.
Solution. For the given point x
(k)
= (1, 2), f(x
(k)
) = 22, and d
(k)
= (-1, -1). We first
check to see if d
(k)
is a direction of descent using Inequality (8.8). The gradient of the
function at (1, 2) is given as c
(k)
= (10, 10) and c
(k)
·d
(k)
= 10(-1) + 10(-1) =-20< 0.
Therefore, (-1, -1) is a direction of descent. The new point x
(k+1)
using Eq. (8.9a) is
given as
(b)
Substituting these equations into the cost function of Eq. (a), we get
(c)
Therefore, along the given direction (-1, -1), f(x) becomes a function of the single
variable a. Note from Eq. (c) that f(0) = 22, which is the cost function value at the
current point, and that f ¢(0) =-20 < 0, which is the slope of f(a) at a = 0 (also recall
that f ¢(0) = c
(k)
·d
(k)
). Now using the necessary and sufficient conditions of optimality
for f(a), we obtain
(d)
Therefore, a
k
=
10
–
7
minimizes f(x) in the direction (-1, -1). The new point is
df
d
df
d
kk
a
aa
a
=-= = =>14 20 0
10
7
14 0
2
2
;;
ff
k
x
+
()
()
=-
()
+-
()
-
()
+-
()
+=-+=
()
1
22
2
31 21 2 22 7 7 20 22aaaaaaa
x
x
xx
k
kk
1
2
1
1
1
2
1
1
2
1
1
12
È
Î
Í
˘
˚
˙
=
È
Î
Í
˘
˚
˙
+
-
-
È
Î
Í
˘
˚
˙
=- = -
+
()
+
()
+
()
aaa,;or
fxxxxx
()
=+ ++32 27
1
2
12 2
2
Numerical Methods for Unconstrained Optimum Design 285
8.2.3 Concepts Related to Numerical Methods to Compute Step Size
In Example 8.2, it was possible to simplify expressions and obtain an explicit form for the
function f(a). Also, the functional form of f(a) was quite simple. Therefore, it was possible
to use the necessary and sufficient conditions of optimality to find the minimum of f(a) and
analytically calculate the step size a
k
. For many problems, it is not possible to obtain an
explicit expression for f(a). Moreover, even if the functional form of f(a) is known, it may
be too complicated to lend itself to analytical solution. Therefore, a numerical method must
be used to find a
k
to minimize f(x) in the known direction d
(k)
.
The numerical line search process is itself iterative, requiring several iterations before a
minimum point is reached. Many line search techniques are based on comparing function
values at several points along the search direction. Usually, we must make some assumptions
on the form of the line search function to compute step size by numerical methods. For
example, it must be assumed that a minimum exists and that it is unique in some interval of
interest. A function with this property is called the unimodal function. Figure 8-4 shows the
graph of such a function that decreases continuously until the minimum point is reached.
Comparing Figs. 8-3 and 8-4, we observe that f(a) is a unimodal function in some interval.
Therefore, it has a unique minimum.
Most one-dimensional search methods assume the line search function to be a unimodal
function. This may appear to be a severe restriction on the methods; however, it is not. For
functions that are not unimodal, we can think of locating only a local minimum point that is
closest to the starting point, i.e., closest to a = 0. This is illustrated in Fig. 8-5, where the
function f(a) is not unimodal for 0 £ a £ a
0
. Points A, B, and C are all local minima. If we
restrict a to lie between 0 and , however, there is only one local minimum point A because
the function f(a) is unimodal for 0 £ a £ . Thus, the assumption of unimodality is not as
restrictive as it appears.
The line search problem then is to find a in an interval 0 £ a £ at which the function
f(a) has a global minimum. This statement of the problem, however, requires some modifi-
cation. Since we are dealing with numerical methods, it is not possible to locate the exact
minimum point a*. In fact, what we determine is the interval in which the minimum lies, i.e.,
some lower and upper limits a
l
and a
u
for a*. The interval (a
l
, a
u
) is called the interval of
uncertainty and is designated as I = a
u
- a
l
. Most numerical methods iteratively reduce the
interval of uncertainty until it satisfies a specified tolerance e, i.e., I < e. Once this stopping
criterion is satisfied, a* is taken as 0.5(a
l
+ a
u
). Methods based on the preceding philosophy
a
a
a
(e)
Substituting the new design (-
3
–
7
,
4
–
7
) into the cost function f(x) we find the new value
of the cost function as
54
–
7
. This is a substantial reduction from the cost function value
of 22 at the previous point. Note that Eq. (d) for calculation of step size a can also
be obtained by directly using the condition given in Eq. (8.11). Using Eq. (b), the
gradient of f at the new design point in terms of a is given as
(f)
Using the condition of Eq. (8.11), we get 14a - 20 = 0 which is same as Eq. (d).
c
k
xxxx
+
()
=+ +
()
=- -
()
1
1212
6224 108106,,aa
x
x
k
1
2
1
1
2
10
7
1
1
3
7
4
7
È
Î
Í
˘
˚
˙
=
È
Î
Í
˘
˚
˙
+
Ê
Ë
ˆ
¯
-
-
È
Î
Í
˘
˚
˙
=
-
È
Î
Í
Í
Í
˘
˚
˙
˙
˙
+
()
286 INTRODUCTION TO OPTIMUM DESIGN
are called interval reducing methods. In this chapter, we shall only present methods based
on this idea. The basic procedure for these methods can be divided into two phases. In phase
one, the location of the minimum point is bracketed and the initial interval of uncertainty is
established. In the second phase, the interval of uncertainty is refined by eliminating regions
that cannot contain the minimum. This is done by computing and comparing function values
in the interval of uncertainty. We shall describe the two phases for these methods in more
detail in the following subsections.
It is important to note that the performance of most optimization methods depends heavily
on the step size calculation procedure. Therefore, it is not surprising that numerous proce-
dures have been developed and evaluated for step size calculation. In the sequel, we describe
two rudimentary methods to give the students a flavor of the calculations needed to evaluate
a step size. In Chapter 9, some more advanced methods based on the concept of an inaccu-
rate line search are described and discussed.
8.2.4 Equal Interval Search
As mentioned earlier, the basic idea of any interval reducing method is to reduce succes-
sively the interval of uncertainty to a small acceptable value. To clearly discuss the ideas,
we start with a very simple-minded approach called the equal interval search method. The
idea is quite elementary as illustrated in Fig. 8-6. In the interval 0 £ a £ , the function f(a)
is evaluated at several points using a uniform grid in Phase I. To do this, we select a small
number d and evaluate the function at the a values of d, 2d, 3d, , qd, (q + 1)d, and so on
a
f (a)
a*
a
a
–
FIGURE 8-4 Unimodal function f(a).
A
B
C
f (a)
a*
a = a
a = a
0
–
a
FIGURE 8-5 Nonunimodal function f(a) for 0 £ a £ a
0
(unimodal for 0 £ a £ ).
a
Numerical Methods for Unconstrained Optimum Design 287
as shown in Fig. 8-6(A). We compare values of the function at the two successive points, say
q and (q + 1). Then, if the function at the point q is larger than that at the next point (q + 1),
i.e., f(qd) > f((q + 1)d) the minimum point has not been surpassed yet. However, if the
function has started to increase, i.e.,
(8.12)
then the minimum has been surpassed. Note that once Eq. (8.12) is satisfied for points q
and (q + 1), the minimum can be between either the points (q - 1) and q or the points q and
(q + 1). To account for both possibilities, we take the minimum to lie between the points
(q - 1) and (q + 1). Thus, lower and upper limits for the interval of uncertainty are estab-
lished as
(8.13)
Establishment of the lower and upper limits on the minimum value of a indicates end of
Phase I. In Phase II, we restart the search process from the lower end of the interval of uncer-
tainty a = a
l
with some reduced value for the increment in d, say rd, where r << 1. Then,
the preceding process of Phase I is repeated from a = a
l
with the reduced d and the minimum
is again bracketed. Now, the interval of uncertainty I is reduced to 2rd. This is illustrated in
Fig. 8-6(B). The value of the increment is further reduced, to say r
2
d, and the process is
adadaad
lu ul
qqI=-
()
=+
()
=-=11 2,,
fq f qdd
()
<+
()()
1
f (a)
f
(a)
d
a
a
a*
2d
–
(q – 1)d
(q + 1)d
qd
d
rd
a
l
a
a* a
u
(A) Phase I
(B) Phase II
FIGURE 8-6 Equal interval search process. (A) Phase I: Initial bracketing of minimum. (B) Phase
II: Reducing the interval of uncertainty.
288 INTRODUCTION TO OPTIMUM DESIGN
repeated, until the interval of uncertainty is reduced to an acceptable value e. Note that the
method is convergent for unimodal functions and can be easily coded into a computer
program.
The efficiency of a method such as the equal interval search depends on the number of
function evaluations needed to achieve the desired accuracy. Clearly, this depends on the
initial choice for the value of d. If d is very small, the process may take many function eval-
uations to initially bracket the minimum. An advantage of using a smaller d, however, is that
the interval of uncertainty at the end of the Phase I is fairly small. Subsequent improvements
for the interval of uncertainty require fewer function evaluations. It is usually advantageous
to start with a larger value of d and quickly bracket the minimum point. Then, the process is
continued until the accuracy requirement is satisfied.
8.2.5 Alternate Equal Interval Search
A slightly different computational procedure can be followed to reduce the interval of
uncertainty in Phase II once the minimum has been bracketed in Phase I. This procedure is
a precursor to the more efficient golden sections search presented in the next section.
The procedure is to evaluate the function at two new points, say a
a
and a
b
in the interval of
uncertainty. The points a
a
and a
b
are located at a distance of I/3 and 2I/3 from the lower
limit a
l
, respectively, where I = a
u
- a
l
. That is,
This is shown in Fig. 8-7. Next, the function is evaluated at the two new points a
a
and a
b
.
Let these be designated as f(a
a
) and f(a
b
). Now, the following two conditions must be
checked:
1. If f(a
a
) < f(a
b
), then the minimum lies between a
l
and a
b
. The right one-third
interval between a
b
and a
u
is discarded. New limits for the interval of uncertainty
are a¢
l
= a
l
and a¢
u
= a
b
(the prime on a is used to indicate revised limits for the
interval of uncertainty). Therefore, the reduced interval of uncertainty is I¢=a¢
u
- a¢
l
= a
b
- a
l
. The procedure is repeated with the new limits.
2. If f(a
a
) < f(a
b
), then the minimum lies between a
a
and a
u
. The interval between a
l
and
a
a
is discarded. The procedure is repeated with a¢
l
= a
a
and a¢
u
= a
u
(I¢=a¢
u
- a¢
l
).
aa aa a
al bl u
III=+ =+ =-
1
3
2
3
1
3
;
f (a)
a
l
a
a
a
b
a
u
a
(a
u
– a
l
)/ 3
FIGURE 8-7 An alternate equal interval search process.
With the preceding calculations, the interval of uncertainty is reduced to I¢=2I/3 after every
set of two function evaluations. The entire process is continued until the interval of uncer-
tainty is reduced to an acceptable value.
8.2.6 Golden Section Search
Golden section search is an improvement over the alternate equal interval search and is one
of the better methods in the class of interval reducing methods. The basic idea of the method
is still the same: evaluate the function at predetermined points, compare them to bracket the
minimum in Phase I, and then converge on the minimum point in Phase II. The method uses
fewer function evaluations to reach the minimum point compared with other similar methods.
The number of function evaluations is reduced during both the phases, the initial bracketing
phase as well as the interval reducing phase.
Initial Bracketing of Minimum—Phase I In the equal interval methods, the initially
selected increment d is kept fixed to bracket the minimum initially. This can be an inefficient
process if d happens to be a small number. An alternate procedure is to vary the increment
at each step, i.e., multiply it by a constant r > 1. This way initial bracketing of the minimum
is rapid; however, the length of the initial interval of uncertainty is increased. The golden
section search procedure is such a variable interval search method. In the method the value
of r is not selected arbitrarily. It is selected as the golden ratio, which can be derived as 1.618
in several different ways. One derivation is based on the Fibonacci sequence defined as
(a)
Any number of the Fibonacci sequence for n > 1 is obtained by adding the previous two
numbers, so the sequence is given as 1, 1, 2, 3, 5, 8, 13, 21, 34, 55, 89. . . . The sequence has
the property,
(b)
That is, as n becomes large, the ratio between two successive numbers F
n
and F
n-1
in the
Fibonacci sequence reaches a constant value of 1.618 or This golden ratio has
many other interesting properties that will be exploited in the one-dimensional search
procedure. One property is that 1/1.618 = 0.618.
Figure 8-8 illustrates the process of initially bracketing the minimum using a sequence of
larger increments based on the golden ratio. In the figure, starting at q = 0, we evaluate f(a)
at a = d, where d > 0 is a small number. We check to see if the value f(d) is smaller than
the value f(0). If it is, we then take an increment of 1.618d in the step size (i.e., the increment
is 1.618 times the previous increment d). This way we evaluate the function at the follow-
ing points and compare them:
q
q
q
q
j
j
j
j
j
j
==
==+==
()
==+
()
==
()
==+==
()
◊
◊
◊
=
=
=
Â
Â
Â
0
1 1 618 2 618 1 618
2 2 618 1 618 1 618 5 236 1 618
3 5 236 1 168 9 472 1 618
0
1
0
1
2
0
2
3
3
0
3
;
;
; .
; .
ad
ad d d d
ad ddd
adddd
512+
()
.
F
F
n
n
n-
ÆÆ•
1
1 618. as
FFFFFn
nn n01 12
11 23===+ =
; ; , , ,
Numerical Methods for Unconstrained Optimum Design 289
290 INTRODUCTION TO OPTIMUM DESIGN
In general, we continue to evaluate the function at the points
(8.14)
Let us assume that the function at a
q-1
is smaller than that at the previous point a
q-2
and
the next point a
q
, i.e.,
(8.15)
Therefore, the minimum point has been surpassed. Actually the minimum point lies
between the previous two intervals, i.e., between a
q
and a
q-2
, as in the equal interval search.
Therefore, upper and lower limits on the interval of uncertainty are
(8.16)
Thus, the initial interval of uncertainty is calculated as
(8.17)
Reduction of Interval of Uncertainty—Phase II The next task is to start reducing the inter-
val of uncertainty by evaluating and comparing functions at some points in the established
interval of uncertainty I. The method uses two function values within the interval I, just as in
the alternate equal interval search of Fig. 8-7. However, the points a
a
and a
b
are not located
at I/3 from either end of the interval of uncertainty. Instead, they are located at a distance of
0.382I (or 0.618I) from either end. The factor 0.382 is related to the golden ratio as we shall
see in the following.
To see how the factor 0.618 is determined, consider two points symmetrically located from
either end as shown in Fig. 8-9(A)—points a
a
and a
b
are located at a distance of tI from
either end of the interval. Comparing functions values at a
a
and a
b
, either the left (a
l
, a
a
) or
the right (a
b
, a
u
) portion of the interval gets discarded because the minimum cannot lie there.
Let us assume that the right portion gets discarded as shown in Fig. 8-9(B), so a¢
l
and a¢
u
are
I
ul
j
j
q
j
j
q
=-=
()
-
()
=
()
+
()
=
()
+
()
=
()
==
-
-
ÂÂ
aa d d d d
dd
1 618 1 618 1 618 1 618
1 618 1 1 618 2 618 1 618
00
2
1
11
aa d aa d
uq
j
j
q
lq
j
j
q
==
()
==
()
=
-
=
-
ÂÂ
1 618 1 618
0
2
0
2
.; .
ff ff
qq qq
aa aa
-
()
<
() ()
<
()
12 1
and
ad
q
j
j
q
q=
()
=
=
Â
1 618 0 1 2
0
. ; , , ,
0
q = 0
2.618d 5.236d 9.472da*
a
d
12 3
· · ·
f (a)
FIGURE 8-8 Initial bracketing of the minimum point in the golden section method.
Numerical Methods for Unconstrained Optimum Design 291
the new lower and upper bounds on the minimum. The new interval of uncertainty is I¢=tI.
There is one point in the new interval at which the function value is known. It is required
that this point be located at a distance of tI¢ from the left end; therefore, tI¢=(1 - t)I.
Since I¢=tI, this gives the equation t
2
+ t - 1 = 0. The positive root of this equation is
Thus the two points are located at a distance of 0.618I or 0.382I
from either end of the interval.
The golden section search can be initiated once the initial interval of uncertainty is known.
If the initial bracketing is done using the variable step increment (with a factor of 1.618,
which is 1/0.618), then the function value at one of the points a
q-1
is already known. It turns
out that a
q-1
is automatically the point a
a
. This can be seen by multiplying the initial inter-
val I in Eq. (8.17) by 0.382. If the preceding procedure is not used to initially bracket
the minimum, then the points a
a
and a
b
will have to be calculated by the golden section
procedure.
Algorithm for One-Dimensional Search by Golden Sections Find a to minimize f(a).
Step 1. For a chosen small number d, let q be the smallest integer to satisfy Eq. (8.15)
where a
q
, a
q-1
, and a
q-2
are calculated from Eq. (8.14). The upper and lower bounds
on a* (the optimum value for a) are given by Eq. (8.16).
Step 2. Compute f(a
b
), where a
b
= a
l
+ 0.618I (the interval of uncertainty I = a
u
- a
l
).
Note that, at the first iteration, a
a
= a
l
+ 0.382I = a
q-1
, and so f(a
a
) is already known.
Step 3. Compare f(a
a
) and f(a
b
), and go to (i), (ii), or (iii).
(i) If f(a
a
) < f(a
b
), then minimum point a* lies between a
l
and a
b
, i.e., a
l
£ a* £
a
b
. The new limits for the reduced interval of uncertainty are a¢
l
= a
l
and a¢
u
=
a
b
. Also, a¢
b
= a
a
. Compute f(a¢
a
), where a¢
a
= a¢
l
+ 0.382(a¢
u
- a¢
l
) and go to
Step 4.
(ii) If f(a
a
) > f(a
b
), then minimum point a* lies between a
a
and a
u
, i.e., a
a
£ a* £
a
u
. Similar to the procedure in Step 3(i), let a¢
l
= a
a
and a¢
u
= a
u
, so that a ¢
a
=
a
b
. Compute f(a¢
b
), where a¢
b
= a¢
l
+ 0.618(a¢
u
- a¢
l
) and go to Step 4.
(iii) If f(a
a
) = f(a
b
), let a
l
= a
a
and a
u
= a
b
and return to Step 2.
Step 4. If the new interval of uncertainty I¢=a¢
u
- a¢
l
is small enough to satisfy a
stopping criterion (i.e., I¢<e), let a* = (a¢
u
+ a¢
l
)/2 and stop. Otherwise, delete the
primes on a ¢
l
, a¢
a
, and a¢
b
and return to Step 3.
Example 8.3 illustrates the golden sections method for step size calculation.
t =-+
()
=1 5 2 0 618
I
tI
tI'
I'
tI
a
a
a
l
a’
i
a
b
a'
b
a
u
a'
u
(1 – t)I
(1 – t)I
(1 – t)I'
(A)
(B)
FIGURE 8-9 Golden section partition.
292 INTRODUCTION TO OPTIMUM DESIGN
EXAMPLE 8.3 Minimization of a Function by Golden
Section Search
Consider the function f(a) = 2 - 4a + e
a
. Use golden section search to find the
minimum within an accuracy of e = 0.001. Use d = 0.5.
Solution. Analytically, the solution is a* = 1.3863, f(a*) = 0.4548. In the golden
section search, we need to first bracket the minimum point (Phase I) and then iteratively
reduce the interval of uncertainty (Phase II). Table 8-1 shows various iterations of the
method. In Phase I, the minimum point is bracketed in only four iterations as shown in
the first part of the table. The initial interval of uncertainty is calculated as I = (a
u
- a
l
)
= 2.618034 - 0.5 = 2.118034 since f(2.618034) > f(1.309017) in Table 8-1. Note that
this interval would be larger than the one obtained using equal interval searching.
Now, to reduce the interval of uncertainty in Phase II, let us calculate a
b
as (a
l
+
0.618I) or a
b
= a
u
- 0.382I (calculations are shown in the second part of Table 8-1).
Note that a
a
and f(a
a
) are already known and need no further calculation. This is the
main advantage of the golden section search; only one additional function evaluation
is needed in the interval of uncertainty in each iteration, compared with the two func-
tion evaluations needed for the alternate equal interval search. We calculate a
b
=
1.809017 and f(a
b
) = 0.868376. Note that the new calculation of the function is shown
in boldface for each iteration. Since f(a
a
) < f(a
b
), new limits for the reduced interval
TABLE 8-1 Golden Section Search for f(a) = 2 - 4a + e
a
of Example 8.3
Phase 1: Initial bracketing of minimum
No., q Trial step, a Function value, f(a)
1 0.000000 3.000000
2 a
l
Æ 0.500000 1.648721
3 1.309017 0.466464
4 a
u
Æ 2.618034 5.236610
Phase 2: Reducing interval of uncertainty
No. a
l
[f(a
l
)] a
a
[f(a
a
)] a
b
[f(a
b
)] a
u
[f(a
u
)] I
1 0.500000 1.309017 1.809017 2.618034 2.118034
[1.648721] Ø [0.466464] [0.868376] [5.236610]
2 0.500000 1.000000 1.309017 1.809017 1.309017
[1.648721] [0.718282] [0.466464] [0.868376] Ø
3 1.000000 1.309017 1.500000 1.809017 0.809017
[0.718282] [0.466464] [0.481689] [0.868376]
—— — — — —
—— — — — —
16 1.385438 1.386031 1.386398 1.386991 0.001553
[0.454824] [0.454823] [0.454823] [0.454824]
17 1.386031 1.386398 1.386624 1.386991 0.000960
[0.454823] [0.454823] [0.454823] [0.454823]
a = 0.5(1.386398 + 1.386624) = 1.386511; f(a*) = 0.454823.
Note: The new calculation for each iteration is shown as boldfaced and shaded; the arrows indi-
cate direction of transfer of data.
Ø
Ø
Ø
Ø
Numerical Methods for Unconstrained Optimum Design 293
8.3 Search Direction Determination: Steepest Descent Method
Thus far we have assumed that a search direction in the design space was known and we
have tackled the problem of step size determination. In this section and the next, we shall
address the question of how to determine the search direction d. The basic requirement for
d is that the cost function be reduced if we make a small move along d; that is, the descent
condition of Eq. (8.8) be satisfied. This will be called the descent direction.
Several methods are available for determining a descent direction for unconstrained opti-
mization problems. The steepest descent method or the gradient method is the simplest, the
oldest, and probably the best known numerical method for unconstrained optimization.
The philosophy of the method, introduced by Cauchy in 1847, is to find the direction d at
the current iteration in which the cost function f(x) decreases most rapidly, at least locally.
Because of this philosophy, the method is called the steepest descent search technique. Also,
properties of the gradient of the cost function are used in the iterative process, which is the
reason for its alternate name: the gradient method. The steepest descent method is a first-
order method since only the gradient of the cost function is calculated and used to evaluate
the search direction. In the next chapter, we shall discuss second-order methods in which the
Hessian of the function will be used in determining the search direction.
The gradient of a scalar function f(x
1
, x
2
, , x
n
) was defined in Chapter 4 as the column
vector:
(8.18)
To simplify the notation, we shall use vector c to represent gradient of the cost function
f(x); that is, c
i
=∂f/∂x
i
. We shall use a superscript to denote the point at which this vector is
calculated, as
(8.19)
The gradient vector has several properties that are used in the steepest descent method.
These will be discussed in the next chapter in more detail. The most important property is
that the gradient at a point x points in the direction of maximum increase in the cost func-
ccx
x
kk
k
i
T
f
x
() ()
()
=
()
=
∂
()
∂
È
Î
Í
˘
˚
˙
c =— =
∂
∂
∂
∂
∂
∂
È
Î
Í
˘
˚
˙
f
f
x
f
x
f
x
n
T
12
of uncertainty are a¢
l
= 0.5 and a¢
u
= 1.809017. Also, a¢
b
= 1.309017 at which the func-
tion value is already known. We need to compute only f(a¢
a
) where a¢
a
= a¢
l
+ 0.382(a¢
u
- a¢
l
) = 1.000. Further refinement of the interval of uncertainty is repetitive and can
be accomplished by writing a computer program.
A subroutine GOLD implementing the golden section search procedure is given in
Appendix D. The minimum for the function f is obtained at a* = 1.386511 with f(a*)
= 0.454823 in 22 function evaluations as shown in Table 8-1. The number of func-
tion evaluations is a measure of efficiency of an algorithm. The problem was also
solved using the equal interval search and 37 function evaluations were needed to
obtain the same solution. This verifies our earlier observation that golden section
search is a better method for a specified accuracy and initial step length.
It may appear that if the initial step length d is too large in the equal interval or
golden section method, the line search fails, i.e., f(d) > f(0). Actually, it indicates that
initial d is not proper and needs to be reduced until f(d) < f(0). With this procedure,
convergence of the method can be numerically enforced. This numerical procedure
has been implemented in the GOLD subroutine given in Appendix D.
294 INTRODUCTION TO OPTIMUM DESIGN
tion. Thus the direction of maximum decrease is opposite to that, i.e., negative of the gradi-
ent vector. Any small move in the negative gradient direction will result in the maximum
local rate of decrease in the cost function. The negative gradient vector then represents a
direction of steepest descent for the cost function and is written as
(8.20)
Equation (8.20) gives a direction of change in the design space for use in Eq. (8.4). Based
on the preceding discussion, the steepest descent algorithm is stated as follows:
Step 1. Estimate a starting design x
(0)
and set the iteration counter k = 0. Select a
convergence parameter e > 0.
Step 2. Calculate the gradient of f(x) at the point x
(k)
as c
(k)
=—f(x
(k)
).
Step 3. Calculate ||c
(k)
||. If ||c
(k)
|| < e, then stop the iterative process because x* = x
(k)
is a
minimum point. Otherwise, continue.
Step 4. Let the search direction at the current point x
(k)
be d
(k)
=-c
(k)
.
Step 5. Calculate a step size a
k
that minimizes f(x
(k)
+ ad
(k)
). Any one-dimensional
search algorithm may be used to determine a
k
.
Step 6. Update the design as x
(k+1)
= x
(k)
+ a
k
d
(k)
. Set k = k + 1, and go to Step 2.
The basic idea of the steepest descent method is quite simple. We start with an initial esti-
mate for the minimum design. The direction of steepest descent is computed at that point. If
the direction is nonzero, we move as far as possible along it to reduce the cost function. At
the new design point, we calculate the steepest descent direction again and repeat the entire
process. Note that since d =-c, the descent condition of inequality (8.8) is always satisfied
as c · d =-||c||
2
< 0. Examples 8.4 and 8.5 illustrate the calculations involved in the steep-
est descent method.
dc=- =- =-
∂
∂
=,;or to dc
f
x
in
ii
i
1
EXAMPLE 8.4 Use of Steepest Descent Algorithm
Minimize (a)
using the steepest descent method starting from the point (1, 0).
Solution. To solve the problem, we follow the steps of the steepest descent
algorithm.
1. The starting design is given as x
(0)
= (1, 0).
2. c
(0)
= (2x
1
- 2x
2
, 2x
2
- 2x
1
) = (2, -2).
3.
4. Set d
(0)
=-c
(0)
= (-2, 2).
5. Calculate a to minimize f(x
(0)
+ ad
(0)
) where x
(0)
+ ad
(0)
= (1 - 2a, 2a):
(b)
Since this is a simple function of a, we can use necessary and sufficient condi-
tions to solve for the optimum step length. In general, a numerical one-dimen-
sional search will have to be used to calculate a. Using the analytic approach
to solve for optimum a, we get
f
f
xd
00
222
2
12222122
16 8 1
() ()
+
()
=-
()
+
()
+
()
()()
=-+=
()
a aaa aa
aa a
c
0
22
0
()
=π
fx x x x xx
12 1
2
2
2
12
2,
()
=+-
Numerical Methods for Unconstrained Optimum Design 295
The preceding problem is quite simple and an optimum point is obtained in only one iter-
ation. This is because the condition number of the Hessian of the cost function is 1 (condi-
tion number is a scalar associated with the given matrix; refer to Section B.7 in Appendix
B). In such a case, the steepest descent method converges in just one iteration with any start-
ing point. In general, the algorithm will require several iterations before an acceptable
optimum is reached.
(c)
(d)
Therefore, the sufficiency condition for a minimum for f(a) is satisfied.
6. Updating the design (x
(0)
+ a
0
d
(0)
): x
1
(1)
= 1 - 0.25(2) = 0.5, x
2
(1)
= 0 + 0.25(2) =
0.5 Solving for c
(1)
from the expression in Step 2, we see that c
(1)
= (0, 0), which
satisfies the stopping criterion. Therefore, (0.5, 0.5) is a minimum point for f(x)
and f* = 0.
df
d
2
2
32 0
a
a
()
=>.
df
d
a
a
aa
()
=-= =03280 025;.or
0
EXAMPLE 8.5 Use of Steepest Descent Algorithm
Minimize (a)
using the steepest descent method with a starting design as (2, 4, 10). Select the con-
vergence parameter e as 0.005. Perform a line search by golden section search with
initial step length d = 0.05 and an accuracy of 0.0001.
Solution.
1. The starting point is set as x
(0)
= (2, 4, 10).
2. c =—f = (2x
1
+ 2x
2
, 4x
2
+ 2x
1
+ 2x
3
, 4x
3
+ 2x
2
); c
(0)
= (12, 40, 48).
3.
4. d
(0)
=-c
(0)
= (-12, -40, -48).
5. Calculate a
0
by golden section search to minimize f(x
(0)
+ ad
(0)
); a
0
= 0.1587.
6. Update the design as x
(1)
= x
(0)
+ a
0
d
(0)
= (0.0956, -2.348, 2.381). At the new
design, c
(1)
= (-4.5, -4.438, 4.828), ||c
(1)
|| = 7.952 > e.
Note that c
(1)
· d
(0)
= 0, which verifies the exact line search termination criterion given
in Eq. (8.11). The steps in steepest descent algorithm should be repeated until the con-
vergence criterion is satisfied. Appendix D contains the computer program and user
supplied subroutines FUNCT and GRAD to implement steps of the steepest descent
algorithm. The optimum results for the problem with the program are given in Table
8-2. The true optimum cost function value is 0.0 and the optimum point is (0, 0, 0).
c
0
4048 63 6
()
==>
()
e continue
fxxxxxxxxxx
123 1
2
2
2
3
2
12 23
222 2,,
()
=+++ +
296 INTRODUCTION TO OPTIMUM DESIGN
Although the method of steepest descent is quite simple and robust (it is convergent), it
has some drawbacks. These are:
1. Even if convergence of the method is guaranteed, a large number of iterations may
be required for the minimization of even positive definite quadratic forms, i.e., the
method can be quite slow to converge to the minimum point.
2. Information calculated at the previous iterations is not used. Each iteration is started
independent of others, which is inefficient.
3. Only first-order information about the function is used at each iteration to determine
the search direction. This is one reason that convergence of the method is slow. It
can further deteriorate if an inaccurate line search is used. Moreover, the rate of
convergence depends on the condition number of the Hessian of the cost function at
the optimum point. If the condition number is large, the rate of convergence of the
method is slow.
4. Practical experience with the method has shown that a substantial decrease in the
cost function is achieved in the initial few iterations and then it decreases quite
slowly in later iterations.
5. The direction of steepest descent (direction of most rapid decrease in the cost
function) may be good in a local sense (in a small neighborhood) but not in a global
sense.
8.4 Search Direction Determination: Conjugate
Gradient Method
There are many optimization methods based on the concept of conjugate gradients; however,
we shall only present a method due to Fletcher and Reeves (1964). The conjugate gradient
method is a very simple and effective modification of the steepest descent method. It will be
shown in the next chapter that the steepest descent directions at two consecutive steps are
orthogonal to each other. This tends to slow down the steepest descent method although it is
convergent. The conjugate gradient directions are not orthogonal to each other. Rather, these
directions tend to cut diagonally through the orthogonal steepest descent directions. There-
fore, they improve the rate of convergence of the steepest descent method considerably.
Note that large numbers of iterations and function evaluations are needed to reach the
optimum.
TABLE 8-2 Optimum Solution for Example 8.5 with Steepest Descent Method:
f(x
1
, x
2
, x
3
) = x
2
1
+ 2x
2
2
+ 2x
2
3
+ 2x
1
x
2
+ 2x
2
x
3
Starting values of design variables: 2, 4, 10
Optimum design variables: 8.04787E-03, -6.81319E-03, 3.42174E-03
Optimum cost function value: 2.473 47E-05
Norm of gradient of the cost function at optimum: 4.970 71E-03
Number of iterations: 40
Total number of function evaluations: 753
Numerical Methods for Unconstrained Optimum Design 297
Actually, the conjugate gradient directions d
(i)
are orthogonal with respect to a symmetric
and positive definite matrix A, i.e., d
(i)
T
Ad
( j)
= 0 for all i and j, i π j. The conjugate gradient
algorithm is stated as follows:
Step 1. Estimate a starting design as x
(0)
. Set the iteration counter k = 0. Select the
convergence parameter e. Calculate
(8.21a)
Check stopping criterion. If ||c
(0)
|| < e, then stop. Otherwise, go to Step 4 (note that
Step 1 of the conjugate gradient and the steepest descent methods is the same).
Step 2. Compute the gradient of the cost function as c
(k)
=—f(x
(k)
).
Step 3. Calculate ||c
(k)
||. If ||c
(k)
|| < e, then stop; otherwise continue.
Step 4. Calculate the new conjugate direction as
(8.21b)
Step 5. Compute a step size a
k
= a to minimize f(x
(k)
ad
(k)
).
Step 6. Change the design as follows, set k = k + 1 and go to Step 2.
(8.22)
Note that the conjugate direction in Eq. (8.21b) satisfies the descent condition of Inequal-
ity (8.8). This can be shown by substituting d
(k)
from Eq. (8.21b) into Inequality (8.8) and
using the step size determination condition given in Eq. (8.11). The first step of the conju-
gate gradient method is just the steepest descent step. The only difference between the con-
jugate gradient and steepest descent methods is in Eq. (8.21b). In this step the current steepest
descent direction is modified by adding a scaled direction used in the previous iteration. The
scale factor is determined using lengths of the gradient vector at the two iterations as shown
in Eq. (8.21b). Thus, the conjugate direction is nothing but a deflected steepest descent direc-
tion. This is an extremely simple modification that requires little additional calculation. It
is, however, very effective in substantially improving the rate of convergence of the
steepest descent method. Therefore, the conjugate gradient method should always be pre-
ferred over the steepest descent method. In the next chapter an example is discussed that
compares the rate of convergence of the steepest descent, conjugate gradient, and Newton’s
methods. We shall see there that the method performs quite well compared with the other
two methods.
The conjugate gradient algorithm finds the minimum in n iterations for positive definite
quadratic functions having n design variables. For general functions, if the minimum has not
been found by then, it is recommended that the iterative process should be restarted every (n
+ 1) iterations for computational stability. That is, set x
(0)
= x
(n+1)
and restart the process from
Step 1 of the algorithm. The algorithm is very simple to program and works very well for
general unconstrained minimization problems. Example 8.6 illustrates the calculations
involved in the conjugate gradient method.
xx d
kk
k
k+
( ) () ()
=+
1
a
dc d cc
kk
k
k
k
kk
() ()
-
() ()
-
()
=- + =
()
bb
11
2
;
dc x
00 0
() () ()
=- =-—
()
f
298 INTRODUCTION TO OPTIMUM DESIGN
EXAMPLE 8.6 Use of Conjugate Gradient Algorithm
Consider the problem solved in Example 8.5: minimize
(a)
Carry out two iterations of the conjugate gradient method starting from the design (2,
4, 10).
Solution. The first iteration of the conjugate gradient method is the same as given
in Example 8.5:
(b)
(c)
The second iteration starts from Step 2 of the conjugate gradient algorithm:
2. (d)
3. ||c
(1)
|| = 7.952 > e, so continue.
4. (e)
(f)
5. Step size in the direction d
(1)
is calculated as a = 0.3156.
6. (g)
Calculating the gradient at this point, we get c
(2)
= (0.6238, -0.4246, 0.1926). ||c
2
|| =
0.7788 > e, so we need to continue the iterations. Note that c
(2)
· d
(1)
= 0.
The problem is solved using the conjugate gradient method available in the
IDESIGN software with e = 0.005 (Arora and Tseng, 1987a,b). Table 8-3 summarizes
performance results for the method. It can be seen that a very precise optimum is
obtained in only 4 iterations and 10 function evaluations. Comparing these with the
steepest descent method results given in Table 8-2, we conclude that the conjugate
gradient method is superior for this example.
The design is updated as x
2
0 0956
2 348
2 381
4 31241
3 81268
5 57838
1 4566
1 1447
0 6205
()
=-
È
Î
Í
Í
Í
˘
˚
˙
˙
˙
+
-
È
Î
Í
Í
Í
˘
˚
˙
˙
˙
=-
È
Î
Í
Í
Í
˘
˚
˙
˙
˙
.
.
.
.
.
.
.
.
.
a
dcd
11
1
0
4 500
4 438
4 828
0 015633
12
40
48
4 31241
3 81268
5 57838
() () ( )
=- + =
-
È
Î
Í
Í
Í
˘
˚
˙
˙
˙
+
()
-
-
-
È
Î
Í
Í
Í
˘
˚
˙
˙
˙
=
-
È
Î
Í
Í
Í
˘
˚
˙
˙
˙
b
.
.
.
.
.
.
.
b
1
0
2
2
7 952 63 3 0 015633=
[]
=
()
=
() ()
cc
1
cx
11
4 5 4 438 4 828 10 75
() ()
=- -
()
()
=., . , . , .f
x
1
0 0956 2 348 2 381
()
=-
()
.,.,.
ccx
000
12 40 48 63 6 332 0
() () ()
=
()
=
()
=,, ; ., .f
fxxxxxxxxxx
123 1
2
2
2
3
2
12 23
222 2,,
()
=+++ +
TABLE 8-3 Optimum Solution for Example 8.6 with the Conjugate Gradient Method:
f(x
1
, x
2
, x
3
) = x
2
1
+ 2x
2
2
+ 2x
2
3
+ 2x
1
x
2
+ 2x
2
x
3
Starting values of design variables: 2, 4, 10
Optimum design variables: -6.4550E-10, -5.8410E-10, 1.3150E-10.
Optimum cost function value: 6.8520E-20.
Norm of the gradient at optimum: 3.0512E-05.
Number of iterations: 4
Number of function evaluations: 10
Numerical Methods for Unconstrained Optimum Design 299
EXAMPLE 8.7 Use of Excel Solver
Solve the problem of Example 8.6 using Solver in Excel.
Solution. Figure 8-10 shows the worksheet and the Solver dialog box for the
problem. The worksheet for the problem can be prepared in several different ways as
explained earlier in Chapters 4 and 6. For the present example, cell D9 defines the
final expression for the cost function. Once the worksheet has been prepared, Solver
is invoked under the Tools tab, and the “Options” button is used to invoke the conju-
gate gradient method. The forward finite difference option is selected for calculation
of the gradient of the cost function. The algorithm converges to the solution reported
in Table 8-3 in five iterations.
FIGURE 8-10 Excel worksheet and Solver dialog box for Example 8.7.
Example 8.7 illustrates the use of Excel Solver to solve unconstrained optimization
problems.
Exercises for Chapter 8
Section 8.1 General Concepts Related to Numerical Algorithms
8.1 Answer True or False.
1. All optimum design algorithms require a starting point to initiate the iterative
process.
2. A vector of design changes must be computed at each iteration of the iterative
process.
3. The design change calculation can be divided into step size determination and
direction finding subproblems.
4. The search direction requires evaluation of the gradient of the cost function.
5. Step size along the search direction is always negative.
6. Step size along the search direction can be zero.
7. In unconstrained optimization, the cost function can increase for an arbitrary small
step along the descent direction.
8. A descent direction always exists if the current point is not a local minimum.
9. In unconstrained optimization, a direction of descent can be found at a point
where the gradient of the cost function is zero.
10. The descent direction makes an angle of 0–90° with the gradient of the cost
function.
Determine if the given direction at the point is that of descent for the following functions
(show all the calculations).
8.2 f(x) = 3x
2
1
+ 2x
1
+ 2x
2
2
+ 7; d = (-1, 1) at x = (2, 1)
8.3 f(x) = x
2
1
+ x
2
2
- 2x
1
- 2x
2
+ 4; d = (2, 1) at x = (1, 1)
8.4 f(x) = x
2
1
+ 2x
2
2
+ 2x
2
3
+ 2x
1
x
2
+ 2x
2
x
3
; d = (-3, 10, -12) at x = (1, 2, 3)
8.5 f(x) = 0.1x
2
1
+ x
2
2
- 10; d = (1, 2) at x = (4, 1)
8.6 f(x) = (x
1
- 2)
2
+ (x
2
- 1)
2
; d = (2, 3) at x = (4, 3)
8.7 f(x) = 10(x
2
- x
2
1
)
2
+ (1 - x
1
)
2
; d = (162, -40) at x = (2, 2)
8.8 f(x) = (x
1
- 2)
2
+ x
2
2
; d = (-2, 2) at x = (1, 1)
8.9 f(x) = 0.5x
2
1
+ x
2
2
- x
1
x
2
- 7x
1
- 7x
2
; d = (7, 6) at x = (1, 1)
8.10 f(x) = (x
1
+ x
2
)
2
+ (x
2
+ x
3
)
2
; d = (4, 8, 4,) at x = (1, 1, 1)
8.11 f(x) = x
2
1
+ x
2
2
+ x
2
3
; d = (2, 4, -2) at x = (1, 2, -1)
8.12 f(x) = (x
1
+ 3x
2
+ x
3
)
2
+ 4(x
1
- x
2
)
2
; d = (-2, -6, -2) at x = (-1, -1, -1)
8.13 f(x) = 9 - 8x
1
- 6x
2
- 4x
3
- 2x
2
1
+ 2x
2
2
+ x
2
3
+ 2x
1
x
2
+ 2x
2
x
3
; d = (-2, 2, 0) at x =
(1, 1, 1)
8.14 f(x) = (x
1
- 1)
2
+ (x
2
- 2)
2
+ (x
3
- 3)
2
+ (x
4
- 4)
2
; d = (2, -2, 2, -2) at x = (2, 1, 4, 3)
Section 8.2 Basic Ideas and Algorithms for Step Size Determination
8.15 Answer True or False.
1. Step size determination is always a one-dimensional problem.
2. In unconstrained optimization, the slope of the cost function along the descent
direction at zero step size is always positive.
300 INTRODUCTION TO OPTIMUM DESIGN
3. The optimum step lies outside the interval of uncertainty.
4. After initial bracketing, the golden section search requires two function
evaluations to reduce the interval of uncertainty.
8.16 Find the minimum of the function f(a) = 7a
2
- 20a + 22 using the equal interval
search method within an accuracy of 0.001. Use d = 0.05.
8.17 For the function f(a) = 7a
2
- 20a + 22, use the golden section method to find the
minimum with an accuracy of 0.005 (final interval of uncertainty should be less than
0.005). Use d = 0.05.
8.18 Write a computer program to implement the alternate equal interval search process
shown in Fig. 8.7 for any given function f(a). For the function f(a) = 2 - 4a =+e
a
,
use your program to find the minimum within an accuracy of 0.001. Use d = 0.50.
8.19 Consider the function f(x
1
, x
2
, x
3
) = x
2
1
+ 2x
2
2
+ 2x
2
3
+ 2x
1
x
2
+ 2x
2
x
3
. Verify whether the
vector d = (-12, -40, -48) at the point (2, 4, 10) is a descent direction for f. What is
the slope of the function at the given point? Find an optimum step size along d by
any numerical method.
8.20 Consider the function f(x) = x
2
1
+ x
2
2
- 2x
1
- 2x
2
+ 4. At the point (1, 1), let a search
direction be defined as d = (1, 2). Express f as a function of one variable at the given
point along d. Find an optimum step size along d analytically.
For the following functions, direction of change at a point is given. Derive the function of
one variable (line search function) that can be used to determine optimum step size (show
all calculations).
8.21 f(x) = 0.1x
2
1
+ x
2
2
- 10; d = (-1, -2) at x = (5, 1)
8.22 f(x) = (x
1
- 2)
2
+ (x
2
- 1)
2
; d = (-4, -6) at x = (4, 4)
8.23 f(x) = 10(x
2
- x
2
1
)
2
+ (1 - x
1
)
2
; d = (-162, 40) at x = (2, 2)
8.24 f(x) = (x
1
- 2)
2
+ x
2
2
; d = (2, -2) at x = (1, 1)
8.25 f(x) = 0.5x
2
1
+ x
2
2
- x
1
x
2
- 7x
1
- 7x
2
; d = (7, 6) at x = (1, 1)
8.26 f(x) = (x
1
+ x
2
)
2
+ (x
2
+ x
3
)
2
; d = (-4, -8, -4) at x = (1, 1, 1)
8.27 f(x) = x
2
1
+ x
2
2
+ x
2
3
; d = (-2, -4, 2) at x = (1, 2, -1)
8.28 f(x) = (x
1
+ 3x
2
+ x
3
)
2
+ 4(x
1
- x
2
)
2
; d = (1, 3, 1) at x = (-1, -1, -1)
8.29 f(x) = 9 - 8x
1
- 6x
2
- 4x
3
+ 2x
2
1
+ 2x
2
2
+ x
2
3
+ 2x
1
x
2
+ 2x
2
x
3
; d = (2, -2, 0) at x = (1, 1, 1)
8.30 f(x) = (x
1
- 1)
2
+ (x
2
- 2)
2
+ (x
3
- 3)
2
+ (x
4
- 4)
2
; d = (-2, 2, -2, 2) at x = (2, 1, 4, 3)
For the following problems, calculate the initial interval of uncertainty for the equal inter-
val search with d = 0.05 at the given point and the search direction.
8.31 Exercise 8.21 8.32 Exercise 8.22
8.33 Exercise 8.23 8.34 Exercise 8.24
8.35 Exercise 8.25 8.36 Exercise 8.26
8.37 Exercise 8.27 8.38 Exercise 8.28
8.39 Exercise 8.29 8.40 Exercise 8.30
Numerical Methods for Unconstrained Optimum Design 301
For the following problems, calculate the initial interval of uncertainty for the golden section
search with d = 0.05 at the given point and the search direction; then complete two itera-
tions of the Phase II of the method.
8.41 Exercise 8.21 8.42 Exercise 8.22
8.43 Exercise 8.23 8.44 Exercise 8.24
8.45 Exercise 8.25 8.46 Exercise 8.26
8.47 Exercise 8.27 8.48 Exercise 8.28
8.49 Exercise 8.29 8.50 Exercise 8.30
Section 8.3 Search Direction Determination: Steepest Descent Method
8.51 Answer True or False.
1. The steepest descent method is convergent.
2. The steepest descent method can converge to a local maximum point starting from
a point where the gradient of the function is nonzero.
3. Steepest descent directions are orthogonal to each other.
4. Steepest descent direction is orthogonal to the cost surface.
For the following problems, complete two iterations of the steepest descent method starting
from the given design point.
8.52 f(x
1
, x
2
) = x
2
1
+ 2x
2
2
- 4x
1
- 2x
1
x
2
; starting design (1, 1)
8.53 f(x
1
, x
2
) = 12.096x
2
1
+ 21.504x
2
2
- 1.7321x
1
- x
2
; starting design (1, 1)
8.54 f(x
1
, x
2
) = 6.983x
2
1
+ 12.415x
2
2
- x
1
; starting design (2, 1)
8.55 f(x
1
, x
2
) = 12.096x
2
1
+ 21.504x
2
2
- x
2
; starting design (1, 2)
8.56 f(x
1
, x
2
) = 25x
2
1
+ 20x
2
2
- 2x
1
- x
2
; starting design (3, 1)
8.57 f(x
1
, x
2
, x
3
) = x
2
1
+ 2x
2
2
+ 2x
2
3
+ 2x
1
x
2
+ 2x
2
x
3
; starting design (1, 1, 1)
8.58
Starting design (4, 6); the step size may be approximated or calculated using a
computer program.
8.59
Starting design (5, 2); the step size may be approximated or calculated using a
computer program.
8.60 f(x
1
, x
2
) = 100(x
2
- x
2
1
)
2
+ (1 - x
1
)
2
; starting design (5, 2)
8.61 f(x
1
, x
2
, x
3
, x
4
) = (x
1
- 10x
2
)
2
+ 5(x
3
- x
4
)
2
+ (x
2
- 2x
3
)
4
+ 10(x
1
- x
4
)
4
Let the starting design be (1, 2, 3, 4).
8.62 Solve Exercises 8.52 to 8.61 using the computer program given in Appendix D for
the steepest descent method.
fx x x x x x
xx x x x
x
12 1
2
2
2
1
2
2
2
2
1
2
2
2
212
9 9 100 20 100
64 16 64 5 41
,
()
=+- +- +
-+++
fx x x x x x
xx x x x
x
12 1
2
2
2
1
2
2
2
2
1
2
2
2
212
8 8 80 20 100
80 20 100 5 5
,
()
=+- +- +
-+++
302 INTRODUCTION TO OPTIMUM DESIGN
8.63 Consider the following three functions:
Minimize f
1
, f
2
, and f
3
using the program for the steepest descent method given in
Appendix D. Choose the starting design to be (1, 1, 2) for all functions. What do
you conclude from observing the performance of the method on the foregoing
functions?
8.64 Calculate the gradient of the following functions at the given points by the forward,
backward, and central difference approaches with a 1 percent change in the point and
compare them with the exact gradient:
1. f(x) = 12.096x
2
1
+ 21.504x
2
2
- 1.7321x
1
- x
2
at (5, 6)
2. f(x) = 50(x
2
- x
2
1
)
2
+ (2 - x
1
)
2
at (1, 2)
3. f(x) = x
2
1
+ 2x
2
2
+ 2x
2
3
+ 2x
1
x
2
+ 2x
2
x
3
at (1, 2, 3)
8.65 Consider the following optimization problem
Here u = (u
1
, u
2
, , u
n
) are components of a unit vector. Solve this optimization
problem and show that the u that maximizes the preceding objective function is
indeed in the direction of the gradient c.
Section 8.4 Search Direction Determination: Conjugate Gradient Method
8.66 Answer True or False.
1. The conjugate gradient method usually converges faster than the steepest descent
method.
2. Conjugate directions are computed from gradients of the cost function.
3. Conjugate directions are normal to each other.
4. The conjugate direction at the kth point is orthogonal to the gradient of the cost
function at the (k + l)th point when an exact step size is calculated.
5. The conjugate direction at the kth point is orthogonal to the gradient of the cost
function at the (k - 1)th point.
For the following problems, complete two iterations of the conjugate gradient method.
8.67 Exercise 8.52 8.68 Exercise 8.53
8.69 Exercise 8.54 8.70 Exercise 8.55
8.71 Exercise 8.56 8.72 Exercise 8.57
8.73 Exercise 8.58 8.74 Exercise 8.59
8.75 Exercise 8.60 8.76 Exercise 8.61
8.77 Write a computer program to implement the conjugate gradient method (or, modify
the steepest descent program given in Appendix D). Solve Exercises 8.52 to 8.61
using your program.
subject to the constraint u
i
i
n
2
1
1
=
Â
=
maximize u
f
x
i
i
n
i
=
Â
∂
∂
=◊
()
1
cu
fxxx fx x x f xx x
11
2
2
2
3
2
21
2
2
2
3
2
31
2
2
2
3
2
10 100 100 0 1=++ =+ + = ++;;.
Numerical Methods for Unconstrained Optimum Design 303
For the following problems, write an Excel worksheet and solve the problems using Solver.
8.78 Exercise 8.52 8.79 Exercise 8.53
8.80 Exercise 8.54 8.81 Exercise 8.55
8.82 Exercise 8.56 8.83 Exercise 8.57
8.84 Exercise 8.58 8.85 Exercise 8.59
8.86 Exercise 8.60 8.87 Exercise 8.61
304 INTRODUCTION TO OPTIMUM DESIGN
9 More on Numerical Methods for
Unconstrained Optimum Design
305
Upon completion of this chapter, you will be able to:
•
Use some alternate procedures for step size calculation
•
Explain properties of the gradient vector used in the steepest descent method
•
Use scaling of design variables to improve performance of optimization methods
•
Use the second-order methods for unconstrained optimization, such as the
Newton method and understand its limitations
•
Use approximate second-order methods for unconstrained optimization, called
quasi-Newton methods
•
Transform constrained problems to unconstrained problems and use unconstrained
optimization methods to solve them
The material of this chapter builds upon the basic concepts and numerical methods for
unconstrained problems presented in the previous chapter. Topics covered include polyno-
mial interpolation for step size calculation, properties of the gradient vector, a Newton method
that uses Hessian of the cost function in numerical optimization, scaling of design variables,
approximate second-order methods—called quasi-Newton methods, and transformation
methods that transform a constrained problem to an unconstrained problem so that uncon-
strained optimization methods can be used to solve constrained problems. These topics may
be omitted in an undergraduate course on optimum design or on first independent reading of
the text.
9.1 More on Step Size Determination
The interval reducing methods described in Chapter 8 can require too many function evalu-
ations during line search to determine an appropriate step size. In realistic engineering design
problems, the function evaluation requires a significant amount of computational effort.
Therefore, methods such as golden section search are inefficient for many practical applica-
tions. In this section, we present some other line search methods such as polynomial inter-
polation and inaccurate line search.
9.1.1 Polynomial Interpolation
Instead of evaluating the function at numerous trial points, we can pass a curve through a
limited number of points and use the analytical procedure to calculate the step size. Any con-
tinuous function on a given interval can be approximated as closely as desired by passing a
higher order polynomial through its data points and then calculating its minimum explicitly.
The minimum point of the approximating polynomial is often a good estimate of the exact
minimum of the line search function f(a). Thus, polynomial interpolation can be an efficient
technique for one-dimensional search. Whereas many polynomial interpolation schemes can
be devised, we will present two procedures based on quadratic interpolation.
Quadratic Curve Fitting Many times it is sufficient to approximate the function f(a) on
an interval of uncertainty by a quadratic function. To replace a function in an interval with
a quadratic function, we need to know the function value at three distinct points to determine
the three coefficients of the quadratic polynomial. It must also be assumed that the function
f(a) is sufficiently smooth and unimodal, and that the initial interval of uncertainty (a
l
, a
u
)
is known. Let a
i
be any intermediate point in the interval (a
l
, a
u
), and let f(a
l
), f(a
i
), and
f(a
u
) be the function values at the respective points. Figure 9-1 shows the function f(a) and
the quadratic function q(a) as its approximation in the interval (a
l
, a
u
). is the minimum
point of the quadratic function q(a) whereas a* is the exact minimum point of f(a). An
iteration can be used to improve the estimate for a*.
Any quadratic function q(a) can be expressed in the general form as
(9.1)
where a
0
, a
1
, and a
2
are the unknown coefficients. Since the function q(a) must have the same
value as the function f(a) at the points a
l
, a
i
, and a
u
, we get three equations in three unknowns
a
0
, a
1
, and a
2
as follows:
aa a f
uu u01 2
2
++ =
()
aa a
aa a f
ii i01 2
2
++ =
()
aa a
aa a f
ll l01 2
2
++ =
()
aa a
qaaaaaa
()
=+ +
01 2
2
a
a
306 INTRODUCTION TO OPTIMUM DESIGN
f (a)
f
(a)
q(a)
a
a
i
a
u
a*
a
a
l
Quadratic
approximation to f (a)
FIGURE 9-1 Quadratic approximation for a function f(a).